How Should Investors Adapt to the New Environment? 

July 24, 2023

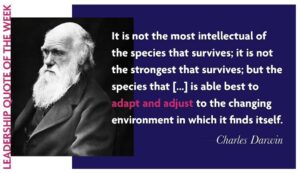
Let’s begin with our old friend Charles Darwin who famously said,

The New Environment

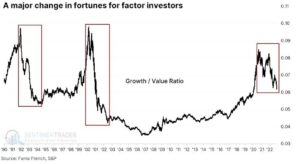
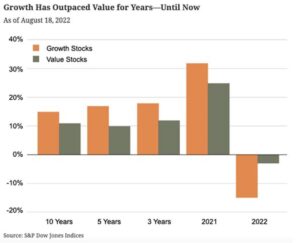
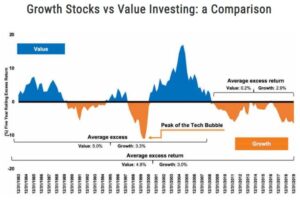
Regular readers know the high-level assumptions we are making regarding “The New Environment” .  Specifically, we have highlighted almost exhaustively, about the Big Three Investment Themes (Value, Commodities and Emerging Markets) that emerged as new leadership beginning in October of 2020.  These themes developed as a clear response to the New Environment we live in today.  So far in 2023, just like the summer of 2021, we have witnessed a short counter trend move, where things like speculative tech and overvalued growth names take the lead.  But, make no mistake, the primary trend leadership, dating back to 2020, remains with Value and Dividend Stocks, Commodities and Internationals.  Let’s unpack the New Environment to help us understand the importance of adapting our portfolios with an eye toward “survival” and finding the right balance of risk and reward.

These are the clear features of the New Environment that began in late 2020:

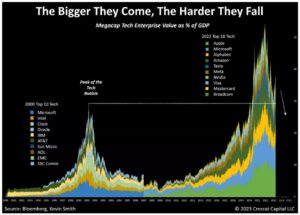
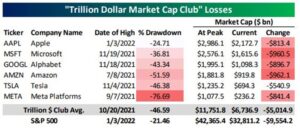
  • Rolling manias where investors are chasing the latest craze in order to make a quick buck. Rolling manias are indicative of a type of desperate and undisciplined investor who is struggling to make money and trades like a gambler.  Manias always end badly and destroy wealth for the vast majority of those who choose to play in this sandbox.  At the same time, manias can produce some lasting investment value if one is patient enough to find the real value these companies bring to the world. The short list in chronological order;

Bitcoin – still the domain of chaos investors, but Blockchain might be a lasting value.

Marijuana and Pot Stocks – Was very hot and now very dead

SPACs – Blank check Special Acquisition Companies – nothing left to see here.

COVID Unicorns – like Virgin Galactic, Peloton, Stitch Fix, Carvana, Chewy, etc.

Meme Stocks – Read all about it  https://www.nerdwallet.com/article/investing/meme-stocks

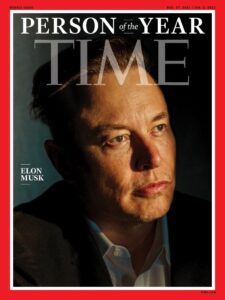
And now Artificial Intelligence (AI) – Real AI is not what we see today.  But it is coming.

  • Labor Costs are Permanently Higher

This is a good thing and a long time coming.  Nationalism trends are putting an end to the benefits of globalization (aka cheap labor overseas).  Stuff we buy looking forward will cost more as labor costs to mine it, assemble it, serve it, deliver it, solve it, are not going back to $7/hr.

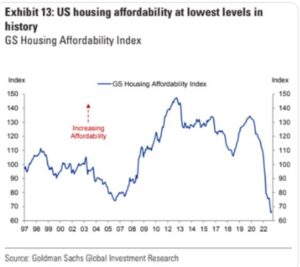
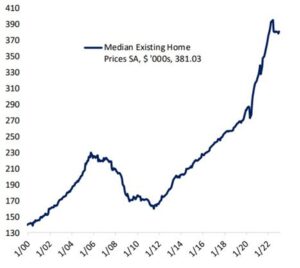
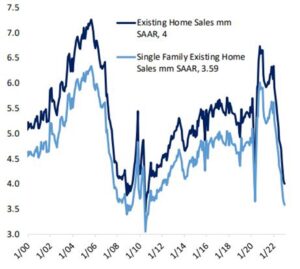
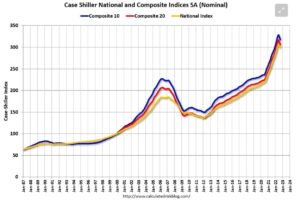
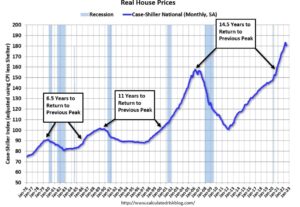
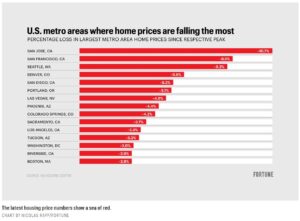
  • Costs of Shelter are Higher for Longer

For those looking for Real Estate prices to collapse in hopes that they can afford something… anything, you’re going to be in for a long wait.  Rental prices are falling thankfully but will not likely return to pre-2020 levels.  Homeowners do not need to move, do not need to sell and have no interest in trading in their 2.7% mortgage for a 6.6% mortgage.  Meanwhile, we have an entire generation of young people who want to buy real estate but still can’t afford it.  Prices will therefore remain high unless and until we have a very serious economic contraction or an historic burst of supply.

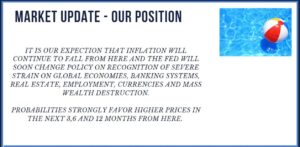
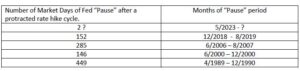
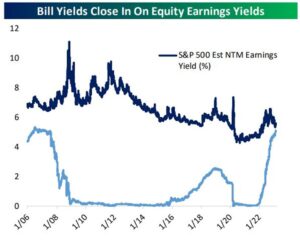
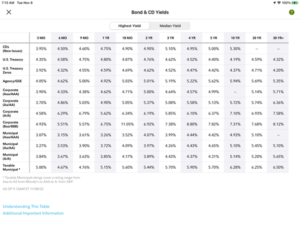
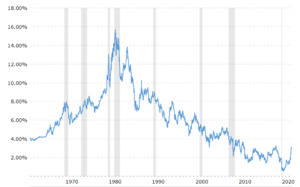
  • Costs of Capital are Higher for Longer

The Fed has been pretty clear about this, and they are likely to raise rates again on Wednesday.  They are working to get inflation down, but they are swimming against a 25-year tide of massive money printing, unlimited stimulus, and uncontained debt spending.  Our monetary system is going to be less friendly for the next 7-10 years if we are to find any form of sustainable balance again.  Be prepared for the fact that mortgage and loan rates (still stuck at 6.5%) will stubbornly not fall with stated inflation (now 3%).

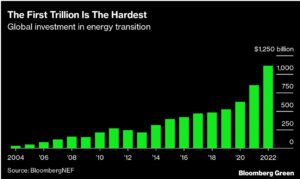
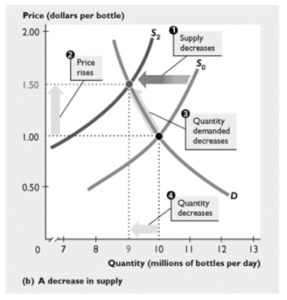
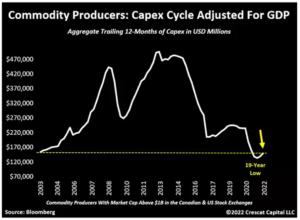
  • Underinvestment in commodities and raw materials

This is a topic, maybe THE topic, that just doesn’t get enough press in my mind.  Globally, we have not invested enough in the production of raw materials (think base metals, timber, oil and gas, silver, food commodities, etc.) to serve our global economies, even when they are barely growing as they are now.  The world is in short supply of raw materials and commodities  – I’ll provide more evidence in future updates.  Commodities prices are also far below levels that reflect these worldwide shortages.  Oil is moving back toward $80.  Did you notice?   Invest in Scarcity!

  • Climate Adaptation is Inflationary

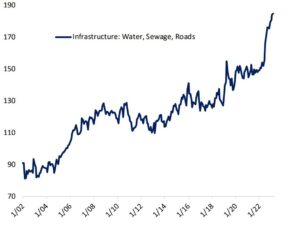
Our man-made climate problem is coming home to the bottom lines of corporations, homeowners, municipalities and our own Government (think FEMA).  To be clear, the costs are coming fast and hard from our need to respond to the natural environment we made for ourselves – heat and cold extremes, drought, wildfire and flood extremes all at the same time.  Select Insurance companies can’t afford to operate in entire states like California and Florida anymore.  And of course, crumbling or inadequate infrastructure can’t handle most of what’s happening as we’ve seen in places like Texas.  Adapting to climate change, is and will be, a very expensive and inflationary catalyst for the foreseeable future.

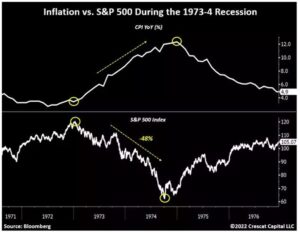
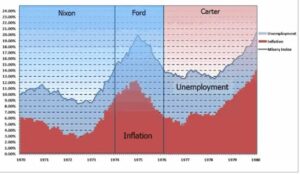
In summary, all that has happened since 2020 is not solely a response to and from COVID, but rather a culmination of variables that have been accruing since the late 80’s.  The New Environment is one that is persistently and stubbornly inflationary interrupted by rounds of soft economic data, even short recessions.  We are living this reality that folks in the 70’s would remember as a Stagflationary environment.  This is when the economy and most asset classes become stagnant, while inflation roots in at higher than desirable levels.

Darwinize Your Portfolio

Adjusting one’s investment portfolio regardless of the time frame, is necessary.  There is no such thing as set it and forget it as much as our industry would love for you to do that (good for fee revenue and no work for them!).  Our constant exposure/ passive investment strategies, called Wealth Beacon, do make changes but on long-term time horizons. These adjustments take the form of rebalancing, tax loss harvesting, possible upgrades to positions with lower costs and/ or tilting the portfolio toward asset classes and styles with better long term risk reward properties.  We do remain fully invested in all market conditions, however. Ultimately, with our passive strategies, we are working to keep client assets earning a market return with very high tax efficiency.  This is not a paired objective as many of our clients simply want a portion of their portfolio earning the full market’s return and are willing to accept the associated volatility.  Others are more focused on generating long term capital gains, so it works for them too.   The point is that nothing is truly passive, changes are necessary.

If we consider our dynamic asset allocation strategies, our New Environment offers investors some very attractive opportunities that will increase returns, increase true diversification, and reduce risk of large losses with only a few minor changes.

Adding Full Exposure to Commodities to our Dynamic Asset Allocation Strategies

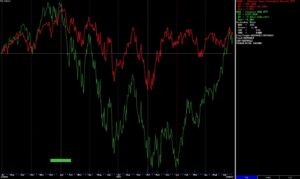
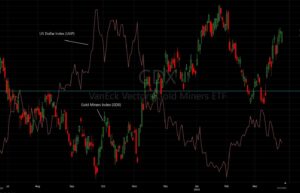
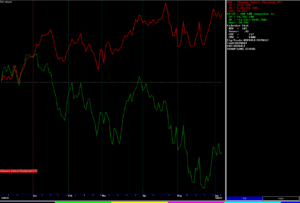
A picture (chart) is worth a thousand words so consider this two-year chart ending 7/21/2023.

Yellow line – (PDBC), A complete Commodities ETF with no k-1

Purple line – (GLD), A gold bullion ETF

Light Blue line – (SPY) The S&P 500 Index

Green line – (AGG) Ishares Aggregate Bond ETF

Red Line – (AMZN)  Amazon Stock
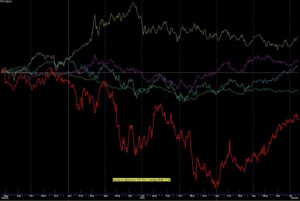
What do we see?

We see that over the last 24 months, in the New Environment, Commodities and Gold are the best performers compared to stocks, bonds and the mother of all investments owned by all,  Amazon.

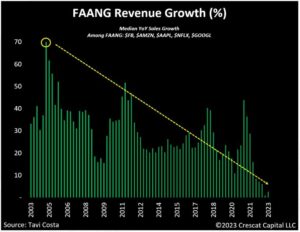
Perhaps this is just an anomaly and one of those cycles that favors a bizarre asset class like commodities or gold.  Or dare I say these dangerous words; This time is different.  If we are willing to open our eyes to what is happening, we see that stocks in general are again approaching one of the highest valuation levels in history.  Bonds are caught between the Fed and the hard place.  Amazon and company is becoming a low profit consumer staple stock.  Meanwhile commodities and gold are in short supply with very high demand with extremely low empirical valuations and paying out attractive dividends to shareholders.  We are bound only by our imaginations to consider a somewhat permanent allocation to both commodities and gold now.

Let’s do some quick math for a traditional 60% stock/ 40% bond portfolio since the end of 2021 when the New Environment was first recognized.  I’ll even use the Dow Jones Industrial Average as the best performing index as the “stock” proxy.  For bonds, let’s use the AGG bond index.

Total returns since 12/31/2021 – 7/21/2023 for different asset mixes

60/40                   -4.32%

What if we had more stocks and less bonds, say 80% stocks and 20% bonds

80/20                   -2.16% (OK but could be better!)

Now what if we added 15% Commodities and 5% gold to the mix?

60 (stock)/ 15% (commodities)/ 5% (Gold)/ 20% (bonds)

The results are a positive 0.62%

But importantly the very worst portfolio drawdown you would have experienced in 2022 was approximately -2.5% in late September. 

I can see the future with perfect hindsight!  Kidding.  Of course, this begins to look like an exercise in building the perfect portfolio with past performance.  Also note that the same mix of stocks, commodities, gold and bonds would only be up 5% YTD versus the Dow which is up 8%.  What we are not trying to accomplish is a manic race to generate high returns or even beat one index versus another.

What we are after is the following:

  • A Darwinian portfolio that is adapting to the New Environment.
  • A portfolio designed to survive in a stagflationary environment that doesn’t have 20-30% periodic losses every year or two.
  • A positive return that doesn’t depend on the Fed coming to the rescue.
  • A portfolio that allows us to sleep at night regardless of the headlines we wake up to every morning.

Why Should Our Clients Care?

Please excuse the shameless promotion but this is the type of analysis and portfolio management that we provide to our clients in their managed accounts.  We make adjustments as needed, when needed within each strategy.  Every client has a mix of strategies that is designed to meet their financial planning goals, cash flow needs, tax considerations and general expectations.  Our clients should not feel the need to call with questions like – What do you think of AI stocks, or Should I just put everything into a high yielding savings account?  Our investment strategies adjust to both risk and return opportunities as environments dictate.  Some move very slowly, others move faster.  We relieve you of the need to wonder if you’re in the right place with your hard-earned investment dollars.

I offer this commentary as an example of the type of adaptations we are making on your behalf.  This is why you pay us, and this is part of our value as your holistic wealth manager.

Enough with the infomercial!

I hope you are well and enjoying the HOT, HOT summer.  Wow, hot.

Regards,

Sam Jones

The Alternative to Being a Landlord

July 17, 2023

The Alternative to Being a Landlord

It seems that everyone I speak to these days is looking for passive income, usually in the form of a rental property.  Of course, real estate of any kind is now in short supply, with historically high prices and heavy carrying costs.  Let’s peel back the shell of owning hard asset real estate for investment purposes and consider the alternatives.

My Personal Disaster

Scott met me at our newly purchased Sherman Street office building in a vintage yellow Mercedes Benz.  It looked like something his grandmother gave him.  I was working to rent the office before moving All Season Financial Advisors into the space in 1999.  Scott needed some short-term office space for his new thriving business on the world wide web.  We signed a quick lease for 6 months and it didn’t take long for me to discover that “Scott” also needed a place to live and had a very healthy on-line gambling habit.  Scott paid the first month’s rent but that was the last of it.  I tried to evict him with attorneys but alas Colorado state law favors the tenant, and he stayed rent free for over a year.  He trashed the place and vanished in the end.  My total rent for a year was one month’s rent and his damage deposit.  Costs to me all in were over $8000 with attorneys, replacing the carpet, and deductibles for a water damage claim.  In addition, my taxes doubled that year as new owner of the property as did my homeowners insurance after making the claim.  It was an amazingly poor experience with a negative “return” on my investment and a year of high blood pressure.  I felt trapped in a losing situation with an expensive asset and that is a bad feeling.  I’m sure others who are better at this than I, know how to find good tenants and keep a rental property spinning profitably.   Personally, I’m a bit scarred from my landlord experience and probably won’t ever do it again.

Real estate also has a growing Total Cost of Ownership (TCO).   After nearly 30 years of historically low carrying costs like mortgage rates in the 2’s (%), utility costs that are lower than your weekly coffee budget, and taxes that don’t seem significant, we have been conditioned to just focus on the purchase price of any real estate.  But those days are really over now.  Tax assessments in 2023 were shockingly high after the run up in prices over the last few years.  Homeowners insurance is also ramping up 20-30% over the last couple years as they attempt to socialize the rising costs of climate disasters in vulnerable areas.

This happened on Thursday if you hadn’t heard:

(The Hill) – Farmers Insurance will end its home, auto and umbrella coverage in Florida and curtail coverage offerings in California due to ongoing risks from environmental disaster, the insurer announced Tuesday.

If you happen to need a new roof, or some work done on your house this summer, you know that finding a contractor is nearly impossible and then the cost to get anything is truly unbelievable.

All things considered, when we look at the affordability index (below),

and combine this with the rising Total Costs of Ownership, it seems pretty obvious that investment property and rentals are not going to generate much passive income for investors until the situation changes rather dramatically.  To be clear, we’re not talking about your primary residence or other personal use property but rather the prospect of buying property in order to generate rental income.

A Real Alternative

Now, if only there were a way to buy a commission free, diversified pool of income producing real estate with daily liquidity,  positive and dependable income, and no troublesome tenants, taxes or insurance.

Wait there is such a thing!  Real Estate Investment Trusts (REITS!)

REITS Offer High Total Returns and Staying Power

Let’s look backwards for a minute noting that past performance is not guarantee of future results.  REITS have outperformed stocks for at least the last 20 years.  Certainly, we have to consider the strong tailwind of falling interest rates over this time period and temper our future expectations.  But the facts are what they are.

I want to present this information using the Dalbar study on real investor returns.  First consider that over the last 20 years, REITS have outperformed nearly all other asset classes (ex-Gold).  Who knew? REITS generate a total return that is a combination of price change and dividend payments.  Today, we are finding REITS in many forms that are paying 7-10% dividends despite the trend of prices.  If you look at the Dalbar chart above, you might notice the yellow “Average Investor” bar that shows a relatively poor 20-year return of only 2.9%.  Remember this is a study of actual investor portfolios conducted by Dalbar every year with a 20 year look back.  Now I want to explain why owning a REIT paying 7-10% interest can help investors avoid the negative behavioral effect we see so often.

Behaviorally speaking, the reason why investors do so poorly is that they have a strong and repeat tendency to buy high and sell low.  Buying high isn’t as much of a problem as selling low.  But why does our silly lizard brain ultimately drive us to sell low?  Well because the human brain is preprogrammed to avoid pain and the pain of loss at bear market lows simply becomes “unbearable” (unable to withstand a bear – Ha!).  But, but, but, if we were getting paid 7-10% in dividends on our holdings, despite the prices of these securities being down 15-25%, we have much better staying power.  That is why I have over 50% of my personal net worth in our MASS Income model which has an estimated dividend yield of 8.8%.  If I focus on price alone, I might get sad.  But then I see multiple dividends of $500-$800 + come to me in waves around the end of each month and I think “ at least I’m getting paid really well to wait for prices to move higher again”.  Emotionally, when we are receiving regular high income on our investments, we are much less prone to reacting to our fears.

REITS:  Why Now?

After a bloody 2022 on the price side, REITS are now very attractively priced again and paying historically high dividend rates.  Several of our positions like AGNC Investment Co (AGNC) and Annaly Capital (NLY) already cut their dividends by over 20% in the last couple years as cash flows from operations fell.  But they are still paying over 13% in annual dividends with improving balance sheets and rising revenues.  Price trends also appear to have bottomed with the market in October of 2022, but gains have been somewhat muted against continued pressure and chatter from the Fed.  REITS are highly reactive to changes in interest rates and the Fed has not been a friend since March of 2022.  But with inflation having completed a full return to pre-pandemic levels, the Fed is likely done with their rate hike cycle.  Historically speaking, when the Federal Reserve ends their rate hiking cycles, it tends to be a very good environment for interest sensitive sectors like REITS, banks, financials, etc. REITS look good now, especially compared to the risks and rising costs of purchasing hard asset real estate now.  REITS importantly offer incredibly high liquidity especially when we can purchase them using closed end funds and ETFs.  They pay very high dividends, and most are now trading at 10-12% discounts.  The second half of 2023 should be an excellent environment.

For those invested in our Multi-ASSet Income strategy (MASS Income), REITs represent a little more than 40% of our 42 holdings.  The remainder is held in credit funds, preferred securities, bank loans, business loans (BDCs), fixed income and select high dividend paying stocks.  I think of MASS Income as a REIT strategy but really it’s far more diversified than just that asset class.  Our goal is to remain fully invested in all markets in order to generate secure annual dividends and income in the 7-10% range.  As our investors know, there is plenty of price volatility in this strategy, but the income keeps rolling in, month after month after month.

As always, my intention with these updates is to set expectations, guide good behavior as investors, and present timely solutions for you to consider. Stay tuned as there are new opportunities (and new risks) as this relief rally in the stock market matures.  I’ll be guiding you through the changes in the economy and the markets more frequently now, moving toward weekly updates.

I hope everyone is enjoying the very belly button of summer!

Cheers,

Sam Jones


Mid-Year Checkup

July 3, 2023

It’s been a wild first 6 months of the year with big winners and big losers inside all asset classes.  As I look across the landscape at all market indices, as well as our own strategies, looking back to the top of the bull market in December of 2021, I see that nearly everything has arrived at the same place in terms of performance.  This is the yin and yang of market cycles where we recognize that adding risk to one’s portfolio often just leads to adding volatility and not necessarily long-term returns.  Of course,  timing is everything.  Let’s dive into the details and some performance numbers and I’ll finish with some opportunities developing for the second half of 2023.

My First Investment

My first investment was a total loss, nearly 100%.  When my girlfriend (now wife, Sarah) and I got out of college, her parents gave us an unthinkable amount of “starter” money – $10,000.  We were working day jobs and didn’t need it immediately. My smart 22-year-old self, called a broker friend from Wachovia bank and asked what I should invest in that will make big returns!  At the time, 1990, Trimble Navigation (TRMB) was a company on fire; satellites were big business, and they were going to the moon.  I put all $10,000 into TRMB and paid a $280 commission for the shares.  The stock topped out a month later and fell 83%.  I panicked and sold right at the lows and lost the majority of our nest egg.  My broker friend waived the sale commission because he felt bad.  I never told my wife but felt the utter shame and frustration of my first catastrophic investment failure including the consequential loss of confidence and financial freedom.  But that wasn’t the end of my pain.  TRMB went to climb to new highs the next year and has made 15%/ year on average for the last three decades through last week, without me. I learned that timing matters.  I learned that I am human and prone to making bad decisions even with good companies.  I learned that there must be a better way to balance risk and return.  I learned about true diversification.  Today, I hope to bring 30 years of experience to the management of our client’s assets, always working to find that right balance and avoid catastrophic, unrecoverable losses.  This is what we do for all clients of All Season Financial in all forms.

See You on the Other Side!

It was October 5th, 2022, when we stood in front of our clients at our annual meeting at the Wellshire Country Club and offered this summary slide.  We called the pending rally in stocks and bonds, a “Relief Rally”.

Few in the room believed it.  After all, the S&P 500 was down -26% at that meeting.

Five days after our meeting, global stock and bond markets bottomed.  Good call!

But let’s look a little deeper into the market to understand what has happened since those lows.

As we would expect, the biggest winners on our relief rally since last October, have come from the same side of the market that was decimated in 2022.  Mega cap technology companies like Netflix, Meta (Facebook), Google and Amazon were down 30-75% at their worst in 2022.  But they have recovered a majority of those losses thus far in 2023.  Comparatively, other areas of the market like Value and Dividend payers which lost almost nothing in 2022, have gained almost nothing in 2023 but remain steady just below the all-time highs.  Looking back at a two-year chart (below) we see two paths to the same destination.  The red line is the iShares Dividend Growth ETF (DGRO), and the green line is the Nasdaq 100 ETF (QQQ) or mega cap growth index.  Obviously the two worlds have come together in terms of performance with the Nasdaq 100 simply going about it the hard way.  I’ll see you on the other side!  As I said in the introduction, adding risk has simply added volatility to your portfolio, not returns, if you are willing to look beyond the last 6 months.

Of course, what happens next matters a great deal in terms of comparative performance.  Stay tuned as we are very likely at an important inflection point for market leadership.

From the Top

Looking back at the last two years, a similar comparison can be made looking at different investment strategies and methods.  Our passive strategies called Wealth Beacon represent different mixes of stock and bond indices.  As we would expect, these strategies fell harder in 2022, but have recovered stronger in 2023, just like the green line above.  Our active, risk management strategies like our flagship All Season strategy, experienced mild losses in 2022 but have not gained much ground thus far in 2023, just like the red line above.  In the end, after a full market cycle, we see the two coming together in total returns.

From the top of the market on 12/31/21 to present we see the losses (or total returns) are very similar for all strategies as well as the broad market averages over the period.  Strategy performance numbers presented below are preliminary, unaudited and based on model accounts net of all fees as of the writing of this update (6/26/2023).

Returns (losses) from the top of the market 12/31/21 – 6/26/2023.

S&P 500 Index                                                                    -9.18%

Wealth Beacon Aggressive (passive)                        -10.14%

Wealth Beacon Moderate (passive)                          -9.70%

Wealth Beacon Conservative (passive)                    -9.59%

All Season (Risk Managed)                                            -9.88%

Again, what happens in the second half of 2023 will provide more clarity on leadership and strategy advantages. But as of this midyear checkup, it’s all the same.

Opportunities and Risks for the Second Half

If I had to pick just one thing that represents the greatest systematic risk to investors today, it is the overwhelming concentration of wealth in just a few names, 8 of them to be exact.  These are names that you hear every day in the media.

Microsoft

Apple

Google

Meta (Facebook)

Netflix

Nvidia

Amazon

Tesla

These are great companies make no mistake, but from a valuation, revenue growth, free cash flow, price to book and price to earnings basis, they are now some of the most expensive, overpriced securities in the world today.  Crescat Capital does some incredible work on the state of Mega cap technology stocks.  They point to the fact that the median Year over Year sales growth among “FAANG” names has just gone negative for the first time in two decades.  Focus on the last 5 years of the chart below.

Priced to perfection is an understatement.  Beyond valuations, there are significant headwinds coming now from changes in privacy regulations, diminishing dollar volume of on-line advertising, anti- trust regulations, global tensions, and competition.  The AI frenzy offered a nice boost in recent months, but I’m not convinced these same names will be the leaders in the end.  Fun fact from Seeking Alpha last week with data as of 6/23/23; the 8 names listed above account for slightly more than 100% of the gain YTD in the S&P 500.  The other 492 stocks in the index have an average return of -1%.  Wow!

Most investors don’t realize how much exposure and concentration of their wealth is in these names by way of simple mutual fund or ETF index ownership.  Factually, these mega cap names are in the top ten holdings of nearly every fund and ETF within these investment categories:

Large Cap Growth

Large Cap Value!

Mid Cap Growth

S&P 500 Index funds

Total Stock Market funds

Every 401k plan and every standard asset allocation portfolio seems to own the same mix of the funds above.  Is this a diversified portfolio when all funds own the same securities in bulk?  Hardly.

What’s the point?

As your asset manager, our job is to allocate your money into securities, sectors, countries and asset classes that offer favorable characteristics in terms of risk and reward.  Conversely, our job is not to pile your hard-earned money into overbought, overvalued, overhyped investments just because they are winning the popularity contest (Trimble Navigation!).  The time to buy mega cap technology was October of 2022.  Now, may very well prove to be the time to take profits.

What do we find attractive now?

Now that we have clearly identified where risk lives, let’s put our fingers on three real opportunities for the second half of 2023.

#1 Small Cap Value

I’m intrigued by this style and size category for future investment.  Take a look at the returns of the basic I Shares Small Cap Value ETF (IJS).

While the 1-year numbers are still negative (-7.08%), look at the 3 yr. numbers of +24.95% annualized.  IJS also posts an average P/E of 10.5 and Price/ Book ratio of 1.25 which is less than ½ the very rich valuation of your basic S&P 500 index fund and 1/3 the valuation of the Nasdaq 100.  And under the hood of Small Cap Value, you will not find any mega cap tech – wink!  Today we have significant allocations to small cap value which are only up +4.95% YTD.   We remain disciplined and patient as we expect this style box investment to begin outperforming in the second half of 2023.

#2 Internationals/ Emerging Markets

No need to wait for performance here.  Internationals have been outperforming the US stock market since the lows last October.  Consider the following total returns from 10/11/2022 – 6/26/2023:

Dow Jones Industrial Average (DIA)            +17.61%

S&P 500 (SPY)                                                       +23.48%

Europe/Far East/ Asia (EFA)                            +31.21%

All Country Word Index ex US (ACWX)       +25.67%

Regular readers know that internationals, like small cap value, are priced at less than 1/3 of the valuations we see in the broad US large caps today.  Stronger performance at 1/3 the price.  Sounds good!  We remain fully allocated to internationals and emerging markets.

#3 REITS, High Dividend and High-Income securities

Admittedly, it’s been a rough go for this group of investments in the last 6-12 months.  The Fed pushing up short term interest rates by 5% in the shortest time period in history, has been a headwind to say the least.  Now it appears they are done raising rates and are likely to pause for the better part of the next 6 months (TBD). Inflation is sticky and inflation is still real, but they have done a tremendous amount of damage to the banking system, real estate, credit markets and lending since March of last year.  The Fed has poured gallons of water into the gas tank of our economic engine and now they are waiting to see if and when our car will stop. It will stop.

IF, and this is a big IF, the Fed is actually done raising rates, we will see the market begin to accumulate and bid UP the prices of securities that are highly impacted by interest rates.  Since the last Fed meeting on June 14th, I have witnessed a new level of buying interest in this space, so we see the opportunity developing now.  As time goes on and we move into the second half of 2023, this could become a huge total return opportunity especially if recessionary pressure continues to build.

Our Multi-Asset Income strategy is still down over 19% since the all-time highs in 2021 on a total return, net of fee basis.  I know it and feel it, because this strategy remains my personal largest holding by a long shot.  It is frustrating to see growth investments with no dividends and crazy valuations rocketing higher while REITS, preferred securities, Bank loans, credit funds and direct lending securities paying over 8% in aggregate, sit on the sidelines of the performance charts.  Maybe Warren Buffett and I are the last investors who like their investments to pay high income.  I like income because it pays rain or shine and lets the magic of compounding work to our advantage.  8% annual income is very attractive to me and when the price trends turn higher, we get into double digit total returns in a hurry.

Our Value to You

The main points we want you to take away from this update are simply this;  You have entrusted us to manage your money by allocating your assets appropriately to sectors, countries and asset classes that offer attractive risk and return characteristics.  We do this across all investment strategies in our company.  Today the markets are rewarding only a very thin slice of the investment landscape that now has poor risk reward characteristics looking forward.  We understand that it’s difficult to watch the market run up as it has while your portfolio seems to be lagging.  This is one of those times when emotions get in the way of rational, disciplined, needs based, investment decisions.  Fear of Missing Out (FOMO) is loud, we get it. Please excuse us while we choose to stay disciplined and follow our system as we have done for the last 30 years.  Patience now is critical as the second half of 2023 is queuing up to be very different than the first half.

Beyond allocating your assets appropriately, our other main value as your advisor is to set expectations and offer you a clear and honest assessment of conditions whether it is popular or not.  Our fiduciary loyalty is to our clients and meeting your long-term objectives for cash flow and financial independence as identified in the financial planning process.  Hopefully, this type of communication helps set those expectations and guides your understanding of what we are doing with your investment assets toward that end.

As always, we appreciate your continued trust and confidence in our firm, and we look forward to serving you to the greatest extent possible.

Sincerely,

Sam Jones

President, Chief Investment Officer


Recency Bias

June 12, 2023

This seems like an important moment in time for a little investor education.  We’re going to talk about Recency Bias and apply the principle to a growing list of extended trends (both highs and lows) in today’s financial landscape.  I’ll finish with some evergreen recommendations to focus on the things you can control.  Here we go.

But first, what is Recency Bias? 

*Gratefully written by Chat GPT because I’m in the airport and a little jet lagged.

Recency bias is a cognitive bias that affects individuals’ decision-making processes, including those of investors. It refers to the tendency to give more weight or importance to recent events or information while disregarding or downplaying older or historical data. In other words, people tend to believe that what has happened recently is more relevant and representative of the future than what has happened in the past.

For investors, recency bias can lead to several risks:

Overemphasis on short-term trends: Investors influenced by recency bias may focus too much on the short-term performance of an investment, such as the stock market’s recent gains or losses. They might assume that these trends will continue indefinitely and base their investment decisions solely on recent performance, ignoring the long-term fundamentals of the investment.

Chasing performance: Recency bias can lead investors to chase after investments or asset classes that have recently performed well, assuming that the trend will continue. This behavior can result in buying at high prices, when assets may already be overvalued, and selling at low prices, when assets may be undervalued. Such performance chasing can lead to buying at the top and selling at the bottom, resulting in poor investment outcomes.

Failure to diversify: Recency bias can make investors overly focused on the most recent successful investments or sectors, causing them to neglect diversification. Diversification is an essential risk management strategy that involves spreading investments across different asset classes, sectors, and geographic regions. Neglecting diversification due to recency bias can expose investors to concentrated risks if a particular investment or sector experiences a downturn.

Me again.

Pretty ok commentary from Chat right?  And as generic as we should expect (wink).

If seasoned investors know one thing about the markets, it is this;  Change is the only constant.  Trends that seem forever persistent, are never persistent.  Investment strategies that have worked for years, ultimately stop working.  Stocks that always go up, eventually stop going up.  Nothing is forever, nothing is guaranteed in the world of finance.

So, let’s point to some obvious recency bias embedded in our financial psychology.  Some of these are short term, some are longer term, but for this update, I’m going to concentrate only on areas that appear especially prone to reversal in the coming months.

Bonds

I know boring.  Bear with me.  Now that congress has pushed the debt ceiling issue out for another 24 months (applause), we can turn our attention to Treasury Bonds to look for opportunities.  Recency bias wants us to believe that bonds will continue to do what they have done in recent history.   We recognize that Treasury bonds, especially longer-term Treasury bonds, have been very poor performers over the last 18 months.  In 2022, Treasury bonds lost roughly 16% and have continued to chop lower in 2023.  Investor surveys confirm that bonds are expected to be the worst performing asset class for the next 12 months.  And thus, in true contrarian fashion, the table is set for Treasury bonds to post impressive results, beginning on the next Fed meeting on June 14th.  As the current pockets of recession (talk to your local retailer or restaurant owner) spread and expand to the US economy at large and real inflation dives below 3%, Treasury bonds will become very attractive again.

Real Estate

Recency bias in real estate is an amazing juggernaut now.  I hear words like “unbelievable” and “Crazy.”  Indeed!  Toll Brothers, one of our nation’s largest home builders has been raising prices on their new homes for the last three months!  Prices are seemingly steady and strong at historically high and unaffordable levels.  This is happening as the 30-year fixed mortgage rate seems to be settling around 7% again.  There are only two explanations for what’s happening.  People have lost their minds or there is a lot more money out there than we think.  The answer is probably both.  My outsiders’ opinion is that the only people who can afford to buy homes at the moment are those who are economically insensitive (aka very wealthy), and most are paying with cash.  Outside of these select high profile deals, the real estate market is frozen, like ice age frozen.  High prices and high mortgage rates cannot coexist for any substantial length of time but sands in this hourglass are nearing the end.  Keep an eye out for something to break here.  Prices are quietly down double digits in 2023 in more than a few counties across the country with the West leading lower.

Technology

Well, here we are again. Technology seems to be the only game in town, literally the only thing up significantly in 2023.  As a sector, it is also the most overvalued and overhyped focus of investor attention I have seen since the dot com days of 1999.  Artificial intelligence is driving the frenzy.  Anything AI gets a boost and an absurd valuation today.  Nvidia is now a $Trillion company with a market enterprise value larger than the entire semiconductor industry in aggregate.  Ridiculous.  I’ve seen this movie before, several times actually.  I won’t be that guy that tries to call a top, because these things can go further and higher than our imaginations.  But I will say, buyer beware from this day forward. Recency bias says semiconductors of the Nvidia and AMD type are going to the moon.  Recency bias gets angry when we see these gains and wonder why we don’t have huge exposure to this sure thing.  Recency bias says this is just the beginning and we had better get on board.   But recency bias will again be the root of investor pain, especially those who are late to this party.

Value is Not Dead

Last month, I suggested we banish our Lizard Brains and consider the real possibility that stocks could move higher in aggregate against a backdrop of very sour investor perspectives.  Well, now we see it happening (finally).  Style and size investments in small-caps, mid-caps,  value, dividend payers and internationals, which dominate our risk managed strategies have been sitting on the bench for most of 2023.  Now they are waking up in a big way.  Recency bias thinks value investing styles, in the intrinsic sense of the word, is dead.  Value is a long way from dead and now offers investors another overdue opportunity.

Cash is Calling

Cash earning a free and easy 5%/ year is probably the greatest recency bias appeal of the year.  I certainly can’t argue that everyone’s cash should be earning 4-5% at this point.  That means your bank savings or any other form of cash that must be available on short notice. But let’s unpack the idea that one should sit in cash instead of stocks, or bonds or any other form of investment right now.  First, this is the top of the cycle for rates – the Fed is done raising rates and thus the interest earned in money markets and short-term bonds is also at the top.  These rates will drop back toward 2-3% in the next 6-9 months.  Also, when we choose cash as an investment, we have timing considerations.  When do we sell to cash, when will be buy back in?  Not so easy.  Sitting in cash with “investment” dollars also assumes that one knows the future of the markets and the economy and has determined with clairvoyance that cash is going to be the best option.  Maybe, but history has proven otherwise.  Alternatively, why not consider any number of stocks or funds paying 4-5% in dividends – best of both worlds, right?  How about buying some bonds trading at a discount and paying 4-5% interest as we head into a recession?  How about we just stick to our program and long-term investment strategies and let the markets, diversification and our tactical strategies handle those pesky risk and reward decisions.  Cash looks great right now, I get it.  But never, in my career have I been happy sitting in cash with my investment dollars for any period of time.  Bespoke offered this data point over the weekend.  Interest in buying investment securities is almost at an all time low!

I suspect the competition from higher yielding cash must have something to do with this but low interest in financial products has typically been an excellent longer term buy signal for everything outside of cash.  We will see!

Control What You Can

I’ll keep this brief and to the point:

A rational person who is free of recency bias would be doing the following:

  1. Looking for ways to cut costs and unnecessary expenses in a world that is still under inflationary pressure.
  2. Continue adding to investment portfolios on regular intervals and resist the urge to sit on piles of cash.
  3. Consider spending some time, money and energy getting comfortable in your home. You’re going to be there for a long time.  Start budgeting for a remodel, landscaping, new deck, furniture, or super energy efficient appliances?
  4. Reach out to your favorite friends and family. Stay connected and make plans.  Relationships are the only things that we remember in the end.
  5. Remain patient with investments. You do not need to make money every day, every week, and every quarter.  The dominant direction for stocks throughout time is sideways with brief periods of time pushing out to new highs.  You will be hard pressed to find a stock index trading above where it was in January of 2021.  Patience is something in your control.
  6. Become the MVP in your workplace. Employment is not a right, it is earned.  Stay in control of your income by staying employed as we head into recession.

Bonus commentary – Europe is Thriving

I’m writing this commentary on a return flight from Spain where I just spent a wonderful week with my wife Sarah, celebrating our 30 years together.  San Sebastián on the northern coast of Basque country is amazing with long sandy beaches, rich food, amazing history, and kind people.  We walked and biked everywhere, stayed in a beautiful hotel for a few days and a charming Air BnB apartment in old town.  We hadn’t been to Europe in a while and I found myself amazed.

Europe is thriving and cheap, at least Spain is cheap.  If you read the daily headlines in the US, you might think that Europe is in trouble, at risk with a Russian led energy crisis, struggling with leadership and immigration problems.  I found just the opposite.  Europeans, especially in Spain have completely recovered from COVID and don’t seem impacted by the war in Ukraine.  By my estimates, outside of petrol, the cost of living are about 40% lower than the US even after the exchange rate.  The best cup of coffee is 1.75 Euros versus $6 at Starbucks.  Dinner for two at a very nice restaurant – 60 Euros.  A super cute, two bedroom, centrally located Airbnb with all new everything, 160 Euros/ night.  People are very healthy, fit and find time every day to enjoy each other attending local futbol or having a glass of Rioja (or three).  The work culture is strong and vibrant, people are busy.  Taxis arrive on time with chatty drivers.  The brick and cobbled streets which are wet cleaned each and every night, are filled with children going to school, learning to ride bikes, laughing.  Recycling is like an Olympic sport and a point of pride.  Most of the locals seem happy and calm, at peace with one another and welcoming of tourists.  Comparatively, I don’t feel that in the US these days, especially our cities.  You know what I’m talking about.  There is friction everywhere; socially, economically, politically with a flagging sense of hope.  If quality of life is important, we would be wise to follow the lead of our brothers and sisters across the pond.  They certainly have what we desperately need; peace and prosperity for all.

Happy Summer!

Sam Jones


Banish Your Lizard Brain Part II

May 12, 2023

My apologies for posting this monthly report late. I wanted to get a better feel for earnings and hear what the Federal Reserve had to say last week before posting anything I would regret. There are a lot more positive developments in the markets than what we all feel and hear in the way of forecasts and consensus views on the future.

So Much Pessimism

I think regularly readers might have come to understand that I am most comfortable making recommendations and forecasts (please don’t make me) when I am in the minority of popular opinion.

Without boring you with stats and evidence, these are the very strong and broad views in the financial world today:

Stocks are still in a bear market, and they will finish lower on the year, perhaps by a lot.
Less than 20% of all investors expect a positive year in 2023.
Surveys show nearly 100% expectations for a recession to begin in late 2023 or early 2024.
Real Estate will remain in a deep freeze due to high mortgage rates.
The Fed is going to drop rates by either 3 or 4 times before the end of 2023.
The debt ceiling issue is likely to lead to a US Treasury default for the first time in history creating calamity in the market, a debasement of the US dollar and widespread panic.
We will see more and more bank failures and eventually regional banks may cease to exist.
Commercial real estate is going to drag down the entire banking system and leave our cities a ghost town.

So….. hmmmm

That is a tremendous amount of negativity. Our lizard brain (Amygdala) responsible for fight or flight responses is swollen, red and angry. And for good reason! There is plenty of compelling evidence suggesting these outcomes are possible, probable, even likely.

But meanwhile, today, what is happening in the markets, earnings and the economy is simply not telling the same story. This is what is happening, whether we want to believe it or not.

The US stock market just put together two of the best quarters in recent history (+7.04% and +7.42%). This does not tend to happen in a bear market.

Home builders are making all time new highs – not exactly a recessionary thing.
Consumer discretionary, biotech, technology and communications services are leading the markets higher – again not a typical thing to see if we are about to go over the cliff.
Growth and speculative stocks are charging higher while defensive, value and dividend payers are lagging and negative YTD.

Interest rates not controlled by the Fed are falling steadily and quietly stable.

Consumers? Out spending with healthy incomes.

International markets? Well hopefully you’ve heard me say they are the place to be with an overweight position. We are wildly overweight internationals for the record.

Every year, there are winners and losers in the financial markets, and I can certainly find a few negative sectors and asset classes in the Bespoke Report card below (small caps, dividend payers, natural gas, China, and financials). But I also see a lot of green YTD.

www.bespokepremium.com

The Coast is Not Clear

I don’t want to set the expectation or give the impression that I am long term bullish or suggest to anyone that this a great time to load up on stocks and swing for the fences. I am simply stating the obvious and considering the realities of what is actually happening today outside of our fear and emotional state. Specifically, there is so much negativity already baked into the markets that it’s actually going to be tough for any of the End-of-Days, Great Unwinding, Forth Turning, crowd to be vindicated, at least not now. This may be just a timing thing. It would make a great deal of sense for the markets to do what the fewest number of participants expect and that is to push all the way up to the old highs and suck in a lot more money before actually failing. Remember the S&P 500 is still nearly 14% below the peak set in early 2022 and many more individual names are still trading 50-60% below their highs.

In the short term, price patterns in many sectors and indices, both domestic and international, look very constructive toward higher prices. It simply is what it is. Our equity strategies remain 100% invested because there are plenty of investments in uptrends and we want to capitalize on opportunities as they present themselves. If prices roll over, or start to show a change of trend, we can become much more defensive. But for now….

Recession Still Looms

The Federal Reserve increased interest rates again last week and will now pause with any policy changes in the foreseeable future. A moment of your time for a brief history lesson.

My database only goes back to 1989 but let’s look at the pattern of rate hike cycles since then.
We have seen four substantial rate hiking cycles beginning in 1989. Each of them varied from a minimum of nine rate hikes to as many as seventeen. In 2006, the hiking cycle didn’t end until rates were pushed up to 6.25%. In the year 2000, the same happened. Rate hikes did not end until we hit 6%. As of this week the Fed Funds rate is 5%. Is that enough to kill inflation in keeping with the history of the Fed? Maybe. But more to the point, after each of the last four rate hike cycles, the Federal Reserve has paused, made no changes to rates, for the following time periods (shown as market days, not calendar days)

Summary statement: We should be prepared for the Fed to “pause” for the next 7.25 months (218 calendar days/ 150 market days) because that is their shortest “pause” in modern history.

7 months is a long time. During these “pause” periods it the past, we didn’t exactly see prices run away higher with huge gains but neither did we see a lot of price damage. It wasn’t really until the Fed started to drop rates (2024?), that the aggregate US stock market ran into trouble. So again, our expectation remains for a recession, and we do expect stocks to pay the price when it happens.

Technology Revaluation is Still a Problem for The Markets

Simply put, the US stock market is going to follow the path of large cap technology because technology represents over 40% of the US stock market (if we include communications services companies like Meta and Google). No mystery here. Technology is up, so the US stock market is up. When technology fails, the US stock market fails. Let’s not make this complicated.

If we back out a bit and look at the big picture, the US stock market is still in a phase of revaluation, especially in the large cap technology world. Crescat Capital offered this chart again in April. It’s pretty self-explanatory. The revaluation process for mega caps relative to current GDP is a lumpy and bumpy affair. Today, it appears that these companies are back, leading, charging, bullet proof. But history would argue that large cap technology will ultimately become a smaller part of the market and the economy. Large cap technology stocks are very likely experiencing a rebound rally within a longer term downtrend. It’s still going to be a good idea to sell into this rally in my opinion especially if you still have a high concentration of your portfolio here.

The Debt Ceiling Thing is Real

Looking ahead by only 30 days, the Debt Ceiling debate also has the capacity to be highly disruptive. We clearly have a bipolar congress with a heavy dose of crazy in the House that seems very willing to push us over the edge in June just to flex and be in the spotlight. Default on Treasuries is a net zero probability this time. They will expand the debt ceiling, make no mistake as they have for the last 100 years without fail, but the markets may not like the uncertainty and time it takes to get there. What if congress and the white house can come to an agreement – tomorrow? Stocks would rip higher by 5% in a hot second.

Big opportunities now and themes that are still working!

I want to spend a little more time giving you some opportunistic thoughts and provide a backdrop for where we are seeing positive spending across global economies. There are many investments, sectors, countries, and asset classes moving higher now, certainly enough for us to remain 100% invested and well diversified.

Thematic investing is getting good traction. Thematic investing focuses on a style of investing or a trend that incorporates players from multiples sectors of the economy. I’ll give you a few examples. If we follow the money, we begin to see enduring positive trends, regardless of where we are in the economic cycle. Infrastructure spending is a big one that includes machinery, raw materials, water, utilities, and manufacturing. Obviously, the growing reality of crumbling and dysfunctional infrastructure after decades of neglect and deferred maintenance is forcing spending, investment, and profits in this sector. You’ll never see such political harmony, cooperation, and bipartisan behavior as when the water turns off, sewer lines break, or the room goes dark. Yes, yes let’s fix that stat, all in favor.

Speaking of infrastructure spending…

Investment in energy Transition just exceeded $1 Trillion in 2022 surpassing all investment in fossil fuels. Regardless of your politics, ignore this mega shift toward clean energy at your own financial peril.

Raw materials, especially rare earth metals that are in very high demand from energy transition technologies for batteries, storage and electrification of power are poised for a significant move higher. At this magical moment, we have the perfect investor trifecta (High Demand, High Scarcity and Low prices).

Worldwide Sectors and New Power are our primary strategies for direct thematic investing, but these ideas find their way into most of our other strategies indirectly through our investment selection process.

The Best Buy in over a decade is coming.

As you might have guessed, it seems likely now that we have more volatility ahead in the markets before we might find a more lasting and durable bottom to this bear market. These are the tough times, when we are psychologically weak, we have suffered some losses and wonder when (and if) the good times will ever return. Volatility is the price we pay for higher returns. If one wants to avoid volatility all together than necessarily, you will also avoid significant returns in the future. Today, we can focus on areas of the market with more opportunity, leadership, and relative strength. Tomorrow, in our risk managed strategies, we could find ourselves positioned much more defensively as the markets actually give way to recession. Once we see prices wash out and valuations reset to more attractive levels, perhaps in 2024, we will be faced with another one of those generational opportunities to dramatically improve the wealth and lifestyle of your family. Many will miss it. Many will not have their emotional or physical capital intact enough to add to their investments at the lows. The vast majority will wait until prices are up 100% or more before feeling like the coast is clear. Our job as your wealth manager is to take all of this off of your plate and to allocate your investments according to what is happening today, not what our lizard brain tells us should happen in the future.

Please trust that you are in good hands. We see the risks; we see the opportunities and have decades of experience allocating investor money appropriately.

My best to all.

Sam Jones

Time to Go Big with Internationals

April 6, 2023

Since 2020, we’ve been banging the drum regarding The Big Three Investment Opportunities of the decade.  Regular readers know what I’m talking about but you can read all about it HERE.  They are all three playing out nicely now giving smart investors a full plate of investment options and a clear path to asset allocation.  As we highlighted on November 9th of last year, international investments are taking flight as the 3rd of the Big Three.  The trend is now accelerating relative to the US financial markets.  This is that time to go big with your international allocations.  Let me make a case now for why investors could now consider an outsized allocation to internationals as a longer-term core holding.  Please note that any commentary hear is market based only focusing on opportunities and risk.  Individual investors have different objectives, risk tolerance and situations so please take this for what it is.

Non-US Valuations are Far More Attractive

There are a lot of messy charts and tables out there regarding this subject but the common summaries of all tell the same story.  International valuations, especially developing and emerging markets are below their 10- year averages but the 10-year average itself is far below the current valuation of the US stock market.  You might know that the last 10 years has been a blow-out for US securities.  However, in decades past, international investments have produced very attractive returns relative to the US.   See below from RBC Wealth Management.

Buffet and Shiller both offer their own studies surrounding these valuation differences using a similar methodology of market capitalization to current GDP (or GNP).  They go further to project forward returns on these data which have historically been pretty accurate with an 8-10 year view.  Again, the story is the same; Internationals are very inexpensive, absolutely and relatively speaking.  Buffett’s analysis below is broken down by country.  If we look at the projected returns below, we see a few important things.  First, the US markets are not projected to earn more than 2% possibly for the rest of the decade using 1/2022 as the start date.  So far, we’re down -14% from that date through yesterday.  Meanwhile, outside the US, we see projected returns at the top of the list closer to 10% and well above in select cases.  Am I going to rush into Russia, Pakistan or Egypt with client money?  Of course not.

But Brazil, Indonesia, Mexico and China are certainly in the hunt.  In the developed markets, we also see consistency of high projected returns in most of Europe as well as Australia, Singapore and Canada.   Note- You’re going to see many of the same countries mentioned below as we move through the analysis.

With a Little Help from My Friends at Chat GPT

Wow, let me say quickly how powerful, awesome and terrifying it is to use Chat GPT.  This is not a search tool; it is an analytical tool that is going to make research infinitely faster for those who are looking for more than just information.  I used my tiny brain to ask Chat these questions in hopes of identifying which countries in the world are best positioned to benefit and sustain from obvious secular challenges.  You’ll see a common thread in the line of questions.

Q:  Which countries have the highest adoption rates of renewable energy?

I am only listing those with over 95% renewables or likely reaching 95% in the next 3-5 years.  Hydro power is considered a renewable energy source here.  Countries that have already shifted to non-fossil fuel-based energy sources are far in the lead.  They are less prone to price swings in oil and gas, less prone to social impacts of petro dictators (Russia, Iraq, Saudi Arabia), and will have better control over their primary input costs from this day forward.

Iceland

Norway, Sweden and Denmark

Uruguay

Germany

Costa Rica

  1. Which countries have the highest output of agricultural products?

Food sourcing is increasingly becoming a thing in the global stage.  Those who can produce food for themselves, and the world will continue to have the most influence in geopolitics, costs to consumers and the allocation of favorable trade terms.  The top 6 listed in order.

Russia (sadly)

Brazil

Canada

Australia

Argentina

USA

  1. Which countries have the highest known deposits of rare earth metals?

Rare earth metals are critically important in almost all technology, especially energy storage, batteries and electrification of the transportation.  If we are to continue on our current path, rare earth metals will again be one of those important differentiators between countries and who holds the power to the future.  The worlds largest deposits of rare earth metals are found here.

China

Brazil

Australia

  1. Which countries are positioned to be least impacted by a protracted period of inflation and why?

This was a tough one for Chat because there are so many variables going into the comparisons.  Preference was given to countries with:

  • High levels of diversified exports
  • High levels of domestic production of goods and services
  • High consumption levels and growing middle class
  • Strong monetary and fiscal controls through central banks
  • High levels of commodity resources

…and the winners are:

Brazil

Canada

Australia

China

Germany

My line of questioning started with some assumptions about the future.  These are that climate change, resource scarcity, a new and protracted period of nationalism (anti-globalization) and inflation are all going to have profound impacts on the welfare of different countries depending on what each brings to the table.  We see from the output that a certain group of countries are all positioned well while many countries didn’t make the list and could be at greater risk.

Here’s the short list:

Brazil and Latin America, Australia, Canada, parts of Europe and Asia (including China).  

What About Timing?

I’m glad you asked.  The time is now.  Internationals started outperforming the US markets last fall in November.  We saw a bit of a pause in February but now the outperformance continues again and will likely for the foreseeable future.   These changes in leadership between internationals and domestic markets tend to be notable, protracted and consistent once established.  Take a look at this relative strength chart and note the change in trend in the bottom right corner.  This is that time!

What does this mean for investment allocations?

          Well for one, we need to catch this train because it is leaving the station and the longer we wait to get on board the greater the risk of an accident.  Most asset allocation models with a 60% stock/ 40% bond mandate, might have 20% of equity exposure committed to internationals.  Our own Wealth Beacon Conservative model has almost 30% as a slight overweighting.  But our dynamic asset allocation strategies are more at liberty to take a bigger stake, as they have with over 50% of current equities invested, in internationals.   I’m wondering out loud if this is enough considering the very wide differences in valuations, projected returns and the Chat factors listed above?

For our clients, rest assured that we are following the opportunities and trends as they present themselves.  For those in the DIY camp, this is a great time and place to make some long-term investments (not trades) by increasing your international exposure now.

Timely updates and little education – requested and delivered in this Red Sky Report.

Best to all

Sam Jones


Back on the Road to Recession and Related Advice

The markets in March were like watching Russell Crow in Gladiator sarcastically asking the bloodthirsty crowd if they wanted MORE death and despair.  It seems the entire world loves a good financial train wreck and just can’t get enough.  March was quite a month.  It shook the foundation of financial stability and investor confidence.  It was a month of capitulation for investors who finally threw in the towel and gave up on stocks, fearing a repeat of 2008 … or worse.  It was entertaining but not in a good way.

For this update, I’m going to comment on my own commentary from last month.  For the record, it’s bad form to quote yourself but I’m going to do it anyway because the format fits what needs to be said now about markets and economy. I’ll also dive into some anecdotal observations about remote work and implications for rural America.  If you care to wade through it all, you’ll find solid context for some actionable reminders and ideas for personal financial decision making.

Quotes and follow up commentary from Feb 27th Red Sky Report:

The Federal Reserve chatter box and a few marginally inflationary economic reports, forced the financial markets on a detour from our path toward recession. 

We are now back on the road and possibly in Recession already.  Bonds are up, stocks and commodities are down.  This is what happens to financial markets when the economy is going into recession.  Don’t make this harder than it is.

“They (The Federal Reserve) will raise rates until they break something and that something is the US economy.”

Well, I guess it has started.   The Federal Reserve is largely responsible for two of the largest bank failures in history representing assets over $300 Billion.  Silicon Valley Bank failed on March 10th and Signature Bank followed on March 12th.  Credit Suisse also failed blaming weakness in the US banking system and was sold to competitor UBS.  There are likely more to come if we use history as our guide.  I was amazed to see how many small regional banks have failed in the last 23 years. This is not an uncommon event if you look at the 48 PAGES of listed bank failures since 2000 on the FDIC site (https://www.fdic.gov/resources/resolutions/bank-failures/failed-bank-list/ ).   But again, it seems that every failure now invokes bigger and louder crowd reactions than the past.  Glass is breaking.  Heads have turned, eyes are wide.  As sick as it sounds, bank failures are actually helping the Fed bring the US economy to a complete standstill.  Banks failures have the effect of quickly tightening financial conditions both in lending and capital reserve trends.  All of this will put continued downward pressure on real estate, increase unemployment and eventually drive rents lower.  This is what the Fed wants/ needs to happen.

Recessionary evidence is almost overwhelming now.  Nationwide real estate prices are now down for the 7th consecutive month in a row and threatening to turn negative year over year even as a lagging data set.  Leading economic indicators are down 6% in aggregate year over year.  According to Bespoke, since 1960, this has never happened without the US economy being in recession or within 6 months of recession.  Every broad measure of inflation, yes, every one of them including CPI, Core CPI, PPI, Import prices and so forth are now sharply lower and approaching the same levels as the spring of 2021.  Wages remain high but have flattened and layoffs are accelerating to a point where we should start to see higher unemployment numbers, especially among high paying private sector jobs.  We are very likely in recession already, but the headline is still forthcoming.

“Bonds can do OK but won’t really get much traction until recession realities become more dominant.”

And just like that, bonds are back- now that recession realities are “more dominant”.  They say that the bond market represents the smart money, and the smart money is suggesting that the Fed is going to cut rates to 3.6% by this time next year!  Seems ambitious but they do tend to get it right historically speaking.  The good news is that we now have our old friend, the bond market, behaving as it normally does and acting as a much-needed safety net to stock volatility.  Since the 9th of March, we have reinvested in short term Treasury bonds and investment grade corporate bonds in our diversified strategies, and it does feel very good to know that bonds are finally offering investors some true diversification to owning stocks.  Captain, engine number one is fixed and ready for duty!

“Commodities are going to chop lower as the economy gets weaker and weaker in the months ahead.”

Indeed, commodities in aggregate, led by the energy sector, really gave up in the second half of March.  This is all very consistent with economic cycles and trends as the US economy gets weaker and moves into recession.  Gold is often described as a hedge against inflation.  That’s not actually true.  Gold and gold miners are a hedge against a falling US dollar which typically occurs in the early stages of a recession, like right now.  In other words, we want to own gold when the US dollar is falling.  You can see how the two are almost perfect mirrors of each other below.  We have reinvested in gold and gold miners across several strategies this month as the US dollar continues to fall from its highs in September of 2022.


As a related side note, the crypto currency crowd would have you believe that digital currencies are also a hedge against a falling dollar and inflation.  Again, this is also not true.  Crypto has no correlation to the US dollar at all. Crypto is simply a hedge against chaos, anarchy and serves as a badge of honor for libertarians.  Witness the fact that crypto and bitcoin were up over 40% during the few days of bank failure headlines.  Banks were up 3% on Monday, Bitcoin was down 5%.  Chaos and financial instability are good business for crypto it seems.  I would not bet against the US financial system, nor our central banks’ willingness to spray unlimited cash to support it for better or for worse.  Ironically, as we know now, 30% of the bank deposits of Signature Bank came from…. The crypto industry!  Shady bank with shady customers.  Signature Bank was closed by regulators and taken under control of the FDIC on March 13th.   Chicken or the egg; we reap what we sow, etc.

Ok, let’s move on to other non-market trends

Current Trends in Remote Work

This is a fascinating evolutionary topic.  Remote work certainly has it’s benefits in terms of efficiency, costs savings for office space, reducing traffic and commuter times, improved work life balance.  But perhaps the most profound impact of the new remote work option is the fact that small, rural towns across the country have blown up in growth of new residents who have made permanent changes in their home environments given their new-found freedom to work outside of a company office.  If you can work anywhere, why not work in a desirable location outside the city!  Steamboat Springs, CO where I live is a classic example.  Our town has been smashed with new residents, young families, folks from all over the country who have pretty healthy compensation and are allowed to work remotely – for now.  I can barely afford to live here anymore as the prices for everything has shot up 30-50% in just the last couple years as our new residents seem willing to pay any price.  I suspect we are not alone.  Affordability of living in these small towns has dropped to a place and time where long time locals are being forced to leave.

Meanwhile, I’m now hearing stories of layoffs, especially among those remote workers who had high paying technology jobs in Texas, Chicago, and California.  $250,000 salaries for remote workers are disappearing quickly and these folks are suddenly looking for local jobs paying $17-$20/hr. in service jobs or labor work.  There is a substantial gap between their new life expenses and their new incomes.  They won’t make it.  This is starting to feel a bit like the gold rush era or the oil drilling towns of Virginia.  When the work leaves, the town dries up.

At the same time, I also see a loud and serious call for workers to return to an office, eliminating the remote work option all together.  Most companies are watching the productivity of their remote work force in serious decline.  I have read commentary speaking to the value of in person meetings as related to creativity, work culture, and accountability.  Young unmarried employees generally want to be in an office to meet other people and have some form of social life.  Fun fact, 1 in 3 marriages originated with a workplace introduction.  Now, nearly 40% of all fortune 500 companies have eliminated 100% remote work options and that number is growing.

As we head into recession, reducing head count is a natural event.  Companies are literally using the back to work mandate as an easy way to have employees voluntarily leave.  Subjectively speaking, it’s going to be rough for a lot of people who have really built a new life around remote working.

As such, I will make three forecasts:

  1. Many laid off remote workers will try to start new businesses in order to stay remote.
  2. We’re going to see unemployment rise somewhat dramatically as many choose to remain unemployed rather than be called back to the office. Now that the huge pile of COVID household savings has been largely depleted, I wonder how long they can hold their breath.
  3. Employers will develop different pay scales for office workers and remote workers. Remote workers will make less than office workers for the same job.  The gap will be substantial.

Action Items and Insights

Ok let’s get down to some actionable ideas and insights considering all of the above.  First let’s talk about your psychology at this important moment in economic history because behavioral economics is really all that matters in the end.

This is how you feel today:

We feel exhausted.  Bear markets are exhausting.

We feel financially vulnerable and risk averse especially if one has experienced a job loss, or some severe pain in the financial markets in recent history.

We feel like the pain will never end and we are just beginning a long period of deteriorating financial conditions – yes, I can see you nodding your head.

We wonder what on earth will make things better again.  What could possibly go right enough to fix (fill in the blank).

We want to quit, to get off the ride because the ride causes pain.  Humans want to avoid pain, always.

This is how we feel as we observe the state of the financial markets as they forecast what seems like an inevitable recession ahead.

Successful investors are able to feel these emotions and yet recognize these emotions for what they represent, which is developing opportunity.  We need to remember that very strong feelings of fear are a necessary part of every bear market low (as are bank failures for that matter).

The greatest return opportunities come when prices are low (check), pessimism and fear are high (check), the economy is in recession (check) and the Fed reverses monetary policy (pending).  This is THAT time to get your head in the right place and think opportunistically.

Be the MVP in your company

Recessions and unemployment go hand in hand.  If you are a young person, working for any company, wake up every day and say to yourself “I am going to be the most valuable employee in our firm”.  This is a game of survival, and you want to stay employed with your income intact through a recession.  Income gives you options to invest at lows.  Income gives your freedom to maintain your standard of living regardless of the value of your investment portfolio.  If your company says you need to return to work, pack your bags.

Retirees pay attention to your cash

Please reread last month’s update “All you wanted to know about cash” for ideas.  I still see way too much cash sitting in non-interest-bearing checking and savings accounts.  On Thursday, I am meeting with a US Bank representative to discuss their high yielding savings account options for our personal savings accounts.  I expect to get at least 4% or I will gladly move to a bank that offers that rate on cash.

Another opportunity to reduce your exposure to mega cap tech as needed

As I look through investor portfolios outside of our management, I continue to see shocking exposure to a few mega cap tech names – Microsoft, Apple, Amazon, Google, Nvidia.  Facebook (Meta) has disappeared as most apparently sold after the stock fell 75%.  In the last 2 months, these stocks and many brand names in technology, have seen some enormous moves higher.   But the trends are still down, earnings are still weak relative to price and growth and is not the place to be as we head into recession.  If you have an outsized position in the FAANG names or any other tech company for that matter, you now have another opportunity to consider reducing some of your position size.  This should be done with consideration of taxes, your objective and your total portfolio asset allocation in mind.  Please feel free to reach out to us if you need some consult.

Be Less Flashy

I just reread Morgan Housal’s book “The Psychology of Investing”.  It’s good and I don’t say that lightly because I have read everything and most of it is junk. One of his points that is worth mentioning here and now is that no one is as impressed with your consumption as you are.  I don’t care what kind of car you drive.  I am not impressed with flashy shows of wealth.  I am inspired by people who have built lives of financial freedom, who have time and the means to do whatever they want, whenever they want.  Morgan says that the purpose of wealth is to provide options and freedom of choice.  As the world becomes more and more expensive with persistently higher inflation over the next decade, it’s going to be harder and harder to maintain that veneer of wealth.  Someone will always push your spending up to them, to compete with their consumption, to join the club (literally).  I have no issues spending money on things that are important but do have a hard talk with yourself about what is actually important in your life.  You will not remember your “stuff” on your death bed.  Meaningful relationships and lifetime experiences are all that really matter in the end.   Spend accordingly.

I hope to see signs of Spring soon because I am climbing the walls (6-foot walls of snow).

My best to all.

Sam Jones


Everything You Wanted to Know About Cash

February 27, 2023

It’s that time again.  Time to discuss cash and how it fits into your financial life.  Cash is becoming the new sheriff on Wall Street as it hovers at that magical 5% level now available in money market funds and short-term T-Bills.  How should we think about cash, right here and right now, in light of other opportunities and our trajectory towards recession.  Everything you’ve been asking yourself right here and right now, right?

Detour!

Let me take a few minutes to talk about the market action in the last month before we dive into the cash discussion.  I should have seen it coming.  No trend occurs in a straight line.  Nearly to the day following my last update, the Federal Reserve chatter box and a few marginally inflationary economic reports forced the financial markets on a detour from our path toward recession.  The February detour has been a little painful frankly, more so than indicated by the major averages.  The US dollar moved almost vertically higher for the month beating up our international exposure and anything in the currency hedge world including our gold positions.  Meanwhile, bonds of all sorts, fell out of bed and are now crying on the floor as the notion of “no recession/ no landing” seems to have entered the psychology (I am laughing out loud right now… and crying on the floor).  Speculative stocks with no earnings, super high valuations, disastrous balance sheets and no worthwhile business models, also took the beatings they deserved.  The broad US stock market indices also gave back a chunk of what was made in January BUT, the uptrend that began in October of 2022 is still intact.  In fact, from a technical perspective, most indices broke into new uptrends in January and have simply pulled back to a nearly perfect, textbook new entry point if this level holds.  This appears to be a healthy short-term pullback within an uptrend – my favorite!  Obviously, the next two weeks will be very important for the state of our “relief rally”.

So, February has been a detour.  The road ahead seems pretty clear to me.  The US is still headed toward recession but as we’ve just seen, it’s never a straight path.   Let me explain the situation using a highway analogy.

We (the economy, GDP, spending) were on the highway travelling at 100 miles an hour from 2020-2021.  Then our engine got a little hot (inflation) and we needed to slow down a bit.  In 2022, we slowed from 100 to 60/mph.  Now, in 2023, we look out the window and relative to 100 MPH, it feels like we could get out and walk, but we’re still going 60 miles an hour!  Smoke is still coming from the hood; our check engine light is still on.  We need to slow down more but we’re still movin’ pretty fast right (says the Fed)?  The Fed is committed to having our vehicle stop in a complete parked position.  They have said as much many times.  They will raise rates until they break something and that something is the US economy.  You see, they know, and we know that inflation will remain a problem until demand falls dramatically and the only way to crush demand is to put our economy into a recession.  Failure to put the economy into recession quickly will lead to a more entrenched and longer war with inflation and eventually lead to catchy 2024 campaign slogans like that of Dwight D. Eisenhower in the early 50’s.

The Fed simply cannot engineer a soft landing because inflation will just flare again.

Remember, we are following the 70’s playbook again.  Inflation AND recession will dominate the environment. 12 months ago, I wrote about Stagflation (stagnant economy with inflation).  That’s where we are, I have no doubt.  So, the road to recession, with persistent inflation should mean SELECTIVELY higher stock prices until the Fed finally buckles and considers dropping rates which might not be until 2024 at this point.  More on this in a minute.  Bonds can do OK but won’t really get much traction until recession realities become more dominant.  Commodities are going to chop lower as the economy gets weaker and weaker in the months ahead but could do ok in light of inflation.   That’s just how it happens, once we get back on the road and off this detour 😊.  My advice don’t take the detour.  Stick to the road with your portfolio allocations.

Cash and an Investment Choice

Ok here we go.  Today we find ourselves in that always intriguing moment for those who like the idea of stable, risk free 5% returns on their money.  I will say with confidence that the vast majority of investors, especially those on fixed incomes, retired, or highly risk averse investors might find cash (money markets and T-Bills specifically) very attractive now.  After all, if we’re heading toward recession and stocks are all over the place, why not just sit back, collect interest and wait it out?  Let’s talk through that emotion.

First, I hear you.  There is a case to be made for carrying higher cash for a portion of your portfolio now that’s it’s earning a higher yield.  The best bonds out there in terms of yield are bonds with maturities inside 1 year.  Longer term bonds have higher price risk and lower yields making them relatively unattractive.   Meanwhile, money market funds are paying 4.12% annually!  I can certainly make a case that assets sitting in cash earning at least 4% are just as good or better than your best Treasury bond paying the same rate but with price and maturity risk.  In other words, I’d rather sit in fully liquid cash than Treasury bonds or even T-bills of any sort and our portfolios reflect that choice.  Clients might recognize that we have exited our few remaining Treasury bond positions bought last October and have a higher “cash” position where we are now earning reasonable interest every day.

Cash in the Bank

You can also do a little searching and find banks paying slightly north of 4% in “high yield savings” with no fees and no minimums.  We haven’t seen this since 2007.  But here’s the problem.  Bank money is not ready to invest.  It must be moved into a brokerage environment where you can make a different investment if and when you choose to do so.  In my experience, money that lands in a bank, tends to stay in a bank even while stocks might be ripping higher for months and years on end.  There is a certain amount of energy, conviction and definitive action that is required for one to move money between institutions.  That conviction is rare and money in savings tends to sit there for a long, long time.  Again, sitting and earning 4% is not terrible but let’s consider some comparative realities.

Cash Does Not Earn More Than Inflation

If you think about how interest rates on cash are derived, it comes from the Federal Funds rate, controlled by the Federal Reserve.  And the Fed Funds rate is dictated by perceived inflation.  Their job is to match the Fed Funds rate with their perceptions of the real rate of inflation.  Ergo, yields on cash will naturally tend to match changes on the real cost of living.  To some, that’s a great hedge against inflation.  To me, I look at that prospect as a game that can’t be won.  If you had 100% of your liquid wealth in cash, you would never have an opportunity to increase your wealth in real terms, or net of inflation.  Now, if you have all the money you need to cover your living expenses to your last day of life and die with 0.0 dollars, then you’re all set!  But some people want to leave some of their wealth to family or charities.  Some don’t want to risk running out of money before they die.  Some might not feel so confident in their assumptions about anticipated costs of living down the road.  Some might live a lot longer than they think.  Some might know after many years on this planet that inflation is grossly understated in our country and cash will only track stated inflation rates (which excludes “volatile” housing, energy, food and nearly anything you actually need to spend money on).  You get the point.  It’s not quite that simple and there are a lot of unknowns and risks associated with a 100% cash position.

Cash Versus Stocks

As I said in the prolog, we have moved to an intriguing moment in time.  Take a look at this chart from Bespoke (www.Bespokepremium.com).

What you see is that the yield (or interest) on a T-bill (or cash) has approached the estimated earnings yield on the S&P 500.  The earnings yield is the inverse of the Price to Earnings ratio.  Said another way, Cash is just about as attractive as the prospects of owning the S&P 500 considering estimated future earnings of the underlying stocks. Hmmmm, why would we want to own stocks?  Well, here’s where we need to be very careful with our investments and allocations outside of cash.  First let me state a few realities.

  1. There are many many stocks that are trading at historically low valuations where this comparison wouldn’t be the same.  These are the deep value names and themes we’ve discussed, and I can’t say enough or with enough conviction that investors should stick with value and avoid any type of security that is overvalued or has an “earnings yield” below 5%.    We have populated our stock portfolios with value plays, first and last.
  2. In a stagflationary environment, we can still own stocks of companies who offer “must have” products or services and therefore have pricing power. Companies like Microsoft and Apple will do fine because they can charge whatever they want, and we’ll still use them.  Grocery and restaurant?  Yes, we’ll pay for both.  Energy? Yes, at any price, Healthcare and Utilities of course.  Consumer discretionary is…. Discretionary and has almost no pricing power (avoid).  Financials, banks and brokerage can all do well as higher interest rates can be good for business.  What you see is a lot of sectors that will continue to push higher in this environment, but we must be selective about what we own with each.  Stock pickers have a great chance of making solid returns here.
  3. The market in aggregate is trading at a significant discount to the highs of late 2021. I personally don’t believe the discount is enough to call this a screaming buy, but a discount is a discount.
  4. The markets do tend to rise and have a positive return bias over time. That is simply fact when looking at any time period beyond 3-4 years.  Owning a low-cost S&P 500 index ETF for the last 10 years would have generated almost 10% annualized returns including three bear market losses since 2018!  If we are highly risk tolerant and can get ourselves to buy the big dips, the returns are there.
  5. There are also a lot of options beyond owning common stocks found in the S&P 500. We can own REITS, high yield corporate bonds, preferred securities, convertible securities, dividend paying stocks, and internationals, all of which are generating returns or have yields higher than inflation and cash.

I believe in my heart that a well-constructed and selective portfolio of securities with a value and income bias, will outperform both inflation and cash from here.  Cash might feel good now as a safe haven and a means to avoid potential risk of loss in stocks.  But as Keith Fitz-Gerald of KFG Research said in an interview I heard this week,

Missing opportunities is always more expensive than trying to avoid risks you can’t control.

Cash Versus Real Estate

Here’s the situation with real estate that everyone knows.  Most homeowners today purchased their properties when rates and affordability were far more attractive (pre – 2020).  The last great moment to buy real estate was in 2010 with the option to refi your mortgage rate to below 3% somewhere around 2019.  Cheap real estate prices in 2010 and historically low borrowing rates have both been a huge boon to household wealth at least on paper.   Gains since 2010 have been ridiculous and unsustainable, especially since 2020. Here’s a picture of current pricing again from our friends at Bespoke.

Affordability by any metric is really just the inverse of this chart if you can imagine that.  Now, the market is frozen as buyers and sellers are at a standoff.  Sellers won’t sell and give up their sweet mortgage rate and buyers can’t afford to buy at todays prices, unless they are paying cash or are economically insensitive.   So, sales are falling off a cliff.  This also from Bespoke.

The ONLY way for this situation to reconcile is for prices to fall to a point where affordability becomes more reasonable.  Rates can even fall from here, but it is unlikely to affect sales really until prices come back to earth.  Today it takes 80 hours of monthly earnings on average to cover the mortgage on a house for today’s median prices.  That’s a level not seen since the late 70’s.

Back to the Discussion on Cash

Should you use cash to buy real estate?  Well, now that cash is earning 4-5%, we must have remarkably high conviction that real estate prices are going to go up at least 5%/ year for the foreseeable future.  I don’t see that happening any time before 2026.  We also have to consider carrying costs with real estate.  In May, property owners will be shocked to see their new tax bills associated with the newly assessed values in their properties.  Expect to see 25-30% increases in your property taxes conservatively.  Utilities are up 11% year over year and maintenance costs are up about 10% year over year.  Homeowners insurance is up 7% year over year.  It’s getting expensive to carry a home to be quite frank.  So, all told, using cash earning 5% to buy an expensive piece of property that is likely to depreciate in value and is already seeing strongly rising carrying costs makes zero sense to me.  Every situation is different and real estate is one of those emotional things so I’m sure I’ll get blasted for saying this, but these are the facts today as I see them.  What a wonderful time to rent!

I’ll leave it at that.  Please feel free to reach out to us to discuss your individual situation or any decisions you might be considering.  We want to be your first call when you need help!

Spring is coming!

Sincerely,

Sam Jones


What’s Working in 2023


January 23, 2023

As we said in our Year Ahead update in early January, “We might stay open to some dramatic reversals in 2023”.  Indeed, investors are witnessing a start to the year that doesn’t fit the consensus view of what should be happening.  In short, the markets have been trending up so far in 2023 despite extreme investor pessimism, negative consumer sentiment, dramatic calls for a deep recession, and disastrous earnings warnings.  This update will focus on what’s working so far in 2023, separating lasting opportunities from those that could be more fleeting.

Solution Series – Tax Strategy for 2023 and Beyond 

First a big thanks to Will Brennan, our Lead Advisor and Certified Financial Planner, for conducting our first Solution Series of the year.  It was a well-attended Webcast.  Who knew we could be captivated by all the changes in the tax code for a full hour?  Will did an excellent job highlighting planning opportunities within the new Secure Act 2.0 tax law, many of which go into effect immediately and many more in 2024.  Paying attention to tax saving opportunities can offer you an extremely high return on your time investment.  You can find the video of the whole session here .

YTD Scorecard – Bespoke

Let’s start with this big easy score card provided by Bespoke.  This is something that I look at every week just to get a feel for what’s happening across sectors, style box investing, global markets, and different asset classes. It’s a good exercise that I would recommend to any who care to know what’s happening in the world of finance.

Let’s dive in to see What’s Working!

Internationals > Domestic

Looking at the top right-hand corner of the score card, we see internationals absolutely crushing our domestic markets YTD with special emphasis on China (+12%), Emerging Markets (+10%), Europe (+8-10%), Australia (+9%) and Mexico (+15%) leading the charge.  As regular readers know, we began accumulating positions in internationals in late October of 2022 and brought them to overweight in early December.  In October at our annual meeting, we called out the special opportunity here on the basis of historically cheap valuations, a top in interest and lending rates and a top in the US dollar.  This is the perfect trifecta environment for internationals.  I would add that the clock is ticking on Russia’s invasion of the Ukraine as allied NATO forces add more military and economic pressure to end Putin’s war.  European equities are already beginning to price in the end of the war.  Oil and Gas prices are now BELOW the prewar levels.  This trend has legs for the foreseeable future, but buyers should patiently wait for pullbacks to buy the dips among these new bull markets.  We have special preference for high dividend paying internationals, many of which are paying 4-6% annual yields.  Leadership among internationals has also been one of our Big Three Investment themes since 2020.  However, this trend didn’t really establish itself until late 2022 so we were admittedly early.  Now it is game on.

Note on International Bonds – I would have to extend my enthusiasm for internationals to their bond markets as well, especially emerging market bonds which have a current yield of 6.52%, almost twice that of a 10-year US treasury Bond.  Yes, these bonds have stated lower credit quality around BBB compared to the US AA+ but, but, but… you have to understand that the rating agencies have a strong US home bias.  In the US, our Debt is 135% of our GDP!  If we didn’t have a very active printing press, our credit rating would probably be closer to any 3rd world country.  For as long as EM bonds are trending up at twice the rate of the S&P 500 and kicking out 6.5% in yield, paid monthly, we’re going to own them.   We own these ETFs and funds in our investment strategies:  EMB, EMLC, PCY, and PEBIX.

Value > Growth

Also in our Big Three themes is the dominance of the Value over Growth.  Thus far in 2023, the theme continues and has not reversed.  Looking at the score card above again, we see the following results YTD through 1/20/23:

Size Value Growth
Small Caps +7.25% +4.40%
Mid-Caps +6.98% +3.78%
Large Caps +4.10% +2.94%


As discussed last year, these style themes tend to last 3-4 years.  From the chart below from Fama and French, we see that we’re about two years into the trend favoring Value with potentially another 2-3 years to go if history repeats.

With that said, the most pronounced period of outperformance for value is probably behind us and we would expect to see periods like 2023 where there are only slight differences between the two style groups.  If we look under the hood of Value on a YTD performance basis, we see that companies described as “shallow value” are actually underperforming the market, while “deep value” is far outperforming everything.  Shallow value represents companies that are only slightly cheaper than the market but still have positive cash flows, healthy balance sheets, steady revenues, and above average dividend payments.  2022 was a good year for these but 2023, not so much.  We are actively reducing our exposure to “shallow value” ETFs.  “Deep Value” are the bottom 20% of all stocks based on current valuations.  These might seem like value traps to many, but this is where the opportunity lies.  To own these, we really need to get into stock picking and sift through the value universe for the most discounted and oversold names out there, trading in single digit forward P/Es.  Sadly, there are not many index type products outside of specialty “Value” mutual funds that focus on Deep or Pure Value – I’m still looking but haven’t found much.  Note – Our Worldwide Sectors strategy is in a magical place as it can be heavily invested in Internationals and own deep value individual stocks through sector exposure.   I expect good things from this strategy in 2023 as the performance YTD confirms.

While the Growth style is still out of favor and should be held at minimum exposure, there are some opportunities developing in 2023.  This is the first reversal of 2022 patterns.  Again, we really need to sift through the wreckage here to find growth names with longer term potential.  I won’t name names here to protect our work, but I will offer this advice; Investors should focus on 1-year operating cash flow and Price to Earnings Growth ratio (PEG) as good variables to watch for opportunities in the growth world.  Negative operating cash flow?  No thanks!  PEG ratio over 1, no thanks!  As the fire sale in growth is extinguished, we are finding some diamonds among the ashes.  Stayed tuned for more on this.  Current clients are welcome to look at their Worldwide Sectors’ account holdings where you see a few growth names recently purchased at very deep discounts.

Sectors and Cycles

Let’s shift to sector winners (and losers).  This again from Bespoke this am.

Wow, what a reversal of trends from 2022!  Communication Services was the worst performer of 2022, now it’s the best with over 80% of underlying stocks trading above the moving average trend.  On the flip side, consumer staples, utilities, and healthcare are all some of the worst performers YTD.  All three “recession” sectors are down YTD.   Broadly speaking, what we are seeing in sector moves does NOT tell a story of deep recession or a recession that isn’t already priced into the market!  Sector strength is a leading indicator, and the story so far is about a strong consumer that is fully employed and an economic cycle that is almost emerging from recession!  On Thursday, we’ll get a look at GDP, it will be positive.  On Friday, we’ll get a look at Core CPI, it will be tame and falling month over month.  In February, the Fed will raise interest rates reluctantly by .25% but it is likely to be their last.    Frankly, I’ve seen economic environments that are far worse than what I see today. Again, the hardest thing about investing is eliminating assumptions about the future and allowing pure data to show you the true path.  Too many are emotionally locked into an outcome that simply may not happen and they will miss tremendous opportunities (as always). I have zero opinions about the future, just watching the data and responding accordingly.

Bonds/ Stocks/ Commodities

Looking through the asset allocation lens we see all three food groups trending up thus far in 2023.  What a refreshing change from 2022!  Bonds are discounting a future recession and easing inflation.  Stocks continue to rise from the lows in October.  Commodities are not doing much but still slightly positive suggesting that inflation is not gone yet.  Today is a great day to hold a diversified portfolio across different asset classes and a clear opportunity for investors to rebalance their unbalanced positions.  If I had to pick an asset class with the most potential in 2023, it would have to be bonds, especially hybrid types like preferred securities, investment grade corporates, high yield corporates and emerging market bonds.  It’s not wrong to own your basic Treasury bond as well but there is just a lot more bang for your buck in the lower quality areas now.   After a rather bloody 2022, both of our bond income strategies are already having the best starts YTD since 2009; a year in which both strategies generated returns over 20% (not a forecast!).

Commodities have the least opportunity from our view with the exception of precious metals.  I do not expect energy to repeat 2022 performance in any way and it would be very surprising to see inflation beneficiaries excel in an economic environment that is somewhat recessionary. Why precious metals?  That’s a long discussion but generally Gold and Silver tend to do very well in a falling US dollar world especially as the Federal reserve ends a tightening cycle.  We bought gold and silver mining ETFs (RING and GDX) back in September and added to them in October.   Precious metal mining companies have outperformed the S&P 500 by 3:1 since October.

There are a lot of opportunities and new bull markets in development now.  What a change from 2022 when nearly everything lost double digits or worse.  We’ll take it as it comes.

Cheers!

Sam Jones


The Year Ahead


January 4, 2023

As is tradition, today’s update will look ahead to significant opportunities and new risks in the financial markets for 2023.  Happy New Year to all and thank you again for another year with our firm.  We genuinely appreciate your continued trust and confidence.

Opportunities – Dare to Imagine

Fear has become the dominant sentiment regarding public securities, markets and the economy.  It has become so pronounced that analysts’ estimates for future earnings are being adjusted down for companies that are already off their highs by 60-80%.  I cannot find a headline that doesn’t speak to recession in 2023 these days and indeed the evidence in support on that outcome is considerable.   It’s truly amazing to me how much recency bias develops when markets move in one direction for even a period of several months.  Today, there are widespread assumptions that technology stocks will continue to fall, that energy stocks will continue to rise to infinity, that the US dollar will march upward as the Federal Reserve will continue to raise interest rates.  Oh my, where do I begin?  The only crisis I see today is a failure of imagination.  Imagine if these dominant trends will either not continue, not happen or even reverse direction 180 degrees in 2023.  Imagine that!  The market has a way of punishing the greatest majority of investors possible so we might stay open to some dramatic reversals in 2023.  In fact, given the extreme consensus view of a pending mild recession, we should all remain alert to two alternative outcomes.  The first is that the widely anticipated mild recession is not mild at all but rather severe as suggested by the current bond market yield curve.  The second is that we have no recession at all.  Personally, I can make a compelling case for either.  Regardless, 2023 will offer investors significant opportunities especially for those willing and able to buy low and/or sell high and more importantly think unconventionally about how their money is allocated inside the new investing landscape.  My blanket advice to all investors for 2023; free your mind of assumptions about what will happen and imagine consensus opinion failing to produce expected outcomes.

The New Investment Landscape

Let’s set the stage a bit.  What exactly is the new landscape.  As I’ve said many times in the last two years, we have crossed into an environment where debt, inflation and tightening monetary policy by way of central banks, have and will continue to be, obstacles for many public companies and asset classes.  This didn’t just suddenly happen.  We find ourselves in this environment having travelled here for over 20 years of easy money, artificially low interest rates, financially engineered earnings and debt-based form of capitalism.  In short, money (capital) has been too plentiful and too cheap for more than two decades.  Consequently, public companies have done what we would expect them to do. They have borrowed money to buy back their own shares and issue dividends in lieu of focusing on growing earnings and revenues (aka financial engineering).  They have committed no crimes but they have artificially pumped earnings higher on a magnificent scale.  This is probably the best chart I could find from Standard & Poors illustrating the point. Aggregate Buybacks and Dividends (yellow line), have been hovering between 75% and 140% of annual operating earnings (Green line) for most of the 2000’s! In basic terms, the vast majority of operating earnings have come on the back of accounting strategies and share count manipulation.   And as you can imagine, when borrowing costs rise, share buybacks using borrowed money, ends quickly.

Cheap and plentiful money ALWAYS leads to inflation as we see today, just as we saw in the 70’s and early 80’s.  Eventually, we reap what we sow. The new environment will force companies to actually show real profits, actually have solid balance sheets, and actually pay attention to their expenses and debt levels.  Likewise, companies with negative earnings can only survive in the old environment of nearly free capital and unlimited investors’ appetites.  It’s a little disturbing to see an all-time new high in the share of US public companies with negative net earnings.  Over the next decade, this line should work its way back toward the zero line as companies (re)focus on generating real positive net earnings.

The new investor environment is therefore more selective and less rewarding for those who don’t understand how the tide has turned.  For those who get it, there are still plenty of new opportunities by simply reinvesting in companies that have the right stuff.  We have already made these changes across all managed investment strategies, starting in 2021.

Opportunities

#1 Adopt a Macro Strategy

What the heck does that mean?  In short, a “macro” approach to investments bases its holding on big picture type issues like the direction of interest rates, debt levels, central bank policies, currencies, politics and overall economic health on a global scale.  It also has the capacity to own many more types of assets outside of US bonds and stocks including things like commodities, Gold and Silver, alternatives and other non-correlated securities, real estate and even long/short hedging securities if possible.  Generally speaking, these are active strategies run by managers who have a lot of experience and understand the drivers of returns.  “All Season Financial” was founded as a macro strategy investment firm all the way back to the 70’s; The last time we had real inflation.

Looking backwards to 2022, we know with 100% clarity that nearly every investment style outside of macro strategies suffered one of the worst single years in modern history.  Energy and commodities, hedges and the US dollar, were the only investment “things” that finished positive on the year.   2023 is likely to see a broadening number of winning sectors and asset classes as we climb down the inflation ladder.  However, investors still shouldn’t expect an easy environment by any means.  Transition years like 2023 are always frustrating because investors find themselves watching the very thing they just sold, take off the upside.  We should also be aware that significant bear market BOTTOMs occur smack in the middle of labelled and acknowledged economic recessions.  Today, we have not acknowledged that we are in recession and are therefore not in the middle of anything.   At its worst, the broad US stock market was down -25% in mid-October.  Is that enough of a decline to say that the market has “priced” in a recession?  Probably not.  Historic averages tell us the AVERAGE bear market decline with a recession is 34%.  If there is no recession, then indeed the work of this bear might be done.

A final bottom in US stocks and the end to this bear market, still looms but could easily occur anytime in 2023.  Buyer beware but buyer be ready!

…back to the point

For the first time in nearly 30 years investors are learning the hard way, what true diversification actually means and why it’s important.  We are in a bear market for both bonds and stocks.  Diversifying across only these two asset classes did nothing to prevent significant losses in 2022.  Investors will need to embrace strategies that reach beyond these two icons if they hope to have a more positive outcome for the foreseeable future.  The last cycle of serious inflation in the US lasted for 14 years (1968-1982).  All Season Financial has a strong commitment to this space as 6 of our 10 in house strategies are driven by Macro factors with true, multi-asset diversification of securities.

#2 – Stick with Value

Hopefully, I made the point clear that the new environment is not fleeting.  It is a long-term structural change in how companies will approach their own survival and growth prospects considering the new cost of capital.  This is a good thing and a healthy change.  We want companies to produce profits by adding value, innovating, investing in R and D and growing organically as opposed to engineering their earnings in an unsustainable form of capitalism.  “Value”, even deep value companies are those that never left this space and thankfully, 38% of all public securities still offer tremendous value.   Our industry has made it quite easy to invest in funds that focus exclusively on value, deep value, high dividends, etc.  Value comes in many flavors as well.  Regular readers know that some of the best values in the world are outside the US markets, especially China and Emerging markets.

*Note on China.  I’ve heard many times in 2022, that China is uninvestable due to the heavy hand of the Chinese government.  Like most free Americans, I have no love for their autocratic/ communist culture or the loss of civil liberties.  However, do be aware that China has added 500 million people to their “middle class” in the last year while the US of A has lost almost as many to poverty.  Likewise, the Hang Seng now trades at 1/3 the value of the S&P 500.  Consensus opinion regarding Chinese investment opportunities could be very wrong.

These, together with most of Europe, appear to have put in long term bottoms in October after devastating bear market declines.  Now, internationals are outperforming the US markets by a wide margin, and most have entered new bull markets.  Again, if you’re stuck in a US centric bubble where stock and bond indexes are your only holdings, these new opportunities will pass you by.

#3 – Special Situations

There are a number of special situations out there in the opportunity camp, but I will highlight four of them.  High Yield corporate bonds have historically never experience two consecutive years of losses.  As I write, the High Yield bond index is closing 2022 down -11.24%.  The risks of owning HY corporate bonds as we enter a recession do not escape us but again, let’s try to use our imagination.  What if there is no recession and default rates don’t spike higher?  What if inflation continues to fall and bond yields fall back to 3%?  Wouldn’t an 8% yielding corporate bond suddenly look pretty attractive?  High yield bonds could have a very good year despite conventional thinking.

Home Builders are also in a potential sweet spot.  Demand for housing is still very high and supply is not coming from the existing homes as homeowners are essentially frozen in place carrying 2-3% mortgages.  Where will supply come from?  New homes!  Homebuilder valuations are also very attractive.  Consensus views might have you think that all forms of real estate are dead in 2023.  Think again!

A third sector with great potential is financial services, especially banks, brokerage, capital markets and asset managers. Again, value is present here and the cycle should begin to favor financials as inflation cools.  Imagine this; Bank profitability reached a 14 year high in 2022 with a return on equity of 12.5%.  Bank stocks are trading at 50% of the valuation of the S&P 500.

Finally, one area of value that looks attractive on pure fundamentals are the gold and silver miners.  Crescat Capital does some of the best research I’ve seen in this space (https://www.crescat.net/mining-industry-renaissance/).  After 7 years of deleveraging their balance sheets, gold and silver miners are sitting on the highest levels of cash in history and are now paying some of the highest dividends in the market.  Furthermore, gold and silver reserves are at historic lows while ore prices continue climbing steadily.  The timing and set up to own gold and silver miners may be one of those rare premium value plays in 2023 for a small piece of your portfolio.  Even Warren Buffet, notorious hater of Gold, would have to take a second look at the mining companies.

New Risks

When we think about potential recessions, investors tend to lean into “safe” things like consumer defensive stocks, utilities and healthcare.  While these sectors have held up better than most in the last 12 months, they are simply no longer attractive from a valuation standpoint.  Many like Walmart, McDonalds, Proctor and Gamble, Costco and Pepsi, now have P/E multiples higher than the technology sector which is still very expensive by any standard.  The same goes for the biggest names in healthcare and utilities.  It seems the market has already priced a future recession into the defensive side of the market which presents a new risk for 2023. If we do escape recession, these sectors could be some of the worst performers in 2023.  Any holdings here should be on your “watch to sell” list.

2023 is going to test your resolve as an investor.  Perhaps the greatest risk of all time for investors in the throws of a deep and lasting bear market is the risk of giving up.  I choose my words carefully.  Giving up is that moment when you can’t stand to lose another single dollar to a market that feels hopeless, literally without hope.  Why would I stay invested or buy any security with price risk when I can “get” 4% year risk free in short term bonds or an 18-month CD?  Why am I investing at all?  I want out!  That is giving up and it happens at or near the very lows of every bear market.  We saw it happen in late May and late September of 2022.  The markets finished 2022 slightly above those levels.    We’ve all been there, when it’s dark and headlines offer no optimism.  Emotionally, we need to protect our egos, so we find an excuse for selling everything.  Managing your emotions and staying engaged with your investment discipline is the most challenging risk we all face.  At the same time, it’s important to keep your money in the right place at the right time, manage your tax impact, manage your asset allocations, keep them in balance, find new opportunities and avoid obvious risks.  Above all, stay in the game and remember that the greatest risk is to have your investment assets sit idle and unproductive after experiencing a loss, while your cost of living goes up over time.  Stay strong and use 2023 as a year to find new opportunities for your investment dollars.

Best of luck to us all,

Sam Jones


Key Financial Planning Figures for 2023


Happy New Year!

This year, the turning of the calendar comes with increases to social security, tax brackets, standard deductions, annual exclusion gifting limits, contribution limits, and RMD ages that we want you to be aware of. Please  review the summary of Key Financial Planning Figures for 2023 below and reach out to us if you have any questions.

We look forward to working together in 2023!

Sam, Will, Kris & John

Real Estate – The Big Picture

December 9, 2022

          I am not an expert in Real Estate but have been a macro strategist for the better part of 25 years.  Real estate is no different than any other investment asset class despite the emotional bonds that persuade us to think otherwise.  As promised and as requested, these are my thoughts on trends in real estate, both current and future.  

Flashback to 2006 

          In October of 2006, I stood at our annual meeting at the Lakewood Country Club in front of one of our largest attended events ever.  I began the presentation with this image, snipped from the cover of the Economist entitled, “The Houses That Saved the World”.


          I went on to horrify our clients by suggesting that real estate was a disaster waiting to happen and that we could see up to 15% declines in prices nationwide over the course of the next 2-3 years.  I was terribly wrong of course as real estate lost 25% nationwide and nearly 40% in many markets, combined with the bankruptcies of several giant financial institutions and mortgage lenders.  This period was fodder for the famous movie, “The Big Short”.  On that day, no one could image that real estate could fall even 10%.  It simply had not happened in several decades and we heard regularly how inventories were low, demand was high and interest rates were at all-time lows.   Moreover, real estate had become a great source of wealth accumulation for homeowners at large, as well as an absurdly lucrative revenue stream for brokers, homebuilders, developers, house flippers, mortgage lenders, banks, etc.).  No one wanted to believe that real estate would do anything but go up in value.    

This Time is Not Different 

Today, there is a near consensus opinion that real estate prices are in trouble for the next couple years.  It’s hard to argue with that point of view considering all the things we already know.  Affordability, measured as the cost to buy a median home relative to average incomes, is at an all time low.  Mortgage rates have doubled from 3.4% to 6.8% in just 11 months.  No one wants to sell and trade their current 3% mortgage for a 7% mortgage, right?  So, sales have completely dried up and are now down over 40% year over year.  However, if one were to look at price trends, you might be surprised to see the Case Shiller National Average still up 10% year over year ending October!  I want to give a quick shout out to Bill McBride who offers some of the best work I’ve seen on macro trends with a strong focus on real estate, mortgages, and consumer behavior.  You can find him at www.calculatedrisk.com .  Much of what I’m talking about today has been said better by Bill with all the supporting data.  Check him out.  

          If we were to unpack the +10% YTD, number we would see that real estate prices WERE up over 20% YTD and are now down 10% from that high.  Bill likes to watch the month over month price trends which are obviously negative at this point (see below).  Prices peaked in March on the National index and have been falling about 1% per month since.  Industry people will suggest that the national average doesn’t apply to their markets.  Yes, it does and yes it will.  Some markets and regions are just early in the trend, and some are later, but rest assured that all ships rise and fall to varying degrees, with the tide for real estate.  


Most of the smart people I follow, including Bill are looking for prices to fall almost 20% which would simply erase just the last 18 months of price appreciation.  Not a big deal!  Especially considering that homeowners are still sitting on a pile of equity, and most aren’t feeling pressured to sell, at least not yet.

This Time Is Different! 

          Today, unlike the last real estate price decline in 2007-2010, we have a new force called inflation that is still clipping along at 7%/ yr.  Inflation is a bit like wood rot; It’s hard to see the decay that is happening beyond the surface, but it has a way of structurally eating away at your financial foundation.  With inflation running this high, even a small loss in real estate prices can have much greater impact on the “Real” value of your property.  Let me explain.  We can look at real estate prices with or without inflation factored in.  If we consider prices without inflation, then we are simply looking at a linear move up or down in an asset without context.  Here’s what the price trends look like in absolute values.   

          But the context here is your real cost of living including the costs to maintain your home versus the current value of your home.  With inflation on the rise we see higher maintenance costs, higher utilities, higher building costs, higher borrowing costs and even higher taxes (coming soon).  We also have a higher cost of living in general which establishes a higher benchmark for pricing just to stay even.  Therefore, if we care about the state of our wealth and the value of our assets, then we must measure them relative to our variable costs as measured by inflation.  This is what real estate price trends look like when factoring in inflation over time (again hat tip to Bill McBride ) 


           Hopefully, when looking at charts above, the important takeaways are obvious.  

  1. Real estate prices have peaked and are just now starting down.
  2. Real estate prices are peaking from a much higher level than the last peak in 2006.
  3. Factoring in inflation (aka affordability), we should expect some relatively severe price impacts in coming months unless mortgages come all the way back to where they were in 2020 (~3%).
  4. Note the time gap between price peaks.  I could argue that timing with real estate purchases matters more than location, location, location.

The Big Picture 

          Now I’m going to switch to demographics as related to very long-term real estate trends. Here are a few facts. 

  • Households in our country tend to buy real estate from our early 30’s (first homes) and hold properties until we are in our early 80’s.  That’s a long time!  
  • Beyond 80 years old, there is a strong tendency to sell property and move to assisted living, move in with family or otherwise. 
  • Currently only 13% of our population is age 80+
  • By the year 2042, more than 30% of our population will be 80+
  • 46% of our population is in prime real estate purchasing age (between 30-39).  But that number only grows by 2% until it peaks in 2030.

          If we mash all these stats together, we see that demand for housing is likely to be strong for another 7-8 years but after that we are sort of facing a Japan style environment with an old and aging population who is not likely to want more real estate and is far more likely to be on the sell side as we move closer to the 2040’s.  For those who know the history of Japanese real estate, you know that prices entered the dark ages in about 1990 when their population had become older with a large portion over the ages of 80.  Here’s a chart of the Japanese Real Estate prices from approximately 70 years ago to now. Note how the percent change by year stayed negative or near zero for almost three decades.  Interestingly, we are just now starting to see prices move consistently higher – need to do some more research on that. 

 … In Conclusion 

          It would seem logical that real estate price trends are going to be highly cyclical and far more sensitive to borrowing costs at least for the next 7-8 years.  We should also expect higher carrying costs associated with owning real estate starting today.  Landlords beware!  Today we’re at the top of the cycle but we would look for a next buying opportunity after the next recession (2024) when prices and rates should be lower.  We will still see some incredible moves higher as those Millennials and Gen Zs continue to buy the American Dream!  However, after 2030 and increasingly until 2042, we will start to see inventories rise consistently as demographic demand starts to wane.  When I am 75 years old, I’m sure I’ll look back at this time and marvel at todays’ price appreciation as a thing of the past.  

          This is some very blunt and non-actionable advice of course.  But seeing as how real estate is arguably one of the largest drivers of economy and wealth in our country, it’s worth spending some time trying to understand the big picture and set some expectations looking forward.  Homes are wonderful places to live, but maybe we should start thinking about them as just that and not as much of a source of wealth or income.  Something to consider. 

Enjoy the weekend, 

Sam Jones 


The Stockings Were Hung By The Chimney With Care…..

December 1, 2022

The Stockings Were Hung By the Chimney With Care… Why Not Fill Them, With “Valuable” Shares?

So clever… This update is directed toward parents of young adults looking for a solid game plan to help their children get started early with investing.  What an incredible gift we have before us; To get the right types of accounts set up, funded and invested while there are still multiyear investment opportunities to be had.

First let me start with a little shaking of my head in disbelief.  Why is it that we all charge out to power shop on Black Friday or Cyber Monday to take advantage of deals on consumable, discounted stuff but show no interest in buying shares of public companies trading at multiyear valuation lows?  Which one of these will be the better investment in 10 years; A pair of Chuck Taylor high tops at $199 (on sale from $249) or putting $199 into any number of stocks paying 5% dividends with 10-15% annual growth in earnings per share?  I’ll bet the shoes are in the landfill by year two.  Seriously, think about this as the gift that keeps on giving this holiday season.  Your kids will not even remember the high tops but they will fondly remember you when they can thankfully afford a down payment on their first home.

Ok, let’s do some smart shopping.

Set Up Two Types of Accounts for your Kids

This is some conditional advice so please reach out to get clarity on your specific situation.  Broadly speaking, a Roth IRA for a Minor (Aka custodial Roth IRA) is a great first account to get set up.  Any major brokerage shop like Fidelity or Schwab has on-line tools to help you set this up in a few minutes.   The condition here is that your child is under 21 and has some form of earned income.  This income can be from a summer job with regular w-2 income or even baby-sitting, mowing lawns etc with some limitations.  Some think you need to file a tax return for your kids to be eligible to set up a Roth IRA.  Not so!.  Unless your child earned $12,550 or more in 2022, there is no need to file a tax return.  My kids generally make between $3-5K in summer jobs so they are no where near the threshold. But, they are still eligible to contribute the lesser of their earned income or $6000/ year to a ROTH IRA.

Details to Remember About Roth IRAs

  • There is no tax due on their earned income (if under $12,550), so we are not trying to fund a traditional IRA with deductible contributions right? Thus we are making NON-deductible contributions to a Roth IRA.
  • Roth IRA money grows tax FREE. At their age, they might have 40 years of growth in these assets that will never be taxed.
  • Roth IRA money cannot be accessed without penalty until age 59.5. They cannot buy a sweet Camaro with this money, it is for their retirement.

The second account to set up is a taxable UGMA/UTMA (custodial) account.  This is an account that they can access and will formally own under their own name at the age of majority in your state.  In Colorado, that age is 21.  Unlike the Roth IRA, realized gains and income are taxable and will add to their “earned income” each year so you need to be careful about staying under that $12,550 number unless you care to file a tax return.  There are again different thresholds for how income and capital gains are taxed in these types of accounts.  Here’s a great cheat sheet from Fidelity on all types of custodial accounts, including rules, limits and taxation.  The point of this second account is to provide them with starter money, out of school, that they can use for a down payment on a home, maybe to cover rent, go to graduate school, etc.  I would spend a little time having open conversations with your children about the purpose of this money.  It will be theirs but is to be used responsibly and for their financial foundation and not for consumable items or entertainment.  If you have concerns along those lines or children with disabilities, talk to us about setting up a trust.

Who is Funding These Accounts?

In either case, the source of the funding doesn’t matter which means you, as the parent, can help them!  Enter the teaching moment.  This is the “deal” we have with our two boys with the clear intention of developing good financial habits with saving and investing.  At the end of every summer, we match 100% of their annual savings toward their investment accounts.  My sons typically save 25-30% of their summer incomes toward investment accounts.  In our example, they might choose to save $1000, we match the $1000 for a total of $2000.  Often, they split the total savings equally between their Roth IRAs and their custodial UTMA accounts – some to long term, some to short term.  Suddenly, they have skin in the game and want to start talking about what types of investments they can buy, what should they buy, how do they build a complete diversified portfolio, what does a bear market feel like, etc…?  Good stuff to learn at an early age.   More importantly, they develop a habit of saving annually for themselves and their futures.  Side note – I have strong opinions about the risks and bad precedent of handing your kids lots of money, open credit cards, and paying for everything without them having to bring anything to the table.  You are digging a very deep hole of dependence let alone stealing your kids’ right to any sense of pride in making it on their own.  Teach them to fish right….

How to Invest These Accounts?

Roth IRA – This is long-term, tax-free money so let’s invest it that way. In this account they should own mostly stocks and seeking growth or combinations of growth and high income.  We have low cost ETF asset allocation models that we can provide to you if you simply want to own 7-10 total positions and build an aggressive portfolio on a set it and forget it basis.  Please ask!  There are also some developing options for the gamers out there.  I think 2023 will provide us with several generational opportunities to buy individual stocks with a portion of this account.  My kids have about 20% of their Roth IRA accounts in individual company shares with the rest in index ETFs.  They have been doing some buying recently in names like Airbnb (ABNB), Bloom Energy (BE), Zillow Group (Z), Snowflake (SNOW), Block (SQ) and Wayfair (W) with Rivian (RIVN) and Uber (UBER) on the watch list.  These are stocks that we have talked about and are now trading 60-80% off their highs.  Some may do nothing, some may not exist or be purchased in the future.  But some may do Amazon type returns in the next 40 years!   There will be more opportunities like these in 2023.  The rest of their portfolio is fully diversified across equity ETFS and high yielding closed-end funds.  These accounts will be substantially larger by the time they are 59.5 years old.

Custodial UGMA/ UTMA  – For these accounts, we want to be a little more cautious with sensitivity to capital gains and taxable income.  This is shorter term money that needs to be there for them when they are done with schooling.  Here we like to own a fully diversified portfolio of stocks, bonds, commodities, gold, internationals, income and real estate funds.  We want to lean into value and lean away from speculative growth.  These positions are to be bought and held with a focus on adding to positions when they present discounts in order to limit risk and taxable gains.  Are there any discounts in the markets now?  You betcha.

Final Thoughts on Risk and Return

This is a good conversation to have with your young adult children.  There is a notion in the financial media that more risk equals more return over time when it comes to security selection.  This is patently false.  More risk is just more volatility.  Now, if over time, volatility is in the form of higher prices, then good for you and honestly the broad markets do tend to rise over time.  As long as you have at least 20 years of investment time horizon, your odds of success are nearly 100%.  However, as evidenced by the number of popular names that have experienced wipeouts in the neighborhood of 80-90% this year, risk can also mean downside volatility.  How long does it take to break even on an investment that loses 90% of it’s value?  Let’s say, not in your lifetime.  Any company that goes through this type of loss of capitalization and price decay is either on its way to bankruptcy or a buyout.  Timing matters, what you buy matters, profits and balance sheets matter, valuations matter.  Last year, we watched the Superbowl played inside the Crypto.com stadium.  Laughable.  Why is anyone surprised that Crypto turned out to be an enormous dumpster fire of an investment.  Concentration of your wealth in just a few companies is simply leveraging the concept of risk.  Nothing is forever and there is no guarantee of success with any company even over the long term.

When investing with your kids, perhaps the greatest gift is the gift of knowledge.  Use real investment accounts and savings habits as a mechanism to teach them how to be mature investors, including the beneficial principles of diversification, patience, humility, and solid behavioral practices like buying when share prices are down and cheap.

… and to all a good night

Sam Jones


The Next Big Thing

November 9, 2022

Regular readers might recall the rollout of our Big Three investment themes in April of 2020. Two of the three are now well entrenched and we’re about to see the third and final big opportunity unfold as the markets and economy slide deeper into recession. Dynamic asset allocators should be on the move here, reorienting portfolios for the Next Big Thing.

The Big Three
You might want to take a few minutes to brush up on the Big Three by reading our Dec 30th 2020 post HERE. For the reluctant, I’ll summarize the themes and bring you up to date with the state of these trends.

1. Commodities and Inflation Hedges – Entrenched uptrend since April of 2020.
Now in its third year, the commodity/ inflation trade is still one of the only investment themes that has actually made money in 2022. Energy is up over 60%, broad commodity funds are up 24%, inflation beneficiaries like steel, copper and materials are flattish YTD. And just this week, Gold, Silver and associated miners have just bottomed in a clear and decisive way after falling a surprising 30% (blame = super strong US dollar). Gold miners are up 17.5% in the last three days. We bought gold miners in several strategies on October 3rd. From a cycle standpoint, we should expect to see commodities top out around here as the economy slides deeper into recession. We might continue to move pure commodity positions more into gold and gold miners as a safety measure in the weeks ahead.

2. Value Over Growth – Entrenched since December 2021
Wow did we get this right! Even this week, growth investments are still plumbing new lows led lower by mega cap tech names like Tesla, Meta (Facebook), Alphabet (Google), Microsoft and Amazon. Take a look at the losses in both stock prices as well as market cap, courtesy of Bespoke.

I have said many times that the concentration of investor dollars in these six names represents the greatest risk to investor wealth in a generation. This risk extends to the US stock market as well, given their dominant weight in the broad market indices. As these names go, so goes the market. These six alone have collectively lost over $5 Trillion in market cap in the last 12 months. The entire S&P 500 has lost over $9.5 Trillion by comparison. That is a lot of wealth destruction and I feel badly for those who still maintain concentrated positions here. I see no sign of a price bottom in growth at this point. Meanwhile value is trading very well and higher in most cases. “Value” represents those companies that have high free cash flows, pay dividends, are profitable and carry relatively little debt. This environment rewards those types of companies and punishes over-priced growth names, especially those without profits and burn cash to stay warm. Outside of New Power, our investment strategies remain piled high in value, dividend payers and virtually zero growth or technology names. At this point, the benefits of owning value over growth have manifested as (much) smaller losses but losses, nonetheless.

This chart is only updated through mid-August. The only thing different to date is that the orange bar in 2022 is now – 33% while the green bar is down around -8%.

If history repeats, we’ll see these relatively small losses in value turn into absolute gains as the stock market finds its footing and develops more sustained price recoveries. How long can the Value over Growth theme last? Again, with history as our teacher, each dance partner tends to maintain the lead for 5-6 years before handing off to the other. We are in year two of this value leadership so yes there is much further to go especially considering how long growth previously held the lead (from 2004 to 2020!).

3. Internationals over Domestic – The Next BIG Thing!
This theme has been a bugger as the Federal Reserve has been driving up the US dollar for almost two years in conjunction with runaway inflation. A rising US dollar creates headwinds for US dollar denominated international investments.

But this is about to change in a big way. How do I know? Two main reasons.

The first is that we are already in a quiet recession, but that fact is about to become very loud and pronounced in the next 30-60 days (rising inventories and unemployment, falling real estate prices, falling demand, falling PMIs, falling prices, lower CPI, etc.). The US dollar falls when recession is finally recognized. Again, a falling US dollar acts as a tailwind to international investments.

The second reason is this:

This was the cover image of Barrons on October 4th, 2022. The Barrons record of highlighting the very last gasp of any long trend is nearly flawless. If you’re on the cover of Barrons, the trend is over, your days are numbered. The same goes for Time Magazine Person of the Year.

Elon Musk 2021

Now the king of chaos and volatility in 2022.

The US dollar peaked on October 12th and has yet to make a higher high for the record.

Select internationals, especially non-China based emerging market funds and stocks, are already outperforming the US market. Brazil is up 21% YTD (we own it), Latin America in general is up 17% (we own it), Mexico is up 11% (we own it) and I see compelling evidence that Europe is bottoming now (buying now). 27 of 42 foreign country ETFs are now outperforming the US stock market and that number is growing daily. This is happening while the US dollar is still sitting at its highs of the year. Imagine what will happen when the US dollar starts a new downtrend!

Finally, remember that the valuations of the international world are almost 50% of those in the US. We are no longer the best-looking horse in the glue factory. In addition, most international stock and bond funds are paying dividends in the 5-6% range. This is a compelling moment in time to rebuild or initiate a solid international position in your portfolio as we have done for our clients.

Other stuff – Bonus thoughts in brief

• Mid term elections will not make a difference to this market. A very health year end rally into early 2023 is a high probability even as recession headlines hit the press.
• Real estate is in trouble – long term. More on this in future updates.
• Inflation has peaked – this will become more and more obvious. In 6 months, Year over Year CPI measures will be close to zero.
• Feel free to book and PAY FOR your international adventure of choice. After exchange rates, your trip is 20-30% off.
• There are lots of juicy short-term interest-bearing securities out there. I clipped this from Fidelity yesterday AM. Wow! We are beginning to reinvest our Income models now after carrying nearly 60% cash for most of 2022. Look at the 18-month column.

Lots of new opportunities developing for investors who are awake, aware and care to make some money in 2023.

That’s it for today. Big snow coming to Steamboat Springs, CO. We already have over 25”.

Sam Jones

From the Playbook – Relief Rally

October 24, 2022

Last Friday’s market action offered investors a clue as to how the market will react when the Federal Reserve begins walking back their uber aggressive policy of raising interest rates.  We would be wise to let history be our guide as we are indeed still playing this game right from the 70’s playbook.  In the short term, there is a reasonable chance that a very strong relief rally, in stocks and bonds, has just begun.

What just happened?

Well, it was inevitable that the Fed would begin its choreographed chatter about how they might consider, maybe, sort of, potentially begin talking about reducing the size of their rate hikes after the November meeting.  As we have said for the last several years, this Fed and specifically Jerome Powell is driven by the path of least embarrassment.  They will pursue a relentless policy until it is almost absurd for them to continue and then they will change 180 degrees on a dime.  Today, we have overwhelming current and forward-looking evidence that the US and global economies are either in recession or heading swiftly in that direction.  It would be very embarrassing for them to continue raising rates much beyond 2022 if the data continues as such.    On Friday, Mary Daly of the SF Fed, casually slipped a comment to the WSJ that they “should start planning for smaller rate hikes”.  Following her comments, in a hot second, the US stock market moved from -0.80% on the day to +2.3%.

What a “relief”!

This is the same Mary Daly who said earlier in the week that rates will push higher for the foreseeable future and Fed Feds will reach at least 4.65%.  The Daly show indeed.  Enough Fed shaming for this update… but they do deserve it.

Just The Data Please

Robert Berone contributed a terrific article to Forbes on Saturday entitled, “Did the Fed Just Blink? The Markets Think So”.  Google that and read it if you can (Forbes articles are tough to read without subscriptions).  Berone compiled behind the scenes evidence showing just how quickly our economy, housing, and employment are all slipping into the red.  His point was that the Fed needs to stop now given the evidence.   I’ll give you a few highlights in case you cannot read the article.

  • The Housing market is already in decline. Home sales are down for the last 8 consecutive months by -23.8%.  Regardless of what you might hear today, prices tend to track sales.  65% of the population owns a home and price declines will have a negative wealth effect on spending.  Mortgage applications are down -38% year over year (record declines).  This chart was also offered in a separate Fortune article supporting Berone’s comments.  Albeit slight, home prices have started falling predictably.

  • On the employment front, there is a discrepancy of more than one million jobs between the Seasonally Adjusted and Non-Seasonally Adjusted data as reported by the BLS. This will be reconciled by the end of the year and the November 4th report is very likely to show a much weaker labor mark t than what was previously reported.  Does the Fed have eyes on this report?

Big employers have already announced either smaller holiday hires or outright layoffs between now and the end of the year including Walmart, Macys, Fed Ex, Microsoft, Meta , Twitter! And Netflix.  Berone also highlights reporting issues in the BLS related to part time versus full time measures as well as the exclusion of small business labor in their data, all having the impact of overstating employment figures in the last 6 months.

  • Inflation measures are mostly showing disinflation now. The Fed is choosing to only look at things going up in price while the majority of “things” are actually falling in price.  Retail sales are down 3% in the last month. Other things falling in price since the spring:  Furniture, appliances, moving expenses, used car prices, gas at the pump, natural gas, prescriptions, theater tickets, hotels, sports events, apparel, and IT services.  Even rents are starting to fall in several major metro areas.  Food is flat year over year.  Tesla just announced a 9% drop in prices for their vehicles sold in China in order to compete with BYD.  We are past peak inflation for sure and CPI is very likely to begin falling from here, perhaps dramatically.

The Fed has been working to fix and correct their last error (not raising rates in 2020 and 2021).  Now they are at risk of making another policy error.  Given the public shaming and overwhelming recessionary evidence pressing on them every day, it shouldn’t be a surprise to hear them start to back pedal on their stance.

The 70’s Playbook

Regular readers and those attending our annual meeting know that we have been expecting a relief rally in both stocks and bonds to begin in October.  At present the marginal lows of the year appear to be October 14th for stocks.  Bonds may be bottoming now.  Relief rallies can be the start of new multiyear bull markets which is still possible if we somehow avoid a deep recession in 2023.  For now, any rally is simply a response to a change in the central bank policy as we discussed above, and is literally just a relief that the worst of the tightening cycle may be behind us.  Relief rallies can take prices of both stocks and bonds all the way back up to the old highs in a very short time period.  Wouldn’t that be nice!  It happened in the 70’s.  The 70’s play book lasted for the better part of 10 years and stocks (and bonds) moved within a 30-40% trading range during that entire period.

It would seem quite possible that we are just now carving out the lower end of the playbook trading range if history is repeating.

As inflation peaks and the Fed becomes more accommodative, stocks and bonds tend to bottom.  Here’s what that looked like in the 70’s at least for the first round of peak inflation!  In the 24 months following the 1974 low, prices recovered almost back up to the previous highs.

Of course, that was not the end of inflation in the 70s, and the cycle of stocks, bonds and employment and moving inversely with inflation continued until 1982.   The next chart shows the pattern of inflation and unemployment during the 70’s.

Investor Action Items

We like to offer some relevant advice in our updates so here it is.  Investors might use this time and place to consider the following:

  1. Make your IRA contributions for 2022 now if you haven’t already – check on your eligibility and limits for deductible contributions here.
  2. Consider conversions from IRA to Roth IRA – please consult with us first!
  3. Deploy sideline cash to taxable investment accounts – This is likely to be the last good window to get this done in 2022.
  4. Add to 529 plans for children’s education accounts for 2022.
  5. Help your kids open a Roth IRA if they had summer income.
  6. Fund your Health Savings Accounts for 2022 if needed. Details and limits here.
  7. There are plenty of investment opportunities here including tax loss harvesting, rebalancing asset allocations, shifting from short term to long term and high yield bonds, etc. We do all of this for our clients in their managed accounts as needed.

As always, we’re here to help our clients with all the messiness.  Please reach out to us if you have questions or need assistance.

We are excited with the technical bottoming pattern that has been developing since the lows in June.  The timing of a relief rally starting now is very good.  As we said in our annual meeting this is a time to banish that fight or flight impulse.  Stay opportunistic, stay in the game, life is long!

Cheers

Sam Jones

Still Jammed Up

October 7, 2022

This market is a lot like waiting in a traffic jam.  It’s never fun and some of us handle it better than others, but we know that eventually the road will open, and we’ll hit the accelerator again.  This will be a quick update and follow up to our annual meeting presentation (recording now available here for those who missed it).  The intent is to give you some mental peace as you head into the weekend knowing that we are still waiting, very defensively positioned, for the developing bottom in both stocks and bonds.

Jammed Up

I think most drivers are aware of the amazing WAZE app that shows traffic patterns and best ways to get from A to B during rush hour.  I won’t go into any city without it personally.  As I look at the sea of red on my quote box today, I can’t help but think this is a lot like a traffic jam where we just have to sit, breathe and know that it will end soon.

The Employment Report released today was the cause of the market’s dive as the monthly number of new hires came in slightly above expectations.  The market was hoping for a more recessionary number. But let’s unpack that for a moment.  First of the all the economy ONLY added 208,000 jobs last month, a mere 8,000 more than expected.  Not exactly a blow out number and 200,000 new jobs is actually pretty soft historically.  A big number is almost twice that amount in an economy that is actually growing.  Second, there is context to any unemployment figures.  Since 2002, our Labor Force Participation rate has been falling steadily and is still well below the last peak set in 2019.

This is a function of early retirements, or others who are still eligible to work by age, but have dropped out of the work force either by choice or involuntarily. Looking at the chart above, only 62% of eligible workers are actually working in our country.  That deserves some more research but not today.   When we have a shrinking labor force (read aging population), any small uptick in employment numbers is going to make us look far more fully employed than we really are.  That’s simply not representative of what’s happening across the working population at large.

Finally, we have to also keep a close eye on the claims for unemployment at this stage which is also telling a different story than what you heard on the news today.  Take a look at the right edge of the chart below.  Do you see the sharp curl UP as claims for unemployment just jumped?  So today, we’re all jammed up looking only at the taillights in front of us and wondering how long we’ll have to sit in this traffic.  But if you could see the “jam” from the perspective of WAZE, you would know that employment is not nearly as strong as suggested today, and we’re on the very cusp of a change where the Fed is going to recognize we’re heading fast toward recession.  I’m guessing November will mark the end of the current rate hike cycle.

While We Wait

Just like any traffic jam, we ultimately settle into resolution that this is going to take a while.   We can do some lane hopping but we really know it won’t matter much as all lanes are all jammed up.  Stocks and bonds are the lanes, and they are both jammed up. Today, our risk managed strategies remain defensive, heavy in cash and hedged with short positions.  It’s been bloody since August.   Consequently, we have cut exposure to the markets since it became obvious that interest rates were not done rising in sync with our menacing Federal Reserve (argggg) despite the very obvious recessionary pressures globally. These are our cash positions in our various risk managed strategies and we literally don’t get more defensive than this in almost any market conditions.

STRATEGY                             Current Cash Position

Freeway High Income                    56%

Retirement Income                         64%

All Season                                          20%  (+10% short position)

Worldwide Sectors                          23%

New Power                                        37%

Gain Keeper Annuity                      40%

Our biggest risk today is that we are grossly underinvested considering the upside potential of this market, but we have to stick to our discipline and trend following rules. When there is nothing to buy, we wait and hold only positions that are generating income or significantly outperforming the broad markets.  That’s where we are today, waiting, fuming, but ultimately knowing that we have some open road not too far ahead.

Have a great weekend and know that your capital is largely out of harm’s way, and we are looking forward to the next BIG thing in the markets – rising prices!

Have a great weekend,

Sam Jones


Half Full or Half Empty?

September 6, 2022

August turned into a bit of dumpster fire following the meeting of the Jackson Hole Economic Symposium of Federal Reserve governors.  For this Red Sky Report (print version only this month), we’re going to do a current state of the markets overview and then reach into our advice bag to offer some perspectives on how smart investors might view these conditions.  Spoiler alert- we are approaching another “half full” market buying opportunity.

The Current Dashboard

Bespoke always does an excellent job putting numbers to the market in a clear and easy to understand way.  Here’s a snapshot of their world stock market dashboard through the end of August. There are four columns of information here, all provide a unique perspective.

Let’s dive into the numbers and look for some insights

YTD% – This one is obvious.  Bespoke has packaged and averaged all countries into two groups; developed markets (DM) and emerging markets (EM).  DMs are down -19.48% on average while EMs are down only -11.80%, thanks to Latin America, Brazil and Taiwan in particular.  I find the fact that EMs are down so much less than developed markets very interesting and compelling.  Long time readers know that Emerging markets now present one of the most attractive valuation opportunities of the last two decades and relative performance may have already begun.  In fact, Jared Dillian of the Daily Dirtnap reposted this chart a few weeks ago showing that Emerging Markets, as a group have sold off to the same level as the year 2000, expressed as a ratio to the S&P 500.  In other words, Emerging markets are just as attractive today as they were in the year 2000 relative to the US stock market.  Students of history know that Emerging markets earned over 18% PER YEAR for over 10 years while the S&P 500 generated less than 1.5% PER YEAR in total returns (2000- 2010).  I will say this as boldly as I can.  Emerging market stocks and associated country indices may be approaching one of the best buying opportunities I have seen in the last 12 years.  We have begun methodically and slowly accumulating emerging market stock index ETFS across all strategies now with the intention of riding a new multi-year bull market (in EM) as long-term core holdings.

MTD% – Not a lot of additional information or insights here.  However, nearly 100% of the monthly losses in August across the world have happened since Jerome Powell lit the dumpster on Friday, August 26th.  Europe is following the US central bank policy now with a pedal to the metal driving developed market economies faster and faster toward recession.  Amazing work by those folks.  I’m being sarcastic if you couldn’t tell.  Central banks are literally creating more volatility (higher highs and lower and lows) in the financial markets.  They kept rates at zero while inflation was raging and now, they are raising rates as inflation is factually falling.  Crazy stuff.  Can’t explain it other than some blend of incompetence and political pressure?  I am not smarter than the Federal Reserve, but I do recognize a pattern of poor timing and resulting outcomes.

COVID Crash 52 -week High – This column shows the gain or loss from the highs BEFORE the COVID crash in 2020.  The “high” points vary a bit from country to country, some occurred in 2019, others at the beginning of 2020.  What you’ll notice is that four countries are still trading above the pre-covid highs.  They are the US, Canada, Taiwan and India.  The war in Ukraine and resulting pressure on energy costs are certainly having an effect on Europe and that side of the world.  It is not a coincidence that the US and Canada, both energy independent countries, have been the two of the world’s best performing stock markets in the last two years.

Current 52-Week Highs  – This column is measuring the percentage losses since the last 52 week high, again packaged by Developed economies and Emerging economies.  From this perspective we see high consistency.  World stocks are down -24% from the highs across the board.  Not shown on the chart are other asset classes so I’ll provide them for reference here.

10-Year US Treasury Bonds -16.29%

High Yield US corporate bonds – 11.20%

Commodities – 16.05%

US Oil – 20.40%

REITS (IYR) – 18.21%

What is a Smart Investor to Do?

Ok, so it’s pretty easy to look at the list above and get depressed.  Where is an investor to go when every single asset class, country, sector and style of investing is trending down?  This is the half empty view.  If we flip that reality on its head, we could logically argue that EVERYTHING is now trading at a discount!  As always, I find comfort in being a contrarian because no investor ever makes money by following the crowd at extremes.  I will be bearish when stocks are overbought and popular – like most of 2021 and I will be bullish when stocks are cheap, trading at discounts and investors are sour.    In mid-June, Investor Sentiment was as negative and bearish as I have ever seen in my career.  We talked at length about that extreme condition in the June 23rd blog update “Beyond the Obvious”.    Historically speaking the June lows are likely to mark an important turning point of some sort.  They may even be THE lows of this bear market. We are going to find out soon.

Since the June 14th lows, stocks are still up +5-6%, bonds are still up +2-3% and commodities are now down -13% through the end of August even with the near waterfall type selling of the last two weeks.  This tells me that stocks and bonds are still trying to carve out a long-term low.  This also tells me that inflation has peaked along with commodities for this cycle.  Anything can happen and those conditions may change but that’s the way it looks from here.

In our last blog post, we stated the following

“We are looking for a window to start gradually buying into the bottom of a devastating bear market!  This window is not a small window but could take weeks or months.  No need to rush as the economy is just now slipping into formal recession.” – Red Sky Report June 23rd, 2022

Nothing has changed from that view.  Longer term investors should stay focused on the objective of adding money to investment accounts as this bear market creates more attractive valuations and opportunities over time.  We will also reiterate that investing in a diversified portfolio across multiple asset classes and styles (stocks and bonds, domestic and international, small caps and large caps, developed and emerging markets) is smart and important.  Remember, nearly everything is trading at a discount from recent highs.  What a wonderful time to pay attention to the internal balance of your investment portfolio! New money even might be used to get rebalanced by adding to positions that have experienced larger losses in the last two years.

We have also advised our clients of opportunities to add cash to investment accounts twice in 2022.  The first was in mid-March with a conditional warning to only add 1/3 of your annual savings goal.  We stated then that stocks are likely to make new lows and conservative investors could wait for a better time and place.  The second opportunity to add to investments was the 23rd of June in our Blog post where we recommended adding another 1/3 of your annual savings’ goals.  We are now approaching another obvious time and place to consider adding to any investment accounts.  I will hedge again and say that stock selling pressure can easily drive prices still lower, but the technical condition of the markets is extremely oversold as of today September 1st.  I choose Half Full!

I hope everyone had the greatest summer ever.  Personally, I’m looking forward to the fall and seeing many of our clients in person (finally) at our annual meeting in October!

Regards

Sam Jones


Observations Beyond the Obvious

June 23, 2022

The second quarter of 2022 was one for the record books.  There are a lot of obvious things happening today creating fear and anxiety among investors as the markets “price in” the reality that the US economy is heading into recession (perhaps already there).  What lies beneath the surface is what interests me now as we look ahead to a market environment with a new set of opportunities.

The Obvious

Let’s get this out of the way.  We are in a global bear market.  Stock markets across the world put in long term price peaks between November of 2021 and Jan of 2022.  Since then, the only things going up are commodities, energy and anxiety.  Bear markets tend to create a lot of wealth destruction.  Here in the US, estimates suggest that $2Trillion in market capitalization value (aka investor wealth) has been destroyed thus far in 2022.  You might remember my warnings back in 2020 that stimulus in the $Trillions would eventually find its way into the stock market and be destroyed by the next bear market.  Well, here we are!  Not all of the $4.5 Trillion in stimulus was destroyed but let’s say half for easy math.

To illustrate the point, look at this chart of small options traders, specifically after 2020 when stimulus money was delivered during COVID.  Yes, some of it went to covering lost incomes, paying for much needed food, etc.  But, make no mistake, billions of dollars went into the stock market via investors who were day trading options at home.  Obviously, they had no idea what they were doing and are now sitting on massive losses.


As of last Thursday, the S&P 500 was down 23%, and other indexes are worse, down 30% or more.  The average bear market in the S&P 500 shows a standard loss of 28%.  Remembering how we calculate averages; it would be wise for us to assume that the final low may not be in, but we could certainly be two-thirds of the way there.

Last week rattled every investor’s cage.  Statistically, according to the fine work of Sentiment Trader.com, the seven market days leading to the final low on June 16th marked the worst selling pressure since…. 1928.  Extreme selling pressure is measured when more than 90% of stocks decline on any given day.  The particularly good news is that these type of capitulation events where investors sell everything indiscriminately, tend to be exhaustive events that occur at, or very near, significant market lows.  More on this in a minute.

Also, on the list of the obvious is losses in Treasury bonds.   From the highs in the year 2020, long term Treasury bonds are down almost 40%.  Wow!  The Lehman Aggregate Bond index is down 12% in the last year and losing over 7% per year since 2020.  We have not seen bonds and stocks lose together like this since our last bout with inflation in the 70’s.  For the last 4 decades, bonds have moved inversely with stocks and buffered total portfolio losses to something tolerable. Investors who have no other form of risk management (outside of holding bonds) are feeling this bear market in full.

The Fed is inducing a recession.  As we heard from Chairman Powell in his congressional testimony yesterday, this is the only way to contain the sharp rise in the rate of inflation. They are probably right about needing to induce recession as inflation becomes a greater worry, but they are OBVIOUSLY very late to the fight.

Inflation is still rising on many fronts including core inputs, COVID related industries and especially rents. The idea of too much money chasing too few goods (definition of inflation) is just now starting to revert to a healthier equation; Less money is now finding some or enough supply. And yet, there is still an obvious imbalance that needs to be resolved. Don’t expect the Feds to be your friend anytime soon.

Inflation is very tough to contain once it has been let out of the bottle.  As I said in the last update, demand is obviously drying up daily for everything from housing and mortgages to consumer goods and services.  Inflation numbers from here are not going to be as strong as what we have seen in the last few months and quarters.  In fact, the rate of inflation may be peaking right now.

The obvious state of the financial markets and economy is pretty terrible today.  Now let’s turn to what is not so obvious and see some of the new opportunities that are developing quickly.

Beyond the Obvious

Looking across the spectrum of technical market research that we follow, I see between 3 and 5 other instances of oversold extremes in history that match the current environment.    In all cases, the markets were higher by a minimum of 24% and as much as 48% over the course of the next 12 months.  Those are high odds.  Most investors who don’t understand cycles and markets might see a headline about pending recession and think, “OMG, I’ve got to get defensive or run to cash”.  Counterintuitively, markets tend to carve out long term BOTTOMS within 2-3 months of the first headlines recognizing the arrival of a Recession.  Remember, the markets are an excellent discounting mechanism and have been selling off dramatically for over 12 months in anticipation of today’s condition.  Aggressive and opportunistic investors are now allowed to start looking for new leadership and bottoming patterns in their favorite stocks, sectors and indices with an eye toward long-term buying opportunities.  To be clear, we are not buying the dip, we are looking for a window to start gradually buying into the bottom of a devastating bear market!  This window is not a small window but could take weeks or months.  No need to rush as the economy is just now slipping into formal recession.

Thoughts on Bonds

This is the time and place for the Treasury bond market to find a lasting bottom.  Here we have some urgency as bonds are already outperforming stocks by almost 8% in the last 30 days.  As I said in the last update, bonds are now behaving well and offering investors some much needed diversification juice in our portfolios.  Bonds tend to be the best performing asset class during recession.  Now that Treasury bonds have sold off by double digits and are paying reasonable interest rates again, we can and should consider allocations here.  Again, this might not seem intuitive or obvious as the Fed is headlining with the big fight against inflation as we speak.  This Federal Reserve board is so late in their habits that I won’t be surprised to hear them plan to cut interest rates just as the economy is emerging from recession.

Top in Energy and Commodities

We have heard for the last year that oil is going to the moon.  We have heard that the war in Ukraine will never end and that investors should be overweight in energy for the foreseeable future.  This week we sold the last of our commodities and energy positions across all strategies and we’re happy to be taking profits in something!  Russia has largely accomplished what they set out to do – destroy Ukraine.  Russia has also earned it’s spot as global bad guys for the next several decades.  They will suffer for it just as Germany did post WWII.  Given that the war could end quickly and quietly any day now, we think it’s a grand time and place to take profits in energy.  Gas prices will also find a top in the next 30 days if the patterns follow, just as President Biden comes to the rescue with a national holiday on gas taxes which are projected to save good Americans a total of $13 over the course of the holiday.

It has been an incredible run in energy and commodities but enough is enough and the set up for future gains from here are pretty poor as the cycle moves very quickly toward contraction and favors non-cyclical sectors and asset classes.

New Opportunities

From a cycle standpoint, the market is beginning to look across the chasm of recession and toward recovery.  The first sectors to find traction and lead the charge out of any bear market are financials, consumer groups and technology.  All three have been beaten to dust in the last year.  Nevertheless, our focus should be on these not so obvious sectors looking for strength and leadership in the months to come.

Yesterday, I did my own study on different investment themes that have been outperforming the S&P 500 over the last 30 days.    Several of these groups did not even make a new low last while the broad market plunged to new lows by 5-6%.

These are the results:

Select technology- cloud computing, software, internet, fintech, clean energy, and telecom

Select consumer – consumer staples, consumer discretionary, and retail groups

Healthcare – Pharma, biotech and healthcare services

China – all

Emerging markets – all

Bonds – corporate bonds, municipal bonds, treasury bonds, investment grade bonds

Dividend growth funds

Large cap and mid cap growth funds

Preferred stock funds

With the exception of financials, looking at this list, I see the market quietly starting to accumulate new investment in sectors and asset classes that should perform well during recession and early recovery.

As we close out this quarter, try to remember that the markets are just one very large cycle.  There are up cycles and down cycles.  This is not the end of days nor time to hide.  These are the times to look for discounts and long-term entry points for your hard-earned investment dollars.  Honestly, I don’t expect to convince anyone of the pending opportunity now any more than I could convince someone to sell their Tesla stock above $1200 in 2021 (You know I tried).  Investing is anything but obvious which makes it so difficult.  As always, we are here to help and guide you.  Please reach out if you would like to talk through any anxiety, concerns or need help with your outside investments.

Happy Summer Solstice and Go Colorado Avs!

Regards,

Sam Jones

The Eighth Wonder of the World

“Compound interest is the eighth wonder of the world. He who understands  it, earns it … he who doesn’t … pays it.”
― Albert Einstein

Investors would do themselves a huge favor by spending a little time on the basic math behind compound returns.  We tend to forget why this is important until we start to recognize risk and volatility in our investments.  It is never too late to revisit the 8th Wonder of the World and apply the concept to concrete investment ideas like dividends, risk management and real wealth accumulation over time.

The Math – Average Returns versus Compound Annual Growth Rates (CAGR)

Let’s give a quick example and then explain the results.

Please excuse the crude spreadsheet but the numbers are accurate.

Above we have three investors (A, B and C).  Each investor has a different portfolio of holdings.  Investor A earns a fixed return of 5% during each of the three years.  Investor B has a portfolio that earns the SAME average return mathematically, over the three years but does so with a more volatile series of returns.  And investor C has a Robinhood account, owns crypto currency and is swinging for the fences with unproven growth stocks.  Still investor C, generates the same average return of 5% on paper despite the increased volatility.  But each of these investors do not actually experience the same real returns as in returns that they can spend each year.  The Compound Annual Growth Rates (CAGR) for each investor are shown above.  Investor C clearly earns a lower real compound return compared to Investor A or B.  Think of CAGR as the real returns that an investor earns on their investments and might be able to spend to offset living expenses.  Average returns are mathematically deceptive because they do not reflect an investors’ real experience, wealth or purchasing power.  Why does higher annual volatility in a portfolio reduce compound annual returns?  I’m glad you asked.

The Merciless Math of Losses. 

Quiz – If I lose 50% of my investment during a bear market, how much of a RETURN is necessary to break even?

Answers:

  1. 50%
  2. 100%

If you chose Answer B, then you understand it takes a greater return than the amount lost to break even due to the fact that you have less capital working for you at the lows of any decline.  If I had $1 and lost .50 cents, I would need to make back .50 cents just to break even, right? (100% return on .50 cents)

The greater the loss, the greater the return needed to just break even.  Think of all those stocks like Peloton that lost 97% recently.  It would take a return of over 900% just to break even if you lost that entire amount (not in your lifetime, that company will be bought shortly).  Many stocks these days are down well over 60% including some giants like Netflix.  Indeed, these are lessons to be learned the hard way for some.

Implications for All Investors

The point of this critical lesson in financial literacy is this.  If we want to improve our Compound Average Growth Rate (CAGR), which is the only true measure of wealth accumulation over time, we should constantly focus on building portfolios that earn consistent returns over time and find ways to mitigate or reduce annual volatility.  Ok, so how do we do that?  What tools do we have in our process, our selection or portfolio design that will help generate consistent returns (aka high CAGR)?

CAGR Seeking Investment Solutions

  1. Own dividend and income generating securities.

I can’t say enough about the value of earning dividends and income in any investors’ portfolio.  Consider this.  In the last two calendar decades (12/31/1999 – 12/31/19), the S&P 500 index with dividends earned a Compound Annual Growth Rate of 5.98%.  Without dividends that number was only 4.03%.  Dividends accounted for exactly 33% of the total returns over time.  I would not personally consider the S&P 500 to be a high dividend index, but it does have a history of paying between 1.5 and 2% annual dividends as an index.  Now imagine over a long period of time what we might generate in CAGR if we invested the bulk of our capital in an actual high dividend ETF or index.  We own many of these in our All Season strategy so I’ll list a few holdings and their current annual dividend rates.

  • Ishares Core High Dividend ETF (HDV) 3.47% annual dividend yield
  • SPDR S&P High Dividend ETF (SPYD) 3.72% annual dividend yield
  • I Shares Select Dividend ETF (DVY) 3.24% annual dividend yield

*All three ETFS above are positive YTD by 7-9% in a market that is down double digits.

Chart of DVY (shown in Red) versus the S&P 500 (shown in Green) YTD.

Already we are seeing high dividend paying securities outperforming the markets in absolute terms but importantly they are also generating their returns with far less daily and weekly volatility than the market.  This is an example of consistency and the benefits of real CAGR results at its best!

For what it’s worth, our MASS income strategy which focuses 100% on high Dividends and Income generated from stocks, alternatives and bonds, continues to generate an annualized yield of over 6%.  I’ve said this before but this is just gold in an inflation driven environment like today.

  1. Diversify!

It is sort of sad to me to see how many investors are sitting with undiversified portfolios these days.  I only see portfolios of stocks when new investors come to our firm.  Never bonds, never gold, never alternatives, or non-correlated holdings.  Always Technology, always concentrated positions and always a pile of identical stock index securities.  Admittedly, bonds have not served their historical role as a good diversifier in the last two years as bonds have lost as much or more than stocks since early 2021.  But, But, But!  Bonds are now returning to their place in line.  Bonds are beginning to behave themselves and actually move differently than stocks (non-correlation).  That is a tremendous breath of fresh air.  Gold is still moving in sync with stocks but historically has also been a great diversifier. Commodities are the real diversification winner in the last 24 months, as we know, but I never see commodities in anyone’s portfolios except for our clients.  Some think Crypto currencies offer diversification.  However, the evidence would suggest that Crypto is just negatively correlated to anything that goes up (wink).

Regardless, this is a great moment in time to revisit your asset allocation mix and make sure to truly, really, and honestly diversify your portfolio.  If you need help as a DIY investor, please call us asap.  The direction of the markets and economy from here is not going to be pleasant to investors who don’t get this right

  1. Risk Management

The final method of seeking consistency and a higher CAGR, is to trade away volatility and this is not something I would recommend unless you know what you’re doing.  Very publicly, I reject the notion that this is impossible.  We have 27 years of data and historical performance to prove it.   People like Warren Buffet and George Soros have done so successfully for decades.  Markets are inefficient enough and run to obvious extremes often enough that there are clear opportunities to “manage” volatility.  Sometimes we want to reach for volatility, like at market lows.  Other times we want to reduce our exposure to volatility at market highs.  Of course, it can be done successfully and repeatedly, but it’s a ton of work and involves a lot of skill and experience.  If you feel capable, have at it.  If you want us to do it, call us.  Otherwise, seek consistent CAGR returns with #1 and #2 above.

On the Main Stage

               I’ll finish with a brief update on current conditions and trends as well as a few predictions which I am always reluctant to make.  The economy is slipping toward recession.  There is little doubt this is happening and the possibility of the Federal Reserve somehow avoiding a recession is nearly zero in my book.  We are already beginning to see the labor market cool off with lower payroll numbers and slightly higher unemployment this month.  More layoffs are coming in bulk, especially from the tech sector.  Those who remain employed however will still be able to collect higher wages and salaries especially in higher skilled industries with high demand. I suspect the work from home thing might also be coming to an end for a lot of companies.  It was fun while it lasted right?   This is not the end of the world but rather a cyclical event that occurs every 5-7 years.  We haven’t had a lasting recession in over 12 years so we’re way overdue.

Real estate is doing what it always does.  Trends in pricing and sales tend to follow behind the stock market by 9-12 months so we would expect to see some weakness starting about now.  You will likely hear about rising inventories of unsold homes, a shift from a seller’s market to a buyer’s market and some price declines in high flying areas of the country.  Income properties, like fully occupied commercial or residential rentals, are really in the sweet spot against high and steady inflation, so those types of assets might continue to appreciate.  This should not come as a surprise to anyone.

Meanwhile, the Fed is going to raise rates again by .50% next week on the 15th.  They are driving the economy into recession, make no mistake.  It’s the only way out of the inflation bubble we’re in.

Inflation is also starting to peak in terms of the rate.  But remember, that inflation is only reported as a rate of change, year over year.  If inflation goes flat from here and for the next 12 months, we will still be operating in an environment of very high costs of living.  It is not until the inflation rate drops dramatically over a period longer than one year that we will really start to feel some easing in pricing pressures.  In the end, as I indicated several months ago, we will probably have to wade through a tough cycle of “Stagflation” (stagnant economy with inflation), something like the 70’s.

The thing to remember as we move into this next stage of the economic cycle, is that it is just another season or cycle.  There are opportunities and risks in every cycle.  Our job is to be awake and alert to changes in the environment and simply allocate our assets and resources appropriately.  Easier said than done but that why we are here to help.

That’s it for now.  Summer is coming fast!  Enjoy it.

Cheers,

Sam Jones

Investing in Scarcity

May 20, 2022

We have returned to an era that is going to be quite different from anything we have seen in the last four decades.  For the last forty years, the US markets and economy have increasingly focused on one primary theme: Growth.  When I say growth, I’m really talking about technology and innovation aimed at consumers.  Looking backward, our economic and market cycles were either growth, or not growth (aka recession) all measured by consumption and GDP.   Clearly now, we are embarking on a different game of winners and losers with a different set of rules, and it seems investors are still struggling to adapt their attention and capital allocations.  I am hopeful that this update might help to reframe investor focus and for our clients, provide a better understanding of why we are allocating your investment assets as we are.

The Big Three Revisited

Regular readers know that we have been focusing our clients’ investment capital across three themes for almost exactly two years (since April of 2020).  In short, these are:

Value over Growth

Commodities Bull Market

International Outperformance

I’ve a talked about these in several ways including Reflation, Reversion and Recovery themes which you can find HERE.  Another way we might answer the question “Why These Three?” can be seen through the lens of scarcity.  Scarcity is something we are all becoming familiar with when we think about all the things we want to buy, but cannot get (That special car, bike, building materials, windows, employees or even more fundamentally certain foods).  Supply shortages are a common topic of conversation usually beginning with the phrase, “I can’t believe I can’t get……”.  And the affect of supply shortages and scarcity are also becoming engrained in our day to day lives in the form of higher prices for everything (aka inflation).  Scarcity is by definition, a decrease of supply and good econ students know that when supply falls, prices rise.  Eventually, rising prices lead to a fall in demand (aka recession) as the market is always working to find “equilibrium”.

Please forgive the econ lesson but there is an important principal here for all to understand.  Eventually at some point in time, demand will fall.  You have heard that the Federal Reserve is raising interest rates.  They are doing so to increase the costs of borrowing, thereby increasing pricing even further, hoping that demand will respond lower.  The Federal Reserve wants to SLOW DOWN demand without putting the US economy into recession (two consecutive quarters of negative GDP).  Personally, I don’t think the Feds need to raise rates as much as projected.  Consumers are already feeling the squeeze of near hyper inflation and at the tipping point of cutting back on their spending habits as much as they can.  Demand will fall all on its own from here forward with or without the Fed.

Ok enough Econ and back to the point.

Looking at the investment environment through the lens of scarcity provides us with some clear guidelines and preferences when considering where we should park our capital.  I’ll present the framework of Scarcity from different perspectives with investment implications.  Of course, any advice given should be considered within your personal situation, portfolio, tolerance for risk and so forth.

Scarcity of Natural Resources/ Commodities

I think some of the absolute best work done in this space has been produced by Crescat Capital, here in Denver through the research of Tavi Costa and Kevin Smith – www.crescat.net .  We know that commodity prices entered a new bull market almost exactly two years ago in May of 2020.  The COVID decline in prices at that time set the stage for commodities in aggregate to put in a final low after declining 75% in value over the previous 12 years. 24 months later, commodity funds are up 160% in the aggregate.  This new bull market in commodities is in the early stages contrary to what you might hear.  Inflation as stated by CPI will go through cyclical ups and downs but the fundamentals and backdrop for commodity prices to run higher for years is likely to persist.  The backdrop is again about scarcity.  There are a couple charts available at Crescat Capital showing that the commodity cycle relative to equities expressed a ratio is just now turning up from a multi-year low and has a long way to go.  Commodities are highly likely to outperform equities for years to come.

Unlike all other areas of the market like finance, technology, healthcare, etc., we have also witnessed a dramatic drop in capital expenditure (Capex) in commodity producers in the last 10 years (see below).  In simple terms, this means, globally, we have not invested in capacity (potential supply) among commodity producers, and it will take years to rebuild that capacity to meet current demand.  Even if we see a drop in demand via a recession, commodity producers are still unlikely to be able to produce enough raw materials (metals, basic materials, oil and gas, wheat, corn, soybeans, etc.). This does not even account for disruptions from wars, climate change, nationalism, etc.  Scarcity among commodities will drive prices higher.

Investment implications should be pretty clear; For those with capacity and willingness to invest in a truly diversified portfolio, you would want to keep a healthy allocation in your portfolio to:

  • Broad based commodities funds and ETFs
  • Metals and Mining stocks or funds including gold, lithium, rare earth metals, aluminum, steel
  • Agriculture producers and soft commodities funds
  • Energy distribution companies

Thankfully, there are many to choose from that do not issue annual k-1’s to shareholders!  We are maintaining an overweight allocation to commodities and commodity producers for our clients in all investment strategies outside of our pure income models.

Scarcity of Good Income-Bearing Investments

This is a sore subject for any retiree who is feeling the pain of rising costs of living (8-9%) while secure Treasury bonds are paying at best 3%.  What are they to do?  A heavy stock allocation is not particularly appealing considering the risks and volatility involved but Treasury bonds are also down 10% and only paying 3% annual interest.

This situation has evolved from 40 years of an accommodative Federal Reserve who remains committed to dropping rates to near zero every time we get a hiccup in economic growth.  The chart below is of the interest rate on a 10-year US Treasury bond.

Now, with real rates (interest rate minus inflation) solidly negative, we have come to a hard place and time.   Again, we want to reframe the discussion and invest in scarcity.  In this situation, we need to call on a diversified portfolio of dividend, preferred, fixed and variable income producers in order to push up our annual income without taking on full stock market risks.

Our investment solution to this form of scarcity is our Multi-Asset Income (MASS Income) strategy designed exactly to solve this challenge.   To date, the strategy has generated a little over 3% in dividends and income paid monthly to our clients’ accounts.  This is an annualized rate of over 6%, not quite the current rate of inflation but very attractive!  We have set the default for income and dividends to be paid to cash rather than reinvested in additional shares.  Cash dividends and income in hand give you a lot of options.  The strategy attempts to remain fully invested and as such there is price volatility in the underlying holdings (39).   Investors in MASS Income need to be prepared for their balances to fall in environments like these.  BUT, we are ultimately focused on these securities continuing ability to pay their monthly dividends and interest to shareholders.  Think of it like a rental property we intend to own for a long time.  We do not really care about the market price of our rental property from month to month, but we do, and should, care about keeping our properties occupied and paying regular rent.  So far, so good. All “tenants” are paying full and rising rents in our portfolio!

Scarcity of Value

Just as it sounds, the current investment environment is short on real value (valuable) investment options.  What is value?  Value is something that appreciates over time or has current utility for us today.  Back in 2010, there was a surplus of value to be found as prices of mega cap growth names were trading at very attractive levels.  After 11 years of massive price appreciation, these same stocks became value(less) despite the fact that the companies themselves continue to provide great value to their users (Tesla, Amazon, Apple, Meta, Netflix, etc.).  In fact, the vast majority of stocks on the growth side of the market moved higher in sync to outrageous valuation levels.  Now, 18 months after the peak, we see what happens to overpriced securities when the tide turns against them with prices down 30-90%.  But here’s the important thing to understand.  Real value is still scarce.  Growth names are still unattractive, do not pay dividends or interest and are in the wrong type of business for the new era.  If you think about it, do we have scarcity of mobile phones (Apple)?  Is there a scarcity of streaming content to watch (Netflix)?  How about Electric Vehicles (Telsa)?  Or Cloud based service providers (Microsoft, Google, Amazon)?  Is there a scarcity of social media outlets (Meta)?  Meanwhile, there are companies out there who are directly in the business of providing scarce resources that everyone needs (not wants) and offering investors great values with stocks at attractive prices, paying regular income and dividends today.  The current environment offers discriminating stock pickers an opportunity to remain invested in “Value” as we do inside our Worldwide Sectors strategy.

I cannot provide individual names here but generally speaking, our Worldwide Sectors individual stock holdings (18) have valuations that are 40% less than the S&P 500 in aggregate, are outperforming the markets over the last 3-6 months in price action and paying 2-5% annual dividend income.

I have to throw in the potential of Internationals and Emerging markets here as well.  Admittedly, outperformance by international investments has been hard to spot.  The war in Ukraine might have created a delayed game here.  Rising interest rates are also tough on emerging markets and less developed countries who rely heavier on debt spending.  And above all, a very stiff rise in the value of the US dollar by 13% in less than 12 months has made it even tougher on performance.  And yet, despite all the headwinds, global indices are actually performing better than the US markets YTD and especially since the last FOMC meeting on May 6th.  In fact, Brazil (keeper of global raw materials and natural commodity resources!) is up almost 18% YTD.  Mexico is also slightly positive YTD, and others like Australia, Canada, Spain and the UK are not far behind.  There is something brewing here.  By all signs, it seems likely the headwinds facing internationals are on the tipping point of reversing.  But the most important thing to remember is that internationals are trading at nearly 50% of the valuation of the broad US stock market.  Invest in scarcity and real value is scarce!

Looking the Wrong Way

I love this image.  I feel like investors these days are like the whale watchers on this boat, peeling their eyes for a return of the WHALEs (like Amazon, Meta, Netflix, Apple and TESLA).  Meanwhile, new whales are breaching regularly on the other side of the boat.  It’s time to turn our heads and recognize the new leadership.  Scarcity is driving opportunity for those willing and able.

We’re here to help as always.

Have a great weekend and know that you are in good hands.

Sam Jones

Upcoming Event

2024 Wealth Transition Preparation Webinar | Details & RSVP >>