September 6, 2022
August turned into a bit of dumpster fire following the meeting of the Jackson Hole Economic Symposium of Federal Reserve governors. For this Red Sky Report (print version only this month), we’re going to do a current state of the markets overview and then reach into our advice bag to offer some perspectives on how smart investors might view these conditions. Spoiler alert- we are approaching another “half full” market buying opportunity.
The Current Dashboard
Bespoke always does an excellent job putting numbers to the market in a clear and easy to understand way. Here’s a snapshot of their world stock market dashboard through the end of August. There are four columns of information here, all provide a unique perspective.
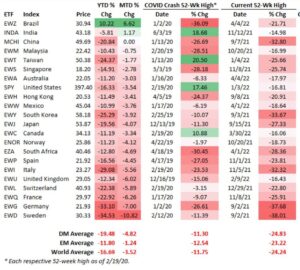
Let’s dive into the numbers and look for some insights
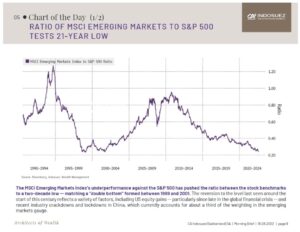
YTD% – This one is obvious. Bespoke has packaged and averaged all countries into two groups; developed markets (DM) and emerging markets (EM). DMs are down -19.48% on average while EMs are down only -11.80%, thanks to Latin America, Brazil and Taiwan in particular. I find the fact that EMs are down so much less than developed markets very interesting and compelling. Long time readers know that Emerging markets now present one of the most attractive valuation opportunities of the last two decades and relative performance may have already begun. In fact, Jared Dillian of the Daily Dirtnap reposted this chart a few weeks ago showing that Emerging Markets, as a group have sold off to the same level as the year 2000, expressed as a ratio to the S&P 500. In other words, Emerging markets are just as attractive today as they were in the year 2000 relative to the US stock market. Students of history know that Emerging markets earned over 18% PER YEAR for over 10 years while the S&P 500 generated less than 1.5% PER YEAR in total returns (2000- 2010). I will say this as boldly as I can. Emerging market stocks and associated country indices may be approaching one of the best buying opportunities I have seen in the last 12 years. We have begun methodically and slowly accumulating emerging market stock index ETFS across all strategies now with the intention of riding a new multi-year bull market (in EM) as long-term core holdings.
MTD% – Not a lot of additional information or insights here. However, nearly 100% of the monthly losses in August across the world have happened since Jerome Powell lit the dumpster on Friday, August 26th. Europe is following the US central bank policy now with a pedal to the metal driving developed market economies faster and faster toward recession. Amazing work by those folks. I’m being sarcastic if you couldn’t tell. Central banks are literally creating more volatility (higher highs and lower and lows) in the financial markets. They kept rates at zero while inflation was raging and now, they are raising rates as inflation is factually falling. Crazy stuff. Can’t explain it other than some blend of incompetence and political pressure? I am not smarter than the Federal Reserve, but I do recognize a pattern of poor timing and resulting outcomes.
COVID Crash 52 -week High – This column shows the gain or loss from the highs BEFORE the COVID crash in 2020. The “high” points vary a bit from country to country, some occurred in 2019, others at the beginning of 2020. What you’ll notice is that four countries are still trading above the pre-covid highs. They are the US, Canada, Taiwan and India. The war in Ukraine and resulting pressure on energy costs are certainly having an effect on Europe and that side of the world. It is not a coincidence that the US and Canada, both energy independent countries, have been the two of the world’s best performing stock markets in the last two years.
Current 52-Week Highs – This column is measuring the percentage losses since the last 52 week high, again packaged by Developed economies and Emerging economies. From this perspective we see high consistency. World stocks are down -24% from the highs across the board. Not shown on the chart are other asset classes so I’ll provide them for reference here.
10-Year US Treasury Bonds -16.29%
High Yield US corporate bonds – 11.20%
Commodities – 16.05%
US Oil – 20.40%
REITS (IYR) – 18.21%
What is a Smart Investor to Do?
Ok, so it’s pretty easy to look at the list above and get depressed. Where is an investor to go when every single asset class, country, sector and style of investing is trending down? This is the half empty view. If we flip that reality on its head, we could logically argue that EVERYTHING is now trading at a discount! As always, I find comfort in being a contrarian because no investor ever makes money by following the crowd at extremes. I will be bearish when stocks are overbought and popular – like most of 2021 and I will be bullish when stocks are cheap, trading at discounts and investors are sour. In mid-June, Investor Sentiment was as negative and bearish as I have ever seen in my career. We talked at length about that extreme condition in the June 23rd blog update “Beyond the Obvious”. Historically speaking the June lows are likely to mark an important turning point of some sort. They may even be THE lows of this bear market. We are going to find out soon.
Since the June 14th lows, stocks are still up +5-6%, bonds are still up +2-3% and commodities are now down -13% through the end of August even with the near waterfall type selling of the last two weeks. This tells me that stocks and bonds are still trying to carve out a long-term low. This also tells me that inflation has peaked along with commodities for this cycle. Anything can happen and those conditions may change but that’s the way it looks from here.
In our last blog post, we stated the following
“We are looking for a window to start gradually buying into the bottom of a devastating bear market! This window is not a small window but could take weeks or months. No need to rush as the economy is just now slipping into formal recession.” – Red Sky Report June 23rd, 2022
Nothing has changed from that view. Longer term investors should stay focused on the objective of adding money to investment accounts as this bear market creates more attractive valuations and opportunities over time. We will also reiterate that investing in a diversified portfolio across multiple asset classes and styles (stocks and bonds, domestic and international, small caps and large caps, developed and emerging markets) is smart and important. Remember, nearly everything is trading at a discount from recent highs. What a wonderful time to pay attention to the internal balance of your investment portfolio! New money even might be used to get rebalanced by adding to positions that have experienced larger losses in the last two years.
We have also advised our clients of opportunities to add cash to investment accounts twice in 2022. The first was in mid-March with a conditional warning to only add 1/3 of your annual savings goal. We stated then that stocks are likely to make new lows and conservative investors could wait for a better time and place. The second opportunity to add to investments was the 23rd of June in our Blog post where we recommended adding another 1/3 of your annual savings’ goals. We are now approaching another obvious time and place to consider adding to any investment accounts. I will hedge again and say that stock selling pressure can easily drive prices still lower, but the technical condition of the markets is extremely oversold as of today September 1st. I choose Half Full!
I hope everyone had the greatest summer ever. Personally, I’m looking forward to the fall and seeing many of our clients in person (finally) at our annual meeting in October!
Regards
Sam Jones
