More Important Than Election Results

9/30/2024

The 3rd quarter proved to be a healthy one for almost all asset classes despite expectations for a normal summer slump. The 3rd quarter was also an eventful one on many fronts, as changing leadership among various asset classes is setting the stage for the next phase of the business cycle.  Simultaneously, as we barrel toward a very important presidential election in just 35 days, it is no surprise to hear that common question: what will happen to the markets if Harris or Trump wins?  Today, I’m going to tell what will matter more to our economy and the financial markets than the outcome of the election.  Understanding the current market regime and the variables that drive it are critical to every investor’s success.  This is an important moment, to say the least.


Big Changes in the 3rd Quarter

First, let’s look back at the last 90 days and listen carefully to what the market is telling us.  Erase your mind of what you think will happen, what the media is saying and any assumptions about the future.  Let’s just observe what IS happening now.  Let’s start with our basic asset class performance, including a few notable groups.  These are unofficial quarter end results as I am writing on Sunday the 29th of September… one more day to go.

Broad Commodities (GSG)                      -4.96%

S&P 500 Large Cap Growth (IVW)        +3.10%

S&P 500 Index (SPY)                                 +5.33%

Dow Jones Industrial Avg  (DIA)              +8.66%

S&P 500 Large Cap Value (IVE)               +8.59%   

Small Cap Value (IWN)                              +9.81%

Small Caps       (IWM)                                +8.97%

Emerging Markets (EEM)                           +9.44%

Europe/ Developed Intl (VEA)                  +7.50%

Long-term US Treasury Bonds (TLT)      +8.45%

10 YR US Treasury Bond (IEF)                   +6.01%

Silver Bullion (SLV)                                     +8.62%

Clean Energy Index (ICLN)                       +10.89%

Gold Bullion (GLD)                                     +13.96%

Real Estate (VNQ)                                      +16.36%

So, what we witnessed in the 3rd quarter was a clear change in leadership from the top two indices shown in BOLD Yellow, which dominated the markets in the first half of 2024, to an environment that is far broader-based and productive across multiple asset classes.  Commodities were the only losers for the quarter, but they are still consolidating some of the huge gains of 2023 and are now looking very constructive – more on this in a minute.  It was a great quarter overall, and our clients should be very pleased with results given that we are fully invested across a majority of the asset classes shown above (outside of the top two 😊).   If we are listening closely to the markets, we notice a few things:

Treasury Bonds have been outperforming the mighty S&P 500 since about July 10th

Gold is outperforming everything – again, still, in the short-term, intermediate-term, and long-term!

Small Caps are doing better than large caps

Real estate has entered a new bull market coming off two years of declines

Emerging Markets just woke up, driven by a massive new stimulus package in China.

Value has again taken over leadership from Growth

On the last point, it’s critically important to note that value (IVE) has actually been outperforming growth (IVW) in total returns since September 2020.  This is the dominant four-year-long “regime” for the markets.  I only mention this hard fact because so much of our attention, focus, and capital still seems enamored with the large-cap growth story, which includes the “Magnificent 7” stocks.  Indeed, several individual tech names like Nvidia have dominated everything by a wide margin in recent years, but the aggregate performance of large-cap growth compared to large-cap value has been underwhelming. Here’s a 4-year total return chart for those who are shaking their heads.

Value (IVE) in RED

Growth (IVW) in GREEN

There is a good lesson here about risk and return.  As investors, we are told that if we take greater risks, we can expect greater returns.  Said another way, volatility is the price we pay for returns.  The longer I’m in this business, the more I find this mantra to be false.  There is no guarantee of greater returns, just greater volatility.  Similarly, we also know that compounding is one of the greatest forces of modern wealth accumulation, and volatility is the clear enemy of compounding (see above).  The chart above speaks loudly.

Last month, I noted the likely change in the business cycle from Stage 6 angling toward Stage 1, where bonds take the lead.  This seems to be happening as well and became pronounced in the 3rd quarter,  but we remain watchful and skeptical about the durability of this move in the bond market given the underlying, cost-driven, supply-side drivers of inflation that are still percolating in our economy.  This brings me to the main topic of today’s update.


Bigger Issues Than the Outcome of the Election

As I said in the preamble, it is critically important for investors to understand the market and economic regime as a framework for all decisions, asset allocation, expectations, etc.  What do I mean by regime?  I am talking about the general environment, the stage of the business cycle, and investors’ appetite to expose themselves to stock market risk, inflationary, deflationary, and other macro variables.  There are “Seasons” to the market and our economy, just like we have Winter, Spring, Summer, and Fall. How many of us check our weather apps daily to help decide what to wear or what we can expect if we plan to do some outside activity?  I certainly do.

Today, all eyes are on the US presidential election.  But it’s important to note that, beyond the social and global implications,  presidents themselves tend to have very little impact on market trends.  I am regularly asked what will happen to the markets if Trump or Harris is elected.  The answer is that you’re asking the wrong question.

The real question we need to address is the fact that we are still running the highest fiscal deficit in history, specifically a $2 Trillion budget deficit which represents over 5% of total GDP, on top of the highest level of U.S. Debt in history.

The ramifications of our current debt and budget deficits are significant today and more so in the years ahead.  This factor alone is likely to shape the market and economic regime and consequently dominate policies for the next few administrations regardless of their political leanings.

What are the ramifications?  I’ll try to make this simple.

  • The current annual interest expense on our government debt is larger than the entire defense budget.
  • Neither Republicans nor Democrats seem willing, interested, or able to cut our spending as a nation. The very base of our economy is rooted in government spending, stimulus, low taxes, and cheap money. We have approached a time and place where the Federal Reserve and the Treasury Dept are running out of options to defend against any form of economic downturn.
  • US Treasury Bonds are not going to be a dependable asset class looking forward. Sovereign nations are net sellers of US Treasury bonds and switching to Gold and Silver for their reserves.  This is a clear response to our irresponsible governance and spending habits at the federal level.
  • Gold, mining stocks, and industrial metals need to be part of a modern portfolio.
  • The magical results generated by a 60% stock/ 40% bond portfolio in the last 20 years are not repeatable looking forward.
  • There is a high likelihood that inflation will kick up again quickly in this new economic regime of historically high debt and deficit spending.
  • Social Security, Medicare, and net interest expenses are all increasing our fiscal deficit annually with retiring baby boomers and will require some uncomfortable reform or austerity measures in the next 7-10 years.
  • Taxes will have to go up to balance the budget, it doesn’t matter who is in the White House.


Barrons ran this article over the weekend:

Gold Rally Is Sending a Warning. It Relates to the U.S. Debt


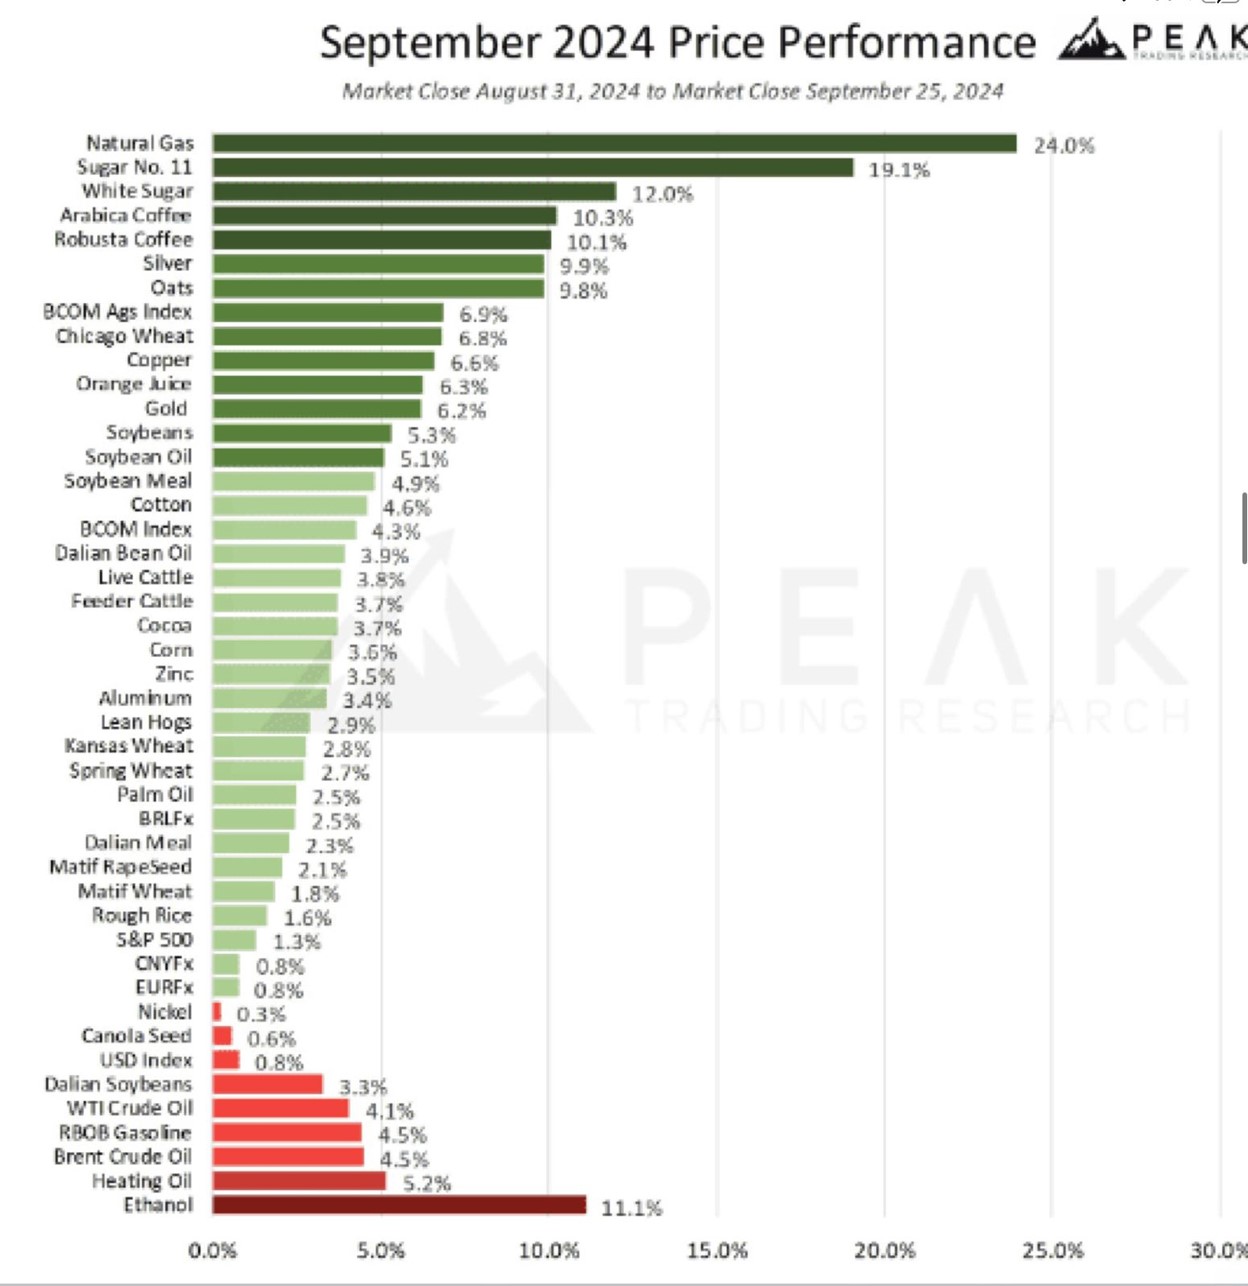
Commodity Prices Are Way Up in September

As a confirming input variable, I want to finish with a quick update on commodity prices.  Our current variety of inflation is less demand-driven and more cost-driven.  I’ll explain.  The Fed has done a great job of containing the demand driven type of inflation but look at what is happening on the cost side of inflation.  Commodity prices continue to march higher with the sole exception of oil and gasoline.
I’ve said for several years now that the Fed has little control over the real drivers of inflation. These, again, are cost-driven variables: Things that add cost to our prices (aka inflation) and things that will not yield to changes in interest rates.

  • Climate change adaptation – Hurricane Helene!
  • Nationalism, reshoring of manufacturing and tariffs – Inflationary!
  • Geopolitical conflict and wars
  • Retiring baby boomers leading to higher entitlement costs
  • Shortages in housing stock
  • Shortages in raw commodities
  • Mandatory infrastructure spending
  • Absurd levels of US federal debt and deficit spending

As I write, we are already seeing some signs that inflation is bottoming even while the economy remains soft.  This would be an unwelcome development, obviously, especially since we haven’t solved the real problem of our Federal Debt and Fiscal budget deficit.

The summary statement is this.  This election will matter a great deal, perhaps more than any other, in terms of the direction of our country and the very foundation of our democracy.  But, from a market and economic perspective, investors would be wise to focus more on the current regime, which is dominated by cost-driven inflationary forces punctuated by our fiscal deficit.    When the weather starts getting colder and Winter is on the horizon, we simply select from our cold weather clothes options and put away our summer gear.  This change in regime is a change of season, no different.

This is complicated stuff, and honestly, most investors have very little understanding of how to reconstruct their portfolios to accommodate.  This is what we do for our clients, so they don’t have to worry about it.  We make the changes and reallocate as needed in our tactical investment strategies.  Please reach out if you need help.

I’ll leave it there for this month.

Thank you to all of our clients for another great quarter.  We appreciate your trust and confidence and look forward to seeing you at our virtual annual meeting on October 24th at 5:00 pm MST.  Don’t forget to register for the event!

Cheers

Sam Jones

President, All Season Financial Advisors


New Investment Opportunities for a New Stage of the Business Cycle

9/9/2024

In last month’s Finding Benjamin post, “We are on the Move,” I daylighted a significant shift happening in the markets in response to a change in the state of the economy and the corresponding business cycle.  Our tactical asset allocation approach for risk-managed strategies has subsequently made significant changes in the last three months, and now our work is almost complete. For this month’s update, I’m going to dive a little deeper into some very attractive and timely investment opportunities associated with the US and Global economies moving swiftly into a contractionary phase.  Despite that feeling of doom and gloom, we finally see real emerging options for investors outside of mega-cap technology.


Market Timing versus Tactical Asset Allocation

Before getting into today’s content, I want to use a little ink talking about good and bad behavior when it comes to investing.  We have all heard about the pitfalls of trying to time the market.  It’s very difficult, given that the markets are largely unpredictable.  Furthermore, humans are emotional creatures.  When we see losses, big losses, losses that persist over months or even years, we tend to lose confidence and begin to think about selling to just cut the pain (anxiety and fear).  Eventually, when losses become severe enough, most investors do sell, and they tend to sell at or near the lows.  It’s just a fact and one that is well documented by simply observing selling volumes at market lows.  This is why market timing gets such a bad rap.  Selling at lows and sitting in cash while the market rebounds smartly without you is absolutely devastating to your long-term financial independence, confidence as an investor, and general wealth accumulation.  Simply put, most DIY investors don’t have a process, a strategy, or a discipline when it comes to making investment choices.  Decisions are largely made on the basis of greed and fear, which again leads to very poor “market timing” results.

Tactical asset allocation is different from market timing in that we are simply following leadership trends in and among asset classes like stocks, bonds, inflation hedges, and even alternatives.  Portfolios that are tax-advantaged, like retirement accounts, can, even should, consider tactically changing the weightings to different asset classes based on current evidence and economic trends without the need to guess at the future.    We can and should attempt to remain invested in most markets, but our exposure to stocks, bonds, and commodities doesn’t have to be static in all market conditions, right?  Think back to the year 2021 when inflation was ripping higher and Treasury bonds were falling 1%/ day.  Inflation is not the type of thing that goes away quickly, and thus, one could easily and logically underweight bond allocations inside of our portfolios and instead increase our allocations to stocks and inflation beneficiaries.  Clients of ASFA know that we did this in bulk in 2021 and carried only a minimum allocation to bonds throughout 2022 and 2023 while inflation was still running hot.  So again, being tactical about our exposures to different asset classes based on current embedded evidence, the stage of the business cycle, and observable trends is not market timing, but it is logical and can make a material difference in your risk-adjusted returns over time.


Business Cycle Moving from Stage 6 to Stage 1

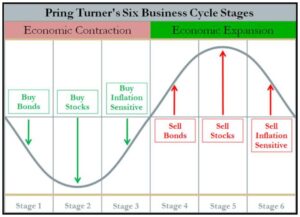
I’ve shown this illustration from the famous work of Martin Pring a thousand times, but here it is again.

This is a very blunt guide and illustration regarding investment allocations for the different phases of the business (economic) cycle, but the pattern, sequence, and consistency of the various stages have held true throughout time.  Economies will expand and contract forever and always.  The trick of course is to accurately identify where we are in the business cycle.  If one were to simply and casually read headlines or listen to any form of financial media, you would hear a clear and consensus view that the US (and global) economy is getting weaker month after month following the peak in early 2022.  While economic growth is still factually positive, the trend of slower growth is leading us toward that eventual state of contraction which we formally call a recession.  As investors, our tactical decisions regarding allocations to different asset classes are always based on the trend and direction of the economy and not the ultimate destinations for formal events like the “Recession”.  Today, the business cycle is in Stage 6 above based on economic evidence like a weaker job market, falling leading economic indicators, negative consumer savings rates, and a 10-year new high in consumer credit card delinquencies.

Even the Fed is clearly stating that the US economy is now weak enough to justify cutting interest rates and becoming more accommodative in their monetary policy.  The facts are clear: Growth is slowing (Stage 6) but not yet negative or contractionary (Stage 1).  Nor have we formally reached a recession (Stage 2).

We can also simply observe what’s happening in different asset classes to confirm what the business cycle is telling us.  Today, the bond market is making new highs, while the US stock market appears to have peaked on or around the 10th of July.   In sync, we are watching the commodities complex and other inflation beneficiaries, which have shown clear signs of weakness since peaking in June.  Trends and leadership in stocks, bonds and inflation sensitives are clearly suggesting that the business cycle is moving from Stage 6 back to the beginning of the cycle in Stage 1.

Ok, so what does that mean?

What might a smart, observant, and logical investor do if they are inclined to embrace Tactical Asset Allocation according to the business cycle investment guidelines above?

You know the answer

We want to do the following:

  1. REDUCE your exposure to stocks, especially anything that is clearly overvalued or highly speculative.


  1. REDUCE your commodities and inflation beneficiaries, Things like energy, basic materials, hard assets, or natural resources allocations.


  1. INCREASE your allocations to bonds and other interest sensitives.

Please note this is not a recommendation to any individual investors to make specific trades or any buys or sells of securities.  Every investor’s situation is different, and care should be taken to consider individual tax consequences, risk tolerance, and investment objectives.


New Opportunities in Bonds and Interest Sensitives

Finally, we have arrived.  Let’s walk through some options that are clear and present today.  I want to say that this commentary is probably specifically targeted at investors who are currently sitting on great gobs of cash, maturing CDs, and money market funds, all of which are going to start paying less annual interest at the end of this month.  This is a great time to consider redeploying cash to other more productive interest-bearing or dividend-paying securities.

First up is equity and mortgage REITS– which are paying between 5- 9% on average.  I’ve heard a lot of chatter about the dire situation of commercial office space, high vacancy rates, and enormous discounts for select commercial properties under contract.  The situation is real, and the situation will get worse through the end of 2025 as debt for these properties comes due.  You might ask, why on earth would we consider buying an equity REIT (Real Estate Investment Trusts that own actual properties) or a mortgage REIT (owns mortgages of all types) in this environment?

The answer is that the Investment REIT market has already been devastated from a pricing standpoint and is already rising from deeply depressed lows of last year even while delinquencies and defaults are rising.  This is what happens in every cycle.  Liquid securities and investments form tops and bottoms before we see actual events occur on Main Street!  Take a look at this chart provided by JP Morgan, which shows how Investment REITS bottomed in 2009 while real estate defaults and delinquencies (DQ) were just starting a long and painful climb higher.  By the time the Residential and Commercial DQs were peaking, more than 70% of the multiyear bull market in investment REITS had already occurred.

The same thing is happening today.

Delinquencies and defaults are just now rising dramatically, but REITs appear to have put in a long-term bottom and are now rising in a new bull market trend.  See below

The All Season Multi-Asset (MASS) Income strategy is largely a REIT investment strategy and is benchmarked to VNQ, as shown in the chart above.  But MASS Income also has exposure to other similar interest-sensitive asset groups like Preferred securities, BDCs, Utilities, high dividend stocks, and fixed income.  The strategy has a current estimated annual yield of 8.42% in dividends and interest. The exciting opportunity is that prices are also finally moving strongly higher as investors are bidding up the values of these interest-sensitive securities.  Total returns for REITS and our MASS Income strategy are strong YTD and getting stronger daily despite the recent weakness in the overall stock market.

Emerging Market and International Bonds

From the traditional bond universe, I especially like the setup and attractiveness of emerging markets and international bonds now.  These are paying higher rates than US Treasury bonds by 1-2% and are currently riding a wave of contractionary economic inputs.  Most foreign central banks are far ahead of the US in terms of cutting rates in response to their own weakening economies. You might also know that the US has the highest level of public debt and the largest fiscal deficit of any country in the world.  Honestly, it’s not a great backdrop for owning US treasuries.  If you must own US Treasuries, there is no need to own anything beyond a 10-year maturity, and even this is probably just a trade, not a long-term investment.

At the same time, the US dollar is now getting weaker than most other foreign currencies, especially the Japanese YEN.  A falling US dollar provides an additional currency boost to any form of investment overseas, so we are seeing international and emerging market bonds move strongly higher with almost no daily or weekly volatility.  12-month total returns for international bonds are now up quietly over 10% and almost 15% for emerging market bonds.  Compare this to a CD or money market fund earning less than 5% now, and you get the point.

Municipal Bonds

              Munis offer a very compelling alternative to cash and US Treasuries, and they come in tax-free or taxable forms.  Taxable Muni bonds generally offer annual interest rates that are about 2% higher than tax-free options.  Tax-free Munis should be used in your taxable brokerage accounts and are especially attractive for high-income earners paying tax in the 30-35% bracket.  The All Season Freeway High Income Strategy has an 80% allocation to high-yield, tax-free municipal bond funds, ETFs, and Closed-End Funds, which offer annual tax-free income of 4-6%.  For high-income earners, that equates to an after-tax yield of 5.40 – 8.10%.  My personal view is that income tax rates for high-income households are going to rise dramatically in the coming years regardless of who is in office, given our current Federal Debt and $2 Trillion Budget Deficit.  There is just no way around it. Tax-free Muni bonds are launching off a multi-year low in price and paying high tax-free yields as we head into this environment.  Win, Win, Win.  The All Season Freeway High-Income strategy is our best-of-class strategy in this space.

Taxable municipal bond funds are also in a sweet spot.  To be clear, interest paid is taxable in these securities and, therefore, appropriate for lower-income investors or even retirement accounts.  Investments are made in municipal and state securities rather than federal ones, but I’m seeing some very attractive yields in this space that are far above those offered among federal bonds.  I’m watching two funds now that are paying 7.32% and 8.3%.  Amazing!  Please note that taxable municipal bonds have about the same price volatility as a traditional long-term US Treasury bond, but at least you’re getting paid for it.


Utilities

I want to offer a special shout-out to Utilities even though, as a sector, they are already one of the best-performing sectors in the market and clearly overbought in the short term.  First, utilities are interest-sensitive and fit the task of finding new opportunities in this new Stage of the Business cycle.  Second, utility rates are rising, and our dependence on a stable electrical grid may be the highest in modern history.  Think about the whole AI frenzy and the demands for electricity from new data centers and server farms.  Think about the transition to EVs and the electrification of HVAC through Heat pumps in residential and commercial buildings.  Finally, think about how little we have invested in grid infrastructure and capacity in the last two decades.  Wrapping it all up, we see and know that utilities and grid services are going to be the epicenter of several major innovation themes for the foreseeable future. Utilities are not nice, but they are essential, and we will pay whatever price is charged for this essential service.  Their pricing is perfectly inelastic in economic terms.  So, dear investor, if you are looking for a sector that is more than recession-resistant and probably orienting more towards a growth industry like waste management a few years ago, think about utilities.  Did I also mention they pay 4-6% in annual dividends?  Please be patient with Utilities now, as they are way overbought in the short term.  Buy pullbacks – as usual.

Final Note on THIS Business Cycle

Every stage of the business cycle has a different length of time and is subject to different structural inputs.  Regular readers know my opinions regarding sticky inflation in this particular economic cycle.  Today, the first wave of inflation is in decline, but there are no long-term structural issues in play that are likely to keep inflation higher than desired, with the real potential for second and third-inflationary waves in the next 5-7 years.  These structural inflationary issues are:

  • Climate change adaptation
  • Nationalism and reshoring of manufacturing
  • Geopolitical conflict and wars
  • Retiring baby boomers lead to higher labor costs
  • Shortages in housing stock
  • Shortages in raw commodities
  • Mandatory infrastructure spending
  • Absurd levels of US federal debt and deficit spending

All said, it is likely that our visit to the interest sensitive side of the market, may be just that, a visit.  I see strong evidence that the business cycle will see a compressed Stage 1 environment where we own all the above, but we could find ourselves right back into the inflation beneficiaries before long.    Let’s keep our eyes and ears open to what the market and data are telling us.  Stay tuned!

I’ll leave it there for now.  I hope to have given you a few ideas and got you thinking about changes that can and should happen in response to our current position in the business cycle.  This is our specialty, what we do for our clients, and the very namesake of our firm, All Season Financial Advisors.

I hope everyone is enjoying the early fall, my very favorite time of year.

Regards to all


Sam Jones

Next Gen Real Estate Playbook

8/15/2024

I’m going to get myself in trouble with my real estate friends and family with this post.  The question, and maybe the greatest concern for anyone under 30 years old, is this: How will I ever be able to afford to buy my own home?  I’m going to take a stab at a playbook of sorts for this young age group, including facts and current trends, as well as some suggestions.  If you play your cards right, you will own a home that is affordable for you as long as you are disciplined about your financial habits over the next 5-7 years.

The American Dream Will Be Yours… Later

My very high-level advice is the same as it has been for the last two years.  Let the real estate market come to you on your terms.  Avoid the temptation to chase prices or buy anything now and lean into renting for as long as necessary.  Okay, but why?

Let’s get rid of a little FOMO first by reviewing a few facts.

*I would encourage you to do your own research and listen to independent sources who track real trends and real data.  (CalculatedRisk.com Altos Research or Top of Mind podcast, to name a few).

  • Real estate prices peaked in November of 2023 and have been falling since then, with few exceptions. 47 of 50 states are seeing prices fall year over year.
  • The supply of single-family homes is up 40% year over year and is rising. The current inventory of unsold homes is 667,000, which is still below pre-pandemic levels but will be there in short order. Prices are falling because inventories are rising while mortgage rates still hover at 6.5%.  The sales pitch that prices won’t fall because inventory will remain low is simply not playing out.
  • Real estate trends are local, yes. Luxury resort communities are dominated by economically insensitive buyers, so normal market mechanics are skewed.  But I’m speaking to the next-gen, who are clearly not looking to pay all cash for a luxury home, right?
  • The total cost of ownership (TCO), which I have spoken about at length, has been rising nearly 20% annually since 2022 (Taxes, insurance, utilities, maintenance). Take a look at the chart below.  73% of TCO falls into Mortgage servicing costs (principal, interest, taxes, and insurance), maintenance, and renovations.  By owning a home, you naturally accept responsibility for these two GIANT costs that come with home ownership.  Remember, both slices of the pie already represent 73% of total ownership, and they are both rising.

The Alternative of Renting

After nearly three decades of real estate prices rising on the back of nothing other than three decades of falling interest rates, we have all been emotionally conditioned to believe that owning real estate is THE means of building exponential wealth.  We literally call home ownership The American Dream.  Kudos to the marketing machines for branding that dream with homeownership.   The next generation has witnessed their parents’ experience accumulating real wealth by way of real estate, often living in very nice family homes or visiting the family vacation property.   The suggestion that we need to own real estate is compelling and overwhelming if one is looking backward.  Not owning real estate is seen as a failure.  I am empathetic to the Next Gen, who must just be tortured by the hard reality that the American Dream is factually not for them, or certainly out of reach for all but a few.  The hard truth is that Baby Boomers and Gen Xers like me have effectively pulled forward real estate returns from future generations and put them in our pockets.  We have done so by pressuring the Federal Reserve to keep rates artificially and unnaturally low for far too long. Do you think Jerome Powell feels a little pressure to drop interest rates now – again?  You are witnessing “pressure” in real time if you pay attention to the news.

I’m still going to offer a playbook towards ownership, so stick with me.

Renting a home or shelter of any sort feels bad, or so we are told.

“I’m just throwing my money away”

“I’m paying someone else’s mortgage, and they are getting rich on me”

In our Next Generation research this summer conducted by our intern, PJ Shaw, she discovered that owning a home is a top financial priority for Millennials and Gen Z.  I fear that it’s going to take years and years of real estate being recognized as an unproductive and costly financial asset before this embedded psychology breaks.  We’re in year two.

I will reiterate a bold prediction now.

Hard asset real estate (including TCO) will continue to be the worst-performing asset class in the next decade.  You can etch that “quote” on my gravestone as long as you include the date, November of 2023😊

Performance is always relative, mind you.  Real estate prices don’t need to fall dramatically, but they are very likely to lag almost every other asset class and continue to be “dead money” as prices inevitably retrace back to their historical return trend of inflation (see below)

Ok, back to the argument about renting

A few facts:

  • 8 million “units” were purchased since 2011 as investment properties (aka rentals, many of which are now short-term rentals by way of Airbnb).
  • Rents are now falling year over year, not by much, but the data shows that rental rates peaked around April of 2023.

The Playbook

              First, get yourself in the right mind frame.  There is no shame in renting now.  In fact, it seems pretty clear that this is a smart place to be considering the rising and unaffordable costs of home ownership versus the falling costs of renting.  The trend is your friend!

Second, understand that the main reason why real estate perceptibly seems like such a winning investment is that paying a mortgage is a form of forced savings.  Also, understand that most good Americans are not very good about their saving and investing habits unless they are forced to do so (aka paying a mortgage).  If you think about it, paying a mortgage is exactly the same as saving a reasonable chunk of your income and investing it in equity (home equity).  And if you fail to pay your mortgage, there are consequences like foreclosure and nastygrams from your lender.

Now consider this option as a renter.

Take any money you would have put toward a down payment on a house, invest it, and get yourself on a forced savings plan to contribute to that account every month for the next 5-7 years as if you were paying a mortgage plus carrying costs!

Here’s a real example

A typical mortgage payment for a 2-bedroom house in Colorado with principle, interest, taxes, and insurance is now a little over $4000/ month (assuming a $500k mortgage at 6.5% on a 30-year fixed).  Now add the average annual additional costs of ownership, which are conservatively estimated at $800-$1200/ year.  But you are still paying rent, which will run about $3000/ month for the same two-bedroom place in Denver.

Ownership costs

$4000 + $100 ($1,200 annually) = $4100/ month

Renting costs

$3000/ month

Difference

$1,100/ month

Can you save and invest the difference of $1,066 – $1,100/ month? 

Do you have the discipline and income to support this forced savings plan beyond your rental costs? 

Do you think you will have more or less money at the end of 7 years to put down on a house?  You will have more, much more. 

Of course, the greatest threat to this plan is that real estate prices will increase and go parabolic without you.  Considering today, we are already at a 40-year high of unaffordability based on current real incomes, prices, and mortgage rates, that would be a very low probability event.

Other Good ideas:

  • Look to lease a home that you might want to own (lease to own!) Current owners will love to keep their super-low 3% mortgages and lease to you as a potential buyer, applying your cumulative lease payments to the eventual purchase price when you have enough money to buy the place.  If rates don’t come down substantially soon, this will become a thing, just like the 70s and 80s.


  • If you must buy now, do buy the ugliest house in a good or emerging neighborhood. Use the next 5-7 years to incrementally improve the property while prices fall.  Building sweet equity is never a bad thing, especially now.

I’ll leave it there for today.  Please don’t hate on the facts if you disagree; just do your own research and feel free to challenge any of the above with a good set of evidence.  For the next-gen, we want you to have the opportunity to own assets, put your stake in the ground, and build your own wealth.  You have incredible opportunities today and will have an opportunity to own your own home, but it will probably be later in your life than you might expect.

Best of luck to all. We’re here for you!

Sam Jones

We Are On the Move

August 5, 2024 

Dynamic Asset Allocation is, and has been, our investment specialty since inception.  It shapes the very name of our firm, as we manage assets for “All Seasons” of the financial markets.  In July, we spoke of the profound and immediate need to diversify (https://allseasonfunds.com/why-diversify/ ) as investors, in mass, are still far too concentrated in mega-cap technology and proxy index funds like the S&P 500.   That proved to be timely advice as mega-cap technology is now leading the markets lower into a “surprising” correction.  It’s not surprising to us in the least!  Since 2022, we haven’t had reason or evidence enough to make significant changes in our dynamic asset allocation strategies.  Now we do.  We’re on the move, setting our new allocations for the next cycle in the economy and the stock market.

Angling Toward Recession

No doubt you have heard ad nauseam how big tech is the only game in town.  More broadly, investors have been drawn into large-cap growth stocks at the expense of nearly all other asset classes for the better part of the last 4 years.  Money chases performance, and to be fair, performance outside of large-cap stocks has been poor to terrible.  But in the process, the collective “we” of investors has seen their portfolios migrate, by choice, into a more concentrated and bloated allocation to stocks.  I believe July will mark the top of the market cycle for large-cap growth stocks, and this period is already being tagged as the “Great Rotation!”  *The media loves that word, don’t they?  The GREAT Financial Crisis (2008), the GREAT Resignation (2021) and now the GREAT Rotation (2024).  Silly.  The rotation of which they speak is not just TO one thing but TO all things outside of large-cap growth.  For instance, in July, we saw a long overdue bounce in small caps, value, dividend payers, gold, and most notably, all things interest-sensitive like bonds, utilities, and real estate.  We also saw the recession trades receive a great deal of buying enthusiasm, including healthcare and consumer staples – all at the expense of your favorite large-cap growth names like Amazon, Nvidia, Google, and the S&P 500.  As you might have guessed from the July update, we have been moving to a more defensive and diversified orientation in our dynamic asset allocation strategies since April, and this includes rebuilding our bond and income allocations for the first time in nearly four years.  What’s going on?  I’m glad you asked!

High-quality bonds, including investment grade corporates and municipal bonds, are an asset class that serves as our guide for future economic growth or contractions.  They say bond money is smart money, and that is true.   Since the final price peak in April 2020, bonds have been pricing in very high inflation and an expanding economy.  And now, four years later, in April of 2024, Bonds bottomed and began pricing in an economic contraction (aka a pending recession).  Yes, that’s right ladies and gentlemen, the bond market has been telling us clearly since April that the US economy is weakening, employment conditions are softer, and inflation is back to pre-pandemic levels.   From the market side, we are seeing softer absolute corporate earnings to match despite the fact that they are still marginally beating lower expectations.

This is all a nice healthy macro econ word salad, so let me break it down for you.  We are heading toward a recession.  Regular readers know, based on our study of lag times after rate hike cycles, that June of 2024 was the most likely month to see a top in the stock market with a recession headline in January of 2025.  Markets typically peak out ~340 days after the last rate hike.  The last rate hike was in July of 2023, so we’re right on target if this proves to be a meaningful peak in stocks.      Consequently, it’s time to add bonds back into any diversified investment portfolio.  Of course, we are already well on our way to doing so on behalf of our clients and sit now with a 25% allocation, up from 5% less than a year ago.  Ultimately, we are aiming for a 30-40% allocation as the recession unfolds.    At the same time, as we enter Stage 4 of the business cycle, this is also the time to reduce stock allocations.  Today, we are down to 50% from a high of 75% in May and will reduce that exposure to nearly 40% in the end.  The remainder of our available funds (15-20%) stick to our alternative allocations in low volatility and low correlation securities, including specialty funds, like the Permanent Fund (PRPFX), Berkshire Hathaway (BRKB), and Gold (GLD).  We are on the move, making appropriate and timely changes to keep our clients’ assets invested in the asset classes and securities that offer the best risk-adjusted returns.  This is what we do in our dynamic asset allocation strategies and one of our unique value propositions as a wealth management firm.

The Fed is Late (Again)

              This Federal Reserve tends to be directionally right but woefully late in their changes to monetary policy.  Consider this: The Fed did not raise interest rates until March of 2022 after finally capitulating to the idea that inflation was not transitory at all.  Inflation had already been ripping higher for a full year.    By June of 2022, only 2 months later, inflation actually peaked at 9.1% on CPI.  THEN, they proceeded to raise rates 11 times to 5.50% into September of 2023, even as inflation was falling dramatically.  Amazing.  Now, they sit while the rest of the central banks in the world are already dropping rates sequentially to help support their own flagging economies.  But not here, not in the US.  We’re going to wait until it’s too late (again).    For reference, inflation today is at the same level as in June of 2018.  The Federal Fund interest rate then was 2.25%.  Today, we are at 5.50%.  Late!  Tardy!  Again!  What’s the point?  The point is that the Federal Reserve is now going to have to cut rates more aggressively in a short period of time to get back in sync with current inflation as well as the real recessionary pressure that rolls in with every report (manufacturing, unemployment, retail sales, you name it).

Again, this is one more reason to rebuild your bond allocations now before the next September meeting.  I am already hearing that the bond market has already priced in a rate cut.  Bunk.  The bond market is just now responding to a pending recession with 225 interest rates points of runway.  Intermediate term bonds can move up 30-40% in price if rates were to fall that much.

The other point is that this Federal Reserve is adding volatility to your life, your mortgage options, the real estate market, and your investment portfolio.  I can only hope that Powell will be replaced by the next administration.  He should not be replaced on the basis of a recession; after all, these are regular and necessary events.  But talk about unforced errors!  The bond market clearly thinks we’re going to be in recession rather soon; Powell says we will have a soft landing.  I’ll stick with the bond market prediction, thank you very much.    Remember, an economic recession is just another market condition, not the end of the world.  Quite the opposite.  The recession brings new and outsized opportunities for stocks, new company creation, and some long-overdue changes in market leadership.

Cash Considerations

I’ve had a lot of discussions with clients about their cash holdings in the last several weeks.  This is a great time to consider your options.  Today, there is a lot of cash, deposits, and CDs, as measured by M2.  Here’s a chart.  You can see the jump of $7 trillion during the Covid years, which has yet to be absorbed (or lost or inflated away).  Yes, that number is in Billions, so we’re talking about $20 Trillion in cash-earning interest largely paid by the US Government.

This is a tremendous amount of cash in aggregate, but you have to understand that this pile is not equally distributed. As of June, $4.11 Trillion of the total was held by corporations alone.  The rest is spread across money market funds, bank deposits, CDs and actual cash held by 100’s of millions of individuals, small businesses and non-profits.

Here are some important ramifications.

The interest earned on your cash is going to begin to drop in September.  How fast?  As fast as the Fed drops rates for all but fixed rate instruments like CDs.  I suspect, they may drop rates as much as .50% in September with one or two more rate drops in 2024.  Trust me they are highly motivated if you consider the next chart.

The US has the largest public debt net interest payment as a percentage of GDP in the World.  A Dubious honor and one that will drive the US dollar lower until this is resolved (Take Note!).  A falling US dollar provides a strong tailwind for Gold, foreign currencies and international investments.  Perhaps these should be on your shopping list for your cash?

There is nothing wrong with keeping your cash in something earning 5% or even less, especially if the economy is slipping into recession.  But, if trends continue, you will get a much better bang for your buck in any of these interest-sensitive sectors of the financial markets.  These include:

Real Estate funds and REITS

Mortgage-backed securities

Intermediate-term Treasury Bonds

International sovereign Bonds

Investment Grade Corporate Bonds

Utilities

Dividend-paying stocks

Today, all of the above are paying interest and dividend rates that are competitive with cash but now offer real price appreciation as well.  Your basic Core US Aggregate Bond ETF (AGG) is now earning an annualize rate of total return (interest plus price gains) of 22% since April.  The new bull market in bonds has just begun.  Cash can be used to buy into the interest sensitive sectors now.

Cash can also pay down high-interest loans and mortgages, specifically those loans with rates higher than 5%!  I’m always a little shocked to see people sit with oversized cash in the bank earning 5% while carrying a credit card balance that accrues interest at 25%, a mortgage at 7%, a car loan at 8%, or student loans at 7%.  What a great time to pay down some high-interest debt if it makes sense.

Cash can buy stocks as well, but I would be very slow and methodical with this plan.  Volatility has been sharply on the rise since mid-July, and with elections pending in November, I wouldn’t be in a hurry.  At the same time, there are deeply discounted opportunities right now in select stocks.   You might revisit our 40% Off Rack Part I and Part II discussions for some ideas.  Again, the best deals are not in tech or semiconductors (yet) but in stocks currently trading at 12-year lows, paying huge dividends, many of which operate outside the US.  We’re here to help and have investment strategies that focus purely on value, multi-asset Income, and risk-managed solutions.  Please call us if you need help.

I’ll leave it there for this month.  There are very suddenly a lot of new opportunities, risks, and reasons to make changes to your investments.  We’re doing so for our clients, so rest easy and know that you are in good hands.


Things I’m grateful for in August:

Water– phew hot!

Summer Olympics – including surfing, women’s soccer, and handball

Kris, John, Matthew, and our awesome team of wealth partners Kristi, Dan, Dustin, and Scott

Quality time with my two boys’ home from college

Sarah, my wife of 31 years who is simply amazing always, a willing adventurer, family cheerleader, and my best friend.


Cheers

Sam Jones

Why Diversify

July 01, 2024

This seems like an obvious place and time to revisit one of the very basic rules and tenets of investing.  To start the new quarter, I’m going to reach back into the Investing 101 textbooks and unpack several issues and realities behind diversification.  Why must we stay diversified?  What does diversification look like today? And what is the hardest part of owning a diversified portfolio?  Diversification and discipline are cornerstones of successful investing for the long term, but the 1st half of 2024 has been anything but rewarding for such good behavior.  I have little doubt that diversification will matter a great deal again in the 2nd half.

Why Diversify Our Investments?

I’m sure any high school student could answer this question easily.  The answer is to avoid the risk of intolerable and, in most cases, unrecoverable losses that tend to come with a highly concentrated portfolio.  Today, it is common to see portfolios that are highly concentrated in a few mega-cap technology names like Amazon, Apple, Google, TSLA, Microsoft, or Nvidia.  This concentration has happened almost purely through growth and compounding over the last 4-5 years.   Now, it seems that most are also aware that the S&P 500 index has subsequently become a large-cap growth fund as less than 4 names account for 45% of the capitalization weight of the index.  Nvidia (NVDA), the new icon of the artificial intelligence megatrend, is the world’s largest company by market cap, now exceeding $3 Trillion in “value.”   Nvidia, by itself, is largely driving the daily price trend of most large-cap funds and indexes.  In client meetings with individuals who are still working for public companies, it is also common to see enormous, concentrated positions in company stock that have been granted as Restricted Stock Awards (Units) or Stock Options.  The compensation cycle has shifted quickly and quietly back to share-based compensation packages that are quite gracious.  This is a good thing in terms of wealth accumulation quickly, but make no mistake, these situations also lead to a high concentration in just one stock.

Having a portfolio that is highly concentrated in stock or even a few stocks that experience exponential gains year after year can be a life-changing event, but only if prudently managed with a net of tax considerations.  Warren Buffet notoriously leans into the concentration of assets as a means of generating outsized gains over time.    But Buffett and Berkshire Hathaway have something that most don’t, and that is billions in cash sitting on the sidelines, ready to deploy as opportunities present themselves.  Buffett also has extraordinary staying power, patience, and a willingness to stick with a stock that is down 40-50 or 60% and wait for a decade for that stock to recover (as long as it’s paying a healthy dividend).  But Buffett and Berkshire Hathaway are not like the rest of us.  He (they) has very deep pockets and a risk capacity that rivals a sovereign nation or something that is multigenerational.

For most of us humans, living with a concentrated stock position is great on the way up but almost impossible to carry when the price trend becomes adverse, and we see our portfolios get cut in half or more.  The hard fact is that most humans simply cannot psychologically tolerate the deep losses and eventually they sell after that concentrated stock position is down 70-90%.

The darlings of today have all experienced losses of that magnitude.  Consider these drawdowns over time in some of the big names of today:

  • From 2000-2002, Amazon (AMZN) lost -92% and did not make a new high for over 10 years.
  • In 2001 alone, Nvidia (NVDA), lost -86%, the stock recovered back to the highs by 2007 and then lost -84% again. NVDA did not make an all time new high until mid-2016.
  • Tesla (TSLA) stock has been in a steep decline since the last peak in November of 2021. At the lows the price was down -70% and is still trading near the lows.
  • Bitcoin and most of the cryptocurrency space have complete wipeout type losses every 2-3 years (see below courtesy of Bespoke Institutional)

These are intolerable losses for almost every retail investor.  We say and think we can stick with a name that we love through bear market losses because we build loyalty to names that have rewarded us in the past.  But the hard fact, confirmed by heavy selling volumes at the lows, is that most simply can’t watch their net worth evaporate day after day after day without ultimately capitulating.  So, the concentration of wealth in a non-diversified portfolio feels like a blessing on paper, but for many, it regularly becomes an emotional and financial curse in practice.

What Does Diversification Look Like Today

Honestly, a well-diversified portfolio today feels relatively bad, judging from the first 6 months of 2024.  Diversification and discipline have been a recipe for underperformance and lackluster returns.  A highly concentrated portfolio of technology stocks or simply owning the Nasdaq 100 (QQQ) has been a winner.   So, what does a well-diversified portfolio look like today?

To answer the question, we need to understand the ingredients of diversification.  By definition, we need to own things that are not alike or, more specifically, do not behave the same at the same time. In the investing world, we call this non-correlation.  When two asset classes move inversely with each other, they are said to have a negative correlation.  When they move together,  they are said to be positively correlated.  Correlation is measured on a scale of +1 to -1.  Zero (0) correlation is also diversification, meaning there is simply no correlation between securities.  So, when we seek true diversification, we need to take care of owning a pool of investments that are non-correlated to each other first and second. We want to own different asset classes that might not be correlated to the US stock market.  Historically, prior to the end of 2021, we had safe and trusty US Treasury Bonds as the go-to asset class for near-perfect diversification to stocks.  Prior to 2021, when stocks fell, bonds would rise.  This condition lasted for years, consistently giving birth to the magic of the 60% (stock)/ 40% (bond) portfolio, which earned outsized risk-adjusted returns.

But those days are over until further notice.

Now, bonds and stocks are positively correlated and have become even more highly correlated in recent months.  Since late 2021, stocks and bonds have fallen and risen together day to day, offering little to no diversification benefit either in returns or downside volatility control.  Bonds are a real problem asset class as intermediate-term Treasuries have lost nearly 5.5% annually on average since late 2021.  Long-term Treasury bonds have lost 15% annually on average over the same period.  Nevertheless, the timing of price moves between stocks and bonds remains highly correlated.

So, where might we look to find true non-correlated diversification?

Gold bullion (GLD) continues to serve its role as near perfect diversifier against stock holdings. Here are a few stats for you to consider.

Since the inception of the Gold bullion ETF (GLD), on Jan 28th of, 2005:

Average annual returns:              +8.69%  (S&P 500 index has produced 8.28% comparatively)

Correlation to the S&P 500 index:

Since inception              0.11

Last 5 years                     0.25

Last 3 years                     0.16

Last 12 months              0.15

Looking at these numbers, critical thinkers could reasonably say that owning GLD in combination with and S&P 500 Index fund,  enhances returns and reduces risk substantially.

Other investment options that could be considered in a portfolio seeking diversification are currency-related investments.   These include the US dollar.  Here, we want to be very careful and tread lightly with position sizes, and I am intentionally not offering any security symbols to avoid any notion of “advice” surrounding currency holdings.  But again, looking at the statistics, the US Dollar is less correlation to the US Stock market than US Treasuries and offers investors a positive average return.

Finally, there are specialty ETFs that are tactically managed, as well as true old school stock picking managed mutual funds that have been quietly keeping pace with the US stock market with very low correlation to any of the benchmark indices.  Our clients invested in the “All Season” strategy might recognize exemplary names like.

Third Avenue Value (TAFVX)

Berkshire Hathaway (BRKB)

Permanent Fund (PRPFX)

JP Morgan Equity Premium (JEPI)

Pacer US Cash Cows (COWZ)

I have heard the media talking about why the S&P 500 is a diversified index.  This is simply false information.  The S&P 500 is controlled by 4 stocks (see above).  In 2022, the S&P 500 fell more than 25% in the first three quarters, weighed down by losses in mega-cap technology, while more broadly weighted indexes fell only 6-7% over the same time period.   The S&P 500 should be called the S&P 4 and is purely a non-diversified growth index by the nature of its cap-weighted construction.  For the record, I am concerned that so many investors have accumulated a highly concentrated position in the S&P 500 through basic index fund investing and believe that they are diversified and somewhat protected from downside losses.   The next down cycle for the S&P 500 will be larger than 25% with little doubt.  My advice to any and all is to consider your personal weight to this index now and have an honest conversation with yourself about your tolerance for portfolio losses in light of your personal financial planning, cash flow needs, age, and goals.

The Hardest Part of Diversification

              As always, behavioral economics is the weakest link in the chain of any investment experience.  In a perfect world, all of our investments would move consistently higher every year, and we would never experience losses.  Of course, this never happens, certainly not within any 20-year period of time.    They say that short-term volatility is the price we pay for long-term returns, and that is certainly a fact.  Something in your well-diversified portfolio will always underperform or even be held at a loss.  Conversationally, I hear a lot of questions from friends, family, and clients, and they regularly surround an investment that is “not doing well.”

Should I just get rid of it?

Should I hold? And how long should I stick it out?

What do you think I should do with XYZ?

What you hear in these questions is anxiety about holding an investment that is not generating an expected return, usually over a relatively short period of time.

I have a couple of things to share that might help with this type of anxiety.

  1. If you have something in your investment portfolio (A strategy, security, an asset class) that is underperforming or even held at a loss, this is likely to be your best performer in the next cycle.  Market leadership changes every 18-24 months.  Investments that perform well in different cycles are evidence of good diversification.  Congratulations!  Stick with it!
  2. Positive returns come with time. I’ll leave you with this chart regarding the probability of returns offered by First Trust


              Investments held beyond 3 years have a very high probably (87.3%) of generating positive returns.  This stat does not speak to magnitude because a 1% total return is a still a positive return, but it does highlight the importance of patience and a long-term view.  This logic and statistics apply to almost all types of investments in my experience including stocks, bonds, gold, commodities, real estate, etc.

In the first 6 months of 2024, returns for things like pure value, speculative growth, bonds, dividend payers, interest-sensitive securities, emerging markets, Europe, China, or any form of risk-managed investment strategies have been underwhelming.  In the next cycle, these could be the market leaders.  Time is your friend; impatience is your enemy.  As we head into the summer months in a pre-election year, this is a critically important moment to seek true diversification in your holdings.

As always, we are here to help with any of your non-managed accounts or portfolios.

Thank you to all of our clients for your continued trust and confidence our firm. We look forward to serving you as your trusted advisor.

Sincerely,

Sam Jones

President, All Season Financial Advisors.

The Wows and Woes of Wealth Concentration

May 20, 2024

I’ve been short on words for the last couple of weeks. There is not much to say, really, as nothing—literally nothing—has changed since early April. But there is one topic that lives with me constantly, like a cold that just won’t go away. That topic is wealth concentration and how it seems to be the root of our current discontent on many levels.

Stock Market Concentration

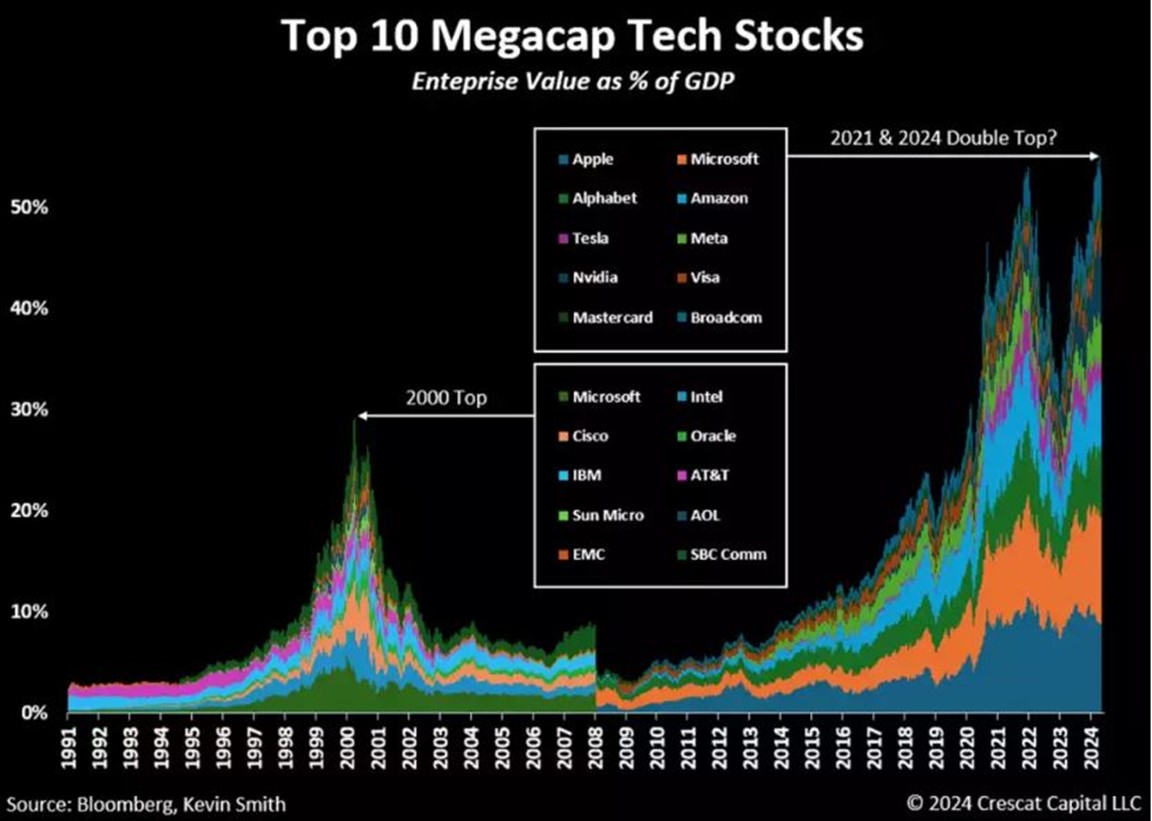
The concentration of enterprise value (EV) as a percentage of GDP among the top 10 stocks in the US is something we have lived with since late 2021.  Today, we have reached a double top with the 2021 level at 55% of GDP.  WOW!   If you just stop for a second to think about that, it will become more and more shocking.

The chart above shows the history of EV concentration, with a notable spike in 2000.  Comparing the list of top 10 names in 2000 to the list today, we see one notable standout that has survived both cycles: Microsoft (MSFT).   You might also note that EMC, Sun Microsystems, AOL, and SBC Communications no longer exist despite their inclusion in the top 10 companies just 24 years ago.  I watched them all get huge and then, one by one, fall into irrelevance.

If history repeats, can you pick which four companies in the current top 10 list will likely be gone in the next 20 years?  Which companies have a true wide moat against competition, regulation, and irrelevance if we squint into the distance?

I know my answers, but I’ll hold my tongue to avoid tongue-lashing from the tech loyalists out there.  However, the most important point of the chart above (courtesy of Crescat Capital) is that the concentration of enterprise value into the hands of just a few names has never represented 55% of GDP.  We are making records.   Let’s pick that statistic apart to genuinely understand why historical periods of concentration are highly significant.

What is Enterprise Value?

Enterprise value is by definition, the market capitalization of a company (Shares outstanding x current price) plus its short and long-term debt.  In a way, EV is an all-encompassing number showing the raw scale of a public company and how much financial power it carries day to day.  To reach a big number, a company has to have issued many millions of shares, which are owned by many millions of investors who have bid the price of all of these shares up and up and up over time.  These same companies might also have issued corporate debt, which is held by millions of investors plus endowments and institutions.  EV is a measure of the total financialization of a public company, which may or may not reflect the underlying earnings of the company.  Let’s be clear that financial power can be an enormous wealth creator as well as a wealth destroyer.  Now, the EV of any company can be compared to its peer group or another sector or, in this case, the entire annual Gross Domestic Product (GDP) of the United States expressed as a percentage.  When we look at the chart above, we are essentially answering this question:

How much control and influence do these top ten companies have over the future of our nation’s economy? The answer is 55%.  I hope you are starting to grasp why this is an issue, perhaps the issue of our current times.

I will now argue that the future of these ten companies is the future of the US economy.   How so? These are just public companies, right? Who cares if they suffer?  Let me pick apart wealth concentration to explain.

Wealth Concentration

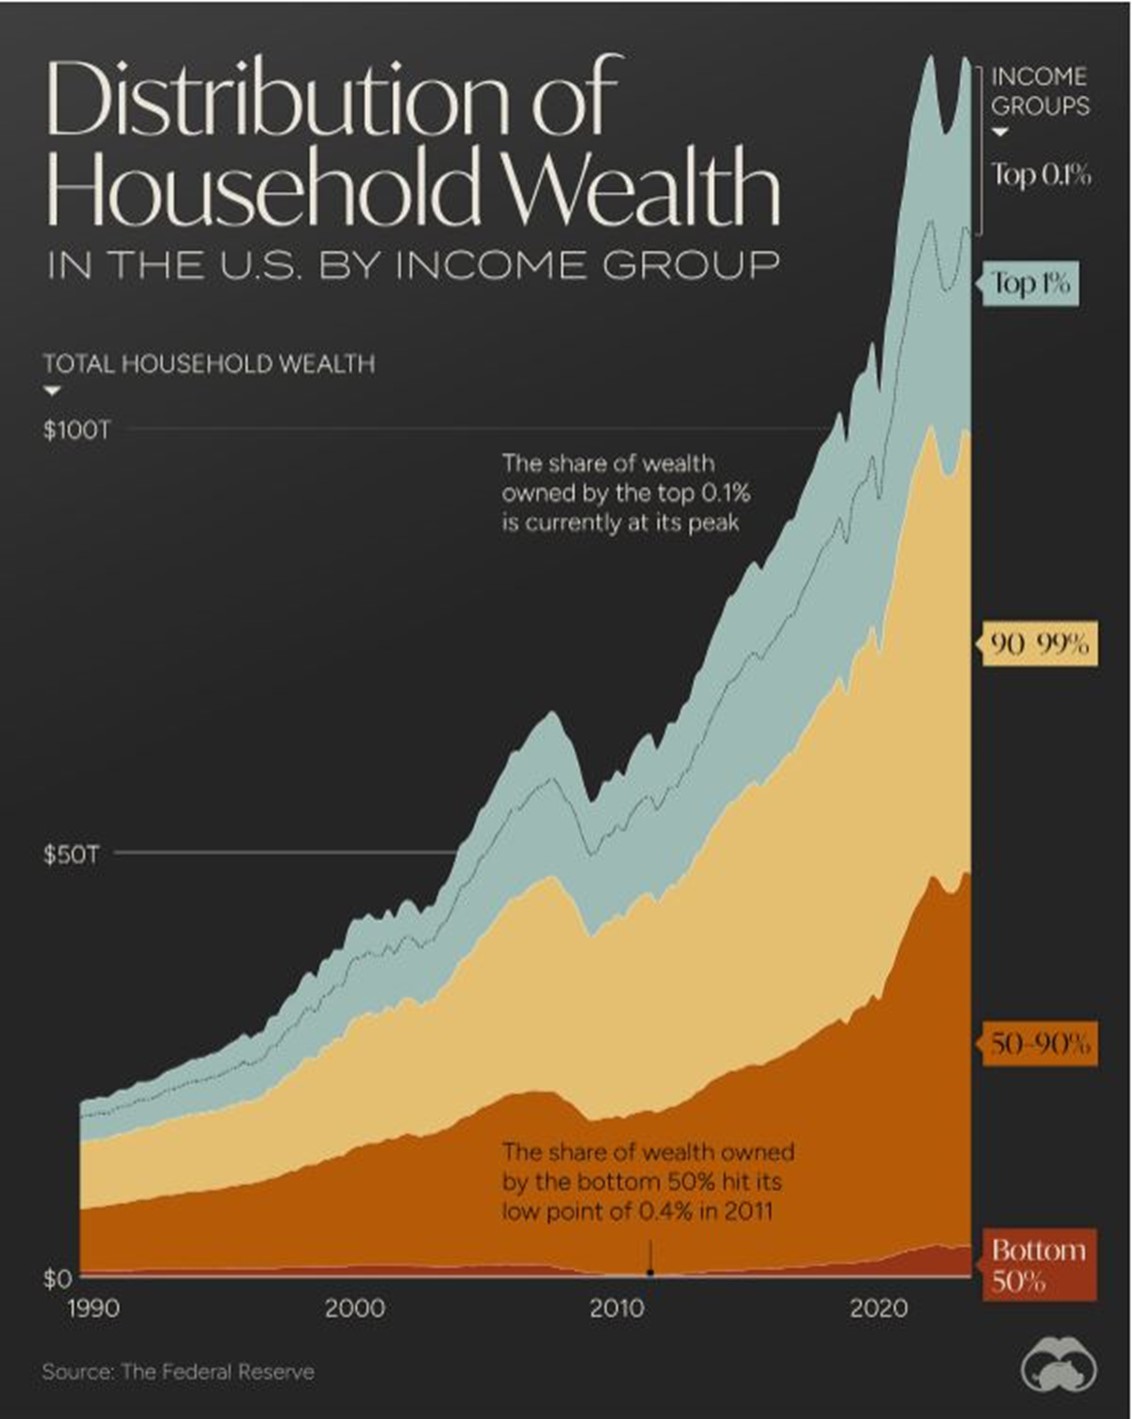
We know that wealth inequality in the US and around the world is at an all-time high. In other words, in the last 30 years, wealth has become highly concentrated, as the chart below shows.

The share of wealth held by the bottom 50% barely registers.  By the eye, it looks like roughly 1/3 of all wealth is owned by 90% of our population.  Then, of course, we see the headline statistic that 1% of “us” carry nearly as much wealth as 90% of the population combined.  Statistically, in July of 2021, we entered a 2nd Gilded Age where the top .01% of our population controls even more than the giants of wealth did at the end of the 1st Gilded Age in 1913.  The legacy names of Rockefeller, Carnegie, JP Morgan, Baker, and Frick were all tied to a monopolistic company’s “financial power.”  Today, we see the same linkage as the enormous wealth of Jeff Bezos (Amazon), Mark Zuckerberg (Meta), and Bill Gates (Microsoft), which are tied to today’s monopolistic companies.

Ok, so what?

What are the implications of Wealth Concentration in our population, which is factually created by the same forces we see playing out in stock market concentration?

Federal Stimulus Concentrates Wealth

              Note in the chart above when wealth concentration in our country took off.  It was actually in the mid 80’s, but the chart only goes back to 1990.  Students of market history might also recognize that this was the same 30 years in which the Federal Reserve, the Treasury, and Congress began more aggressive measures to support our economy and the markets through stimulus, Federal Spending, “Too Big to Fail!”, quantitative easing (QE 1, QE2, QE 3, QE to Infinity!), and Zero Interest Rate Policies (ZIRP) at the Fed.

Since the mid-80s, we have been in an easy money, debt-driven economy, and we have simultaneously seen wealth concentrate to today’s standards over the same period. Easy money, stimulus, and low interest rates favor asset owners, and wealthy people are the greatest owners of assets. The trickle-down theory is 100% bunk.

Spending and inflation Impact “the rest of us” more

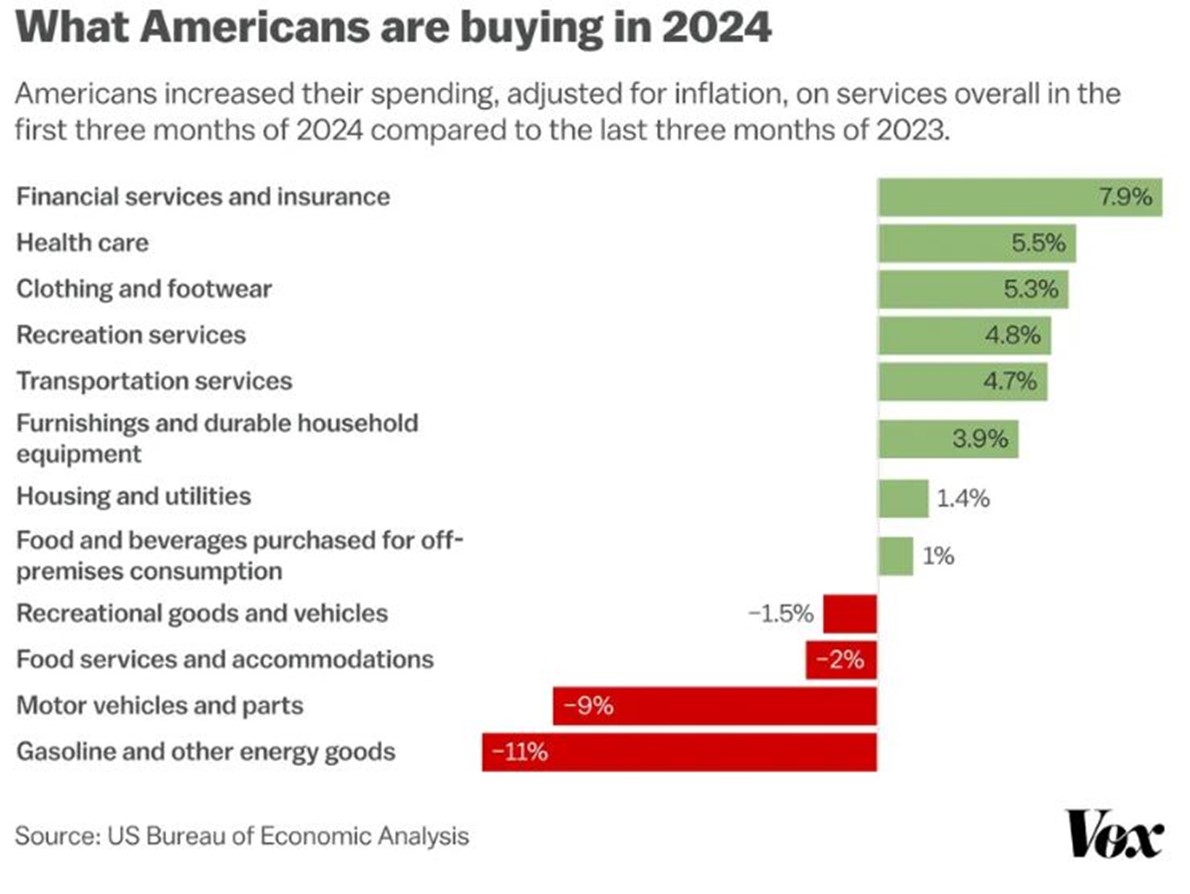
              Vox ran a great article on Spending Trends in 2024 by category this morning.  I helplessly click on these things over morning coffee.  The article discussed current increased spending on services over products, which in general is true, but that’s been going on for about a decade.  It’s just slightly more pronounced in 2024. If we forget the comparison and look only at where we are increasing our spending in 2024, we see the ugly head of inflation.  We are not factually consuming more insurance, healthcare, shoes, or transportation.  It’s just that these items are still experiencing very high increases in costs year over year (aka inflation), and thus, effectively, we need to “increase” our spending by as much as possible to receive the same quantity.

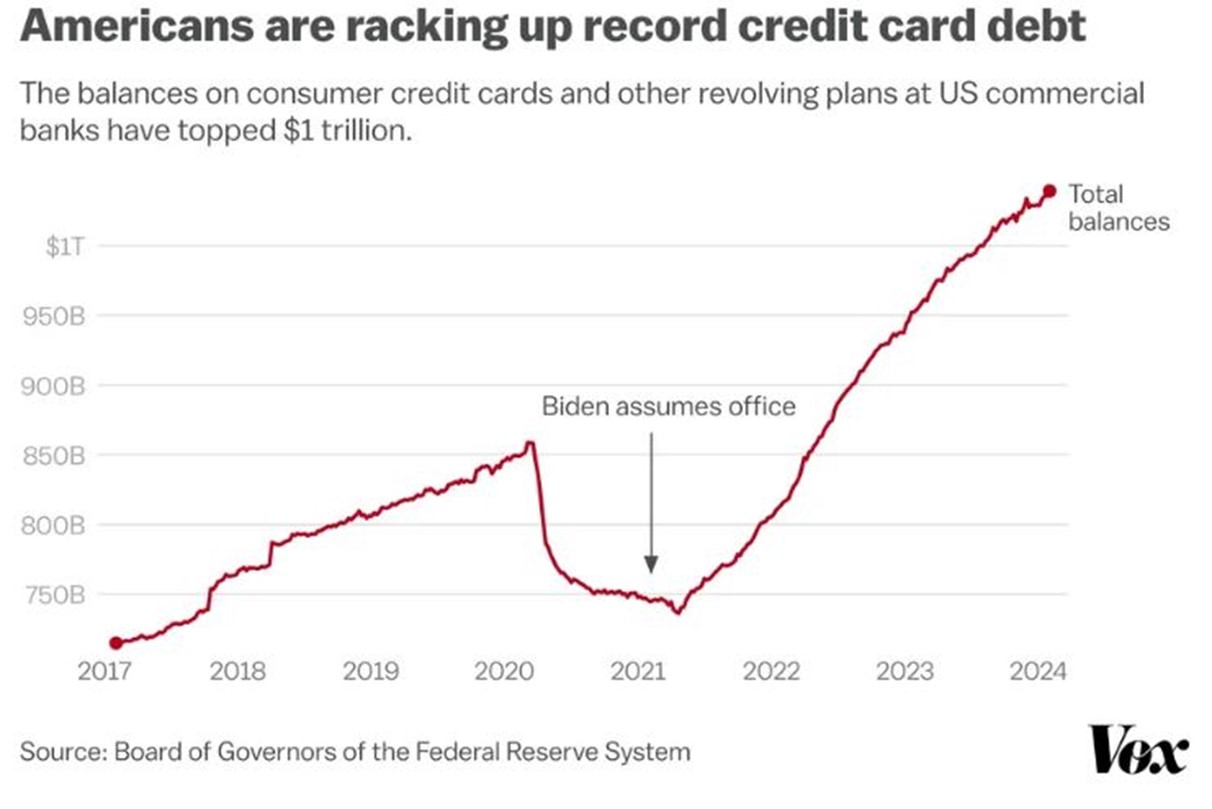
On the other side, you can see demand for discretionary items starting to dry up as we head towards a not-soft landing (wink). Van life is over, obviously.  Restaurants are starting to feel the pressure of fewer customers, car purchases are slowing down, and home buying and furnishing are still hard frozen. I like to observe spending trends because they essentially neutralize the issue of who is spending (and the amount being spent) and instead aggregates where the money is going and what it is being spent on, not just its source.  From this, we get a truer sense of what is happening in the aggregate.  What we know already is that “the rest of us” who do not live among the 10% of wealthiest households are impacted more by inflation.  Obviously, things we need that cost more take a bigger bite out of our monthly paychecks.  Wealthier people are economically insensitive.  So what we see from the chart above represents in full color why so many people in our country feel like they are not participating in an economy that is supposedly growing.  They see the headlines. They see and feel wealth concentration all around them, yet they struggle to pay basic bills.  Ask any young person under 40 how they feel.  Ask anyone in the unskilled service economy.  Ask anyone who is working their butt off in a trade, and they will tell you they are barely hanging on.  And no surprise at all, we are seeing new records in credit card debt now exceeding $1 trillion as households across the country have burned through any savings.

You might note on the chart when Biden took office.  Very unfortunate timing for him, as the US consumer was just consuming the last of their COVID stimulus checks.  Politically, I’ve heard many in the last few weeks wondering why Biden is polling so poorly even while DJT is sitting in the courtroom.  It has nothing to do with his age.  It has everything to do with the chart above.   The “People” want change, and they don’t feel like Biden is that agent despite his efforts to support lower and middle-class citizens with debt relief, child tax credits, bumping minimum wages, supporting unions, fending off Chinese competition, Etc.  Oddly enough,  Biden is probably the most aggressive champion of the unwealthy we have seen in modern history.  If re-elected, he has already promised to seriously work toward wealth redistribution.   Hopefully, he can get that message out clearly before November. I suspect his term, accomplishments, and campaign promises are being overshadowed by bad timing and still sticky inflation.

Let me try to wrap this all up and put a bow on it for you.

Wealth is becoming more and more concentrated in the hands of less than 10% of our population by way of record high concentration in the enterprise value of just a handful of public companies as well as Federal stimulus over the 30 years.  The top 10% of our country own assets like houses, businesses, and a whole lot of stocks.  These two things are inextricably linked.   The stock market will become less concentrated when the top public companies structurally go into decline, and yes, this will happen eventually, just as it has in the past.

The bottom 90% of our country, measured by wealth, are now feeling pinched, and they are going into debt just to keep the lights on.  Inflation is impacting them more.  This will continue to be a trend economically and we should expect to see demand for goods and services continue to dry up in the aggregate as it has since March. 10% of our country cannot keep the entire economy afloat even if they spend extravagantly.

Politically and socially, we are a mess because of all of the above.  Wealth inequality is one of the root causes of political and social polarization today, in my opinion.  Ironically, you need to be a very wealthy person to be in Congress or run for federal office of any sort these days, not to mention the crippling age issues of our incumbents.  How can they represent the common good when our very leaders are part of the wealth inequality problem?  But I digress.  This leads us to the big question.  How do we unwind all of this?  How do we reverse the trends that tear us apart politically, economically, and socially?  You’re going to hate the answer, but it’s the hard truth: A Significant Recession.

So that is what’s on my mind now, and I hope this serves as an explainer of sorts for many of the questions you might have rolling around in your head.

Next update, we’re going to dive back into real estate because there is a new trend emerging that is going to surprise you.

Until next time – thanks for reading!

Sam Jones

Why Copper Plays a Critical Role in Energy Transition 

April 15, 2024

Copper is quickly becoming a critical metal in the transition towards renewable energy and electric vehicle infrastructure. While the industry projects tremendous growth in demand for copper, the supply of copper has faced challenges. Pricing dynamics and improving margins will create new production and opportunities for investors to capitalize on the current imbalance. 

Projected Growth in the Copper Sector 

Recent projections indicate a robust expansion in the copper sector in the coming years. With the increasing adoption of renewable energy technologies such as solar panels, wind turbines, and electric vehicles, the demand for copper is expected to soar. Demand for copper is projected to surge, driven primarily by the rapid growth of renewable energy infrastructure and capacity.   

BloombergNEF, March 2023 

Copper’s Crucial Role in Renewable Energy 

Copper is the lifeblood of the renewable energy revolution and is vital in transmitting, distributing, and storing electricity generated from renewable sources. From conducting electricity in solar panels and wind turbines to facilitating energy storage in batteries, copper is indispensable to the functioning of clean energy systems. This also includes replacing existing inefficient grid infrastructure. The current grid runs inefficiently; according to a report done by Inside Energy, we lose between 2.2 and 13.3% of energy in transmission and distribution. The role copper will play is to enable material upgrades to a more innovative and efficient grid. 

Moreover, as governments worldwide commit to ambitious climate targets and transition towards carbon-neutral economies, the demand for renewable energy technologies is set to skyrocket. This increased adoption of clean energy solutions will further fuel the demand for copper, making it a critical commodity in the fight against climate change. 

Rising Production Likely to Meet Demand for Copper Over Time 

We anticipate that industry leaders will invest in expanding their production capacities and improving operational efficiencies to meet the growing demand for copper. Today, the cost of producing copper ($2.41/ pound) is well below the Spot price ($4.34/ pound), implying an 80% profit margin.  Despite current projections, increasing profit margins will likely spur more excellent production and discoveries across the industry.  See below from Bloomberg New Energy Finance 9/1/2022. 

As such, we believe they are well-positioned to capitalize on the opportunities presented by the burgeoning renewable energy sector. 

Seizing the Opportunity in the New Power Fund 

In light of the projected growth, current supply shortage, and significance of the copper sector in the renewable energy transition, we have added a copper position to our New Power Fund. On March 28th, we added a 4% position in the COPX exchange-traded fund (ETF) to the New Power Fund. This ETF owns some of the world’s most influential public copper mining companies, including Lundin Mining, Southern Copper Corp, Ivanhoe Mines, and Freeport McMoran. In addition, COPX is distinctive because it represents companies enabling a change to renewable energy and upholding ESG (environmental, social, and governance) standards. The addition of COPX represents another step in our reconstruction project with the New Power Fund to double down on climate solutions securities. Investing in copper now presents a timely opportunity to participate and benefit from transitioning towards a cleaner, more sustainable energy future.   

Please feel free to contact us if you are considering an investment in the New Power Fund, which is open to new accounts of $100k or more. 

Regards, 


Cooper Jones 

New Power Fund Analyst  

Cooper Jones analyst

The New Investing Environment

April 10,2024

Life as we know it changed dramatically—socially, politically, and economically—with the global pandemic. Yet, investors have not adapted to many of the new realities created during this time. Frustrations will continue for those waiting, wanting, and hoping for a return to the good ‘ol days when inflation could be tamed with a few simple rate hikes.

Today’s Inflation is a Secular Thing

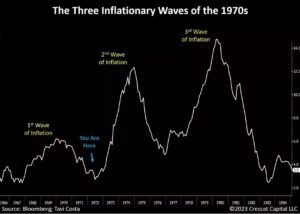
You might take a second to re-read our latest blog post, “Mission Accomplished” which was posted on January 22nd.  In that post, we asked rhetorically if the mission of defeating inflation was indeed “accomplished,” as the Fed and the media seemed to suggest.  Now, four months later, the Federal Reserve is inserting reasonable doubt daily as to their intentions to drop interest rates at all in June considering the recent rash of HIGHER inflationary reports. Today, employment is rising; wages are rising, and household wealth and company revenues are all rising.  To be clear, the US economy is still doing fine in aggregate and especially fine for the very wealthy, who own 89% of all assets in the United States. ( *Seems almost strange to use the word “United” these days, doesn’t it?).  Taylor Swift, as the Time Person of the Year represents peak Consumption and Spending.  And $6 Billion spent chasing a 4-minute view of the total solar eclipse tells me we still have too much money chasing too few goods, The very definition of inflation.  Investors and the financial media are marveling at the fact that the most extensive and shortest period of extreme rate hikes in the history of the Federal Reserve has not caused a recession.  It will eventually!  But today, in true 70’s style, it seems more likely that we are heading towards the next inflation leg higher (see chart below from Crescat Capital).  Investors and the entire real estate industry, who are hoping for a big bond rally (lower rates), could be in for a longer wait.

Unfortunately, a new round of inflation would also be quite bad for stocks as expectations for a continuation of the bull market are squarely relying on lower prices and lower rates. Barrons notoriously pins the tail on the bull with their magazine covers in true contrarian fashion.  2024 is setting up to be the transition year where we see peak spending, consumer and investor confidence, peak earnings and peak economic growth.  In short, not bullish for future stock returns.

Let’s unpack the sources of inflation as evidence that the new environment is here to stay.

We must understand that the sources of inflation today are not something that can be controlled by monetary policy (i.e. lowering interest rates and/or reducing the Federal balance sheet).  Inflation of the type we have now comes from five sources most of which have accumulated over the last three to four decades. They are as follows in no particular order.

  1. Deglobalization and Nationalization Themes

Countries are putting up walls, tariffs, and barriers to trade as a sense of nationalism emerges aimed at labor protection.  This is a relatively new phenomenon that is politically and racially motivated with very little economic basis.  Recent wars over territory and resources are also destabilizing and bad for business.  Deglobalization is inflationary by nature, but thankfully, this is the least sticky of the inflationary sources.  Strong and healthy leadership would reach across borders to find cost efficiencies wherever and whenever.  I was encouraged to see Janet Yellen make a recent trip to Chile to help secure favorable trade with its Lithium producers.  The article is here.

  1. Out of-control Global Fiscal Spending, Stimulus, Debt, and Deficits

Many have described the last 16 years as the most undisciplined period of monetary and fiscal spending in history.  Since 2008, the annual federal budget for spending has increased from a little over $1 Trillion to over $7 Trillion as of last month.  All of this spending has come from borrowing.  Consequently, the level of public debt has also ballooned to over $34 Trillion with net interest payments projected to exceed the total costs of Social Security and Medicare by 2030 and defense spending by 2028.  In plain speak, our Federal Government is spending far more than it receives in tax revenue (called a Deficit) using debt and freshly printed US dollars to fill the gap.  There is no Republican or Democrat willing or able to actually reduce Federal Spending because to do so would threaten over 15% of our country’s GDP!  It’s totally out of control, totally unsustainable, and yes, totally inflationary.

  1. Wages are Permanently Higher

While avoiding the hot political buttons, I think this is a good thing and a long time coming.  Wages have historically not kept pace with underreported increases in the costs of living, and we have now embarked on a journey to find that rare and almost extinct animal called The Livable Wage.  Right or wrong, it’s happening.  California recently increased the minimum wage for fast food workers from $16 to $20/ hour, up from $7/ hr. just 10 years ago. Like it or not, trends in California work their way from west to east over time. Only the poorest states with the highest unemployment rates will keep their non-competitive wages in the years to come.  Eventually, labor will migrate to higher-pay states when a recession hits, but wages will not come down.  It’s important to note that wage increases can stabilize, leading to lower inflation as a rate of change, but make no mistake, this still leaves us with permanently higher costs for all things labor intensive.

  1. Climate Adaptation

We posted a recent article on our New Power Fund page about the rising costs of homeowners’ insurance in areas of the country that are now regularly battered by hurricanes, wildfires, floods, and other “extreme” weather events.  After more than a few years, insurers are now pricing in the true risks or simply dropping coverage altogether.  Here’s the article. Climate change is now being priced into our economy and it ain’t cheap.  Utility costs are up nearly 20% year over year, most of which comes from climate adaptation efforts.  Again, this is not a variable that can be solved by the Federal Reserve lowering interest rates by a few basis points.  This is a lifetime challenge that will bring a lifetime of higher costs.

  1. Commodity and Natural Resource Shortages

Finally, for those of us who have kept a watchful eye on the imbalances between supply of and demand for commodities, we have arrived at a tipping point.  Commodities have notoriously long lead times to pull the raw materials from the earth and craft them into a usable resource for energy, building, infrastructure, technology, transportation, etc.  Today, we have enormous demand for raw materials and energy, but we have also massively underinvested in the production of commodities for the last two decades.  Lowering interest rates will not magically solve the global shortage of raw copper ore for instance.  In recent months, commodities of all types, including oil, base metals, precious metals, rare earth metals, uranium, agriculture, timber, and especially copper, have all shot higher, in many cases out to new highs.  These are input costs for nearly every tangible item in the world and these costs are not yet reflected in any current inflation numbers.  We can also add housing to the list of shortages and of course, persistently high costs of shelter are over 40% of the Consumer Price Index, our inflation index du jour.  Shortages of any sort create inflationary pressure, and more are on the way from commodities.

All in, the stage is set for inflation to remain sticky, strong, and persistent despite what you might hear about “Mission Accomplished” by the Fed and the Financial media.  While there are plenty of differences between now and the 70s in terms of the drivers of inflation, the same stair-step pattern seems to be playing out.  Today’s “higher than expected” CPI report confirms (again).

The 70’s pattern

and now

Investor Implications

              There are important implications for investors.  Where do we put our hard-earned capital such that it will continue to work as hard as we do and hopefully stay ahead of real inflation – let’s call it 5% just to be conservative.

Since 2021, regular readers have heard me talk about The Big Three investment themes and these should really be the foundation of any portfolio until further notice.

The Big Three are:

True Value – Lean into true value like stable incumbent companies paying higher dividends and conducting share buybacks, as well as those trading at subpar industry prices with high free cash flows, strong revenues, and healthy profit margins.  There are many that fit this description, but you won’t find them in the technology or financial sectors. Small caps are very cheap relative to large caps, but selection is key as small caps, in aggregate, still have poor cash flows and high debt.

Internationals/ Emerging Markets—Lean into Japan, European value, Latin America, Mexico, and India. All are far cheaper than the US stock market and offer compelling growth stories. Their economies are just now recovering from recessions or very high inflationary cycles, making emerging markets look especially compelling as a group.

Commodities (including Gold and Silver) – See above!  Supply and demand imbalances have created a new multi-year commodity bull market which started in November of 2020.  2023 and into early 2024 were pullback years for commodities offering us one of the most attractive (re) entry points I have seen in many years.   Little known fact:  Commodities have outperformed the S&P 500 by almost 2:1 since November 2020, even with the correction of the last 12 months!  Commodity bull markets in the 1910s, ’40s, and ’70s each lasted a decade or more.

A couple of rules and guardrails on these themes.  First, they do not all work together at the same time.  Be patient and buy pullbacks within each theme.  And second, it’s not wrong to diversify away from these themes to some degree.  It’s fine to hold some mega-cap tech or your favorite AI stock.  It’s fine to carry a few tiny bond or Bitcoin positions to dampen portfolio volatility.  It’s also fine to do a little stock picking if you are so inclined.  But the core of your entire investment portfolio should be anchored in the big three above.

In addition, investors at large are still expecting a normal business cycle to occur, and the current environment is likely to challenge those assumptions.  In a normal expansion phase of the business cycle, the economy grows, stocks and commodities rise, and bonds give way.  That’s where we are today. In a contractionary phase, demand dries up, the economy begins to shrink, stocks and commodities fail, and bonds take the lead.  However, during persistently high inflationary cycles, the business cycle is highly skewed.  Specifically, during the contractionary phase, inflation beneficiaries, like commodities, continue higher, stocks experience bear markets, and bonds do very little to provide safety.  There is evidence that we are approaching this phase.  Wise and aware investors would consequently skew portfolio allocations towards inflation beneficiaries or hard assets and away from financial securities like large-cap stocks and Treasury bonds.  In this scenario, many investors could be caught off-side with their current allocations.

Other implications are more in the warning camp.  Today, I still see far too much concentration in mega-cap technology, too much money sitting in non-interest-bearing checking and savings accounts, and too much hope regarding the future of the bond market and associated securities.  I also see a great deal of complacency in simply owning the S&P 500 or the Nasdaq 100 as investible indices (SPY or QQQ).  These indices have had an incredible run, but these are not the times or places to get complacent, given record-high valuations and pending risks.  Picking up nickels in front of a steamroller is a phrase that comes to mind.

Thank you for reading. I honestly wish the best to all as we move through this new investor environment. Clients of All Season should rest assured that we have already made the necessary changes to their portfolios. Please do reach out if you need help. We are happy to evaluate your personal situation and help you get aligned properly if necessary.

Regards,

Sam Jones

President, All Season Financial Advisors.

Clean Energy Investments are Having a Moment

March 30. 2024

The landscape of global investment is undergoing a significant transformation, with a growing emphasis on sustainable and environmentally responsible practices.  

Clean Energy: A Sector in Transition 

The clean energy sector is gaining momentum, driven by a combination of technological advancements, regulatory support, and shifting consumer preferences. Renewable technologies such as solar, wind, and hydroelectric power have emerged as viable alternatives to traditional fossil fuels, offering cleaner and more sustainable solutions to meet energy needs. 

The clean energy sector operates within a complex market environment, characterized by fluctuating prices, regulatory uncertainties, and technological disruptions. Despite some of the volatility in this sector, there are common trends that can be taken advantage of. 

Price Dynamics in the Clean Energy Market 

One notable aspect of the clean energy sector is how closely the pricing dynamics reflect the diverse competitive landscapes and challenges faced by various renewable technologies. Solar, wind, electric vehicles (EVs), and batteries each encounter distinct hurdles, yet despite these differences, many securities within this sector exhibit commensurate price changes. This indicates that the sector responds to common factors, despite the individual nuances of each technology. 

For instance, fluctuations in government policies, technological advancements, and global economic conditions can impact the competitiveness and profitability of companies across different clean energy subsectors. While the challenges may vary – from intermittency issues in wind and solar to supply chain constraints in EV batteries – the overarching trends in the market often influence the performance of clean energy securities. 

Understanding these interconnected dynamics is crucial for investors seeking to navigate the clean energy market effectively. By recognizing the commonalities in price movements and the underlying factors driving them, investors can make more informed decisions and capitalize on opportunities for long-term growth and value creation within this rapidly evolving sector. Below, we have included a chart showing a variety of clean energy ETFs. The important aspect of this chart is looking at how, although the ETFs represent different technologies, price changes move similarly. It should also be noted that the sector has pulled back over 80% since the end of 2020.  

 The Bespoke Report, May 15, 2024 

 Riding the Wave of Growth 

Despite the inherent volatility and uncertainties among investments, engagement in the clean energy sector has demonstrated remarkable resilience and growth. In fact, data reveals that investment in renewable energy has grown at an annualized rate of 42.5% in real terms since 2020, underscoring the increasing investor confidence and market momentum in this space.  

The Bespoke Report, May 15, 2024 

 This impressive growth trajectory is driven by several factors, including the declining costs of renewable technologies, supportive government policies (think of the Inflation Reduction Act), and growing public and corporate awareness of climate change. As the world shifts towards a low-carbon economy, opportunities abound for savvy investors to capitalize on the transition to clean energy. 

Seizing Opportunities in the Market 

We believe now is an opportune time to consider allocating investment capital to the clean energy sector. Growth in overall engagement and sector investment, with a pullback in prices, offers a compelling entry point. Despite some of the inherent risks, the sector offers high-growth investment prospects with low price barriers to entry. Moreover, the strong market fundamentals, coupled with ongoing demand for renewable technologies, provide a solid foundation for long-term growth and sustainability. The New Power Fund is a separately managed account dedicated to investing in clean energy, climate solutions, and transformational technologies. We are seizing the current opportunity by deploying cash to new positions in this sector. Please feel free to contact us to discuss your interest or current situation. 

Best Regards, 

Cooper Jones

New Power Fund Analyst 

Cooper Jones analyst

Street Wise

March 15,2024

I talk to investors every day; some are clients, some are not.  Inevitably, opinions and expectations are offered.  I try to stay quiet, listen, and absorb the vibes.  Why?  Because the markets are really just a voting machine governed by investor sentiment driving prices in both directions.  What I take away from the vast majority of conversations today is a strong sense that investors are not very Street Wise.

Ecuador 

As a family, we traveled quite a bit with our young boys.  In 2013, we went to Peru to see Machu Picchu, which is just an amazing adventure, by the way.  We took the stunning Hiram Bingham glass-top train ride from Cuzco to Aguas Calientes, then climbed the ancient stone staircase for 2 hours through the jungle to the sacred city of Machu Picchu.  The boys were 8 and 10 years old and gobbled it up.  I highly recommend the trip and am happy to provide details for anyone considering the destination.  Peru was, and continues to be, a very poor country, especially the further you get from Lima.  Massive shanty towns, shoeless children, and a heavy-handed government that uses drinking water as a means of controlling the population (like shutting off your water).  We made it a point to expose our boys to less developed parts of the world to gain perspective and appreciation for what we have as relatively wealthy Americans.  After Peru, we traveled toward Ecuador to a small oceanside town where Ernest Hemmingway apparently spent his winters fishing and writing.  From the airport, we arranged to have private transportation pick us up because, at the time, taxis were known to rob their passengers, especially gringos.   As we entered a small dusty village along the way, we found that the road was blocked by trash can-size rocks.  A shirtless man with a small orange flag tied to a stick waved us onto a side road.  No bueno.  Around the corner, it became clear that we were being robbed.  Heated words between our driver and the bandits, a serious request for as much cash as we had on us, and we were allowed to pass without additionally losing our luggage, passports, and other valuables.  The boys were wide awake, alert, scared as they should be.  I was sweating bullets in full fight-or-flight mode.  

We arrived at our destination, light by only a few hundred US dollars, but grateful not to be in a ditch face down.  We were lucky.  Conversations with the boys for the next week or so were about bad people and why they steal or what we could have done to prevent this from happening?  I even remember a little pointed anger: “Why did you bring us to this place?”.    To this day, the boys probably don’t remember much about Macho Picchu or Peru or Ecuador, but they could tell you in gross detail about that day on the trip from the airport and how it felt to be vulnerable, afraid, and at risk in a very visceral way.    

During future trips to Argentina, Chile, Costa Rica, and Mexico, it was clear that the boys were much more aware of “other” people, how they looked at you, and how they acted.  How are we going to get there, and is it safe?  Should you wear an Apple watch and bright clothes with BIG AMERICAN brands?  Probably not.  Wallets and phones in the front pocket, out of sight.  By yourself at night? Of course not.  Lock the doors, yep.  In short, they became street-wise, not afraid to travel but watchful with a simple and healthy survivor’s instinct for judicious risk-taking.   

FOMO 

For context, the sentiment I see today regarding housing and the financial markets is not surprising.  The last time we had any event that invoked any sort of real fear was 2008, and before that, 2000.  Since then, we have had mini bear markets and mini corrections of 10-20%, but nothing really lasting in time or of any magnitude that might shake your tree.  2008 was a long time ago and way past the zone of modern memory.  So, let’s say that you are in your mid-30s and graduated college in 2010.  Your memory and experience with everything from real estate to stocks is just up and to the right.  Gains on top of gains, on top of compounding home equity with sub 3% mortgages.  Frankly, you have never been “robbed” by the market in any way and, therefore, would naturally have no respect for what could happen or the fear that comes with dramatic loss.  In other words, you simply have no set of experiences that would create any real sense of risk.   

I thought this annotated chart from Bespoke might be appropriate to show within that context. Looking at a rolling 10-year percent change chart of the S&P can be a little shocking.   

For example, if one were to have made significant investments in the basic S&P 500 index anywhere from 1998 to 2000, one would have seen a total return of negative -50% through the middle of 2009 (10 years).  The same thing happened between 1960 and 1974, but the rolling 10-year return was only -20%.  These things happen.  These are long, painful periods of time with cumulative negative returns, and they tend to change attitudes about risk rather permanently.  It seems somewhat obvious that the rolling 10-year performance of the S&P 500 peaked in 2019 and is now headed back toward the zero line, setting us up for another one of those true generational buying opportunities.   

Since 2008, we have had exactly one micro recession in the US economy in the year 2020 following the pandemic that was so short, many didn’t even know it happened. Unemployment rocketed higher during that time amid COVID lockdowns, but we returned almost immediately to sub 4% about thirty months later with pockets full of “stimi” checks and bulging household savings.   

So, we’re pushing 16 years since the US economy has given us any reason to be Street Wise – Wall Street Wise, Real Estate Wise, Anything Wise.  Quite honestly, street-wise investors would be stashing cash right now and cheerleading for a much-needed deep correction to buy great companies at discounted prices, especially younger investors with a long-term horizon.  Want to buy Nvidia? Be my guest, but how about at a price that starts with a 5, not a 9? (The current price is $926/ share).  Factually, our greatest returns are generated not following periods where stocks are trading at all-time highs but from those deep lows where fear of losing, despair, and doubt dominate the headlines.    

Today, we are at the opposite end of the psychology pendulum.   Among those who have enough choice and dollars to invest, roughly half of the country’s sentiment is predominantly one of FOMO – Fear of Missing Out.   Where is the next rocket ship?  Why didn’t I put everything into Bitcoin or Nvidia?  Damn it!  Next time, I’m going to get a ride… to the moon!  There is unbridled confidence behind putting a majority of your net worth in the S&P 500 as an investible index with an embedded expectation of 12-15% annualized returns.  Maybe revisit that Rolling 10-year performance chart above?  S&P 500 total return since 12/31/2021 is now just a bit over 5% or the same as any money market fund. 


Real estate has also been incredibly rewarding for nearly 30 years – on the back of falling interest rates.  This was the topic of our recent Finding Benjamin podcast- What they won’t tell you about housing.  

Anyone who has owned a home, over the last 20 years, has built up incredible wealth and equity.  Why would we not feel the urge to own even more real estate with the purchase of a second home when our experience has been nothing but green lights and a higher net worth.  Perception is reality of course. 

Personally, I’ve had my financial teeth kicked in enough times to have that survivor’s sense of when current risk and future reward just don’t match up.   On the contrary, I feel like a great many investors are unfortunately destined to learn some Street Wisdom that will no doubt shape their perspectives about risk-taking, perhaps for the remainder of their lives, just like that van ride in Ecuador.  

To be clear, I have no idea if we are heading into a bear market, recession, or something nasty in real estate.  I am simply calling out when I see too much false confidence and reckless spending among investors and consumers at large, and I mean too much, like on a Great Gatsby scale.   

I don’t know; maybe it was that woman coming out of the restaurant last night. 

Oh my God, Oh my God, Oh my God, did I tell you I’m going to Vienna to see Taylor Swift!!!!!!! 

Screams of joy…. And fade to black. 

Becoming Street Wise 

Let’s end on a constructive note.   

Investing is actually pretty easy most of the time.  We can and should have anchor positions in any of the broad-based low-cost Index ETFs using simple rebalancing and periodic tax loss harvesting disciplines.  Roughly 30% of our client’s investment dollars are invested this way.   

But there are clearly times when investors should balance out their index market exposure and expectations with a different strategic approach.  This is one of those times.  We use the term “Strategies” a lot in our shop because we believe that your money should be diversified not only by your holdings but by your very approach to building wealth.   Our clients should have confidence knowing that we are making these changes across portfolios now. 

Lean Into Shareholder Yield and Value 

Consider how you measure success with investing.  For most, it’s really a simple measuring stick of your investment balance. A rising balance equals success, right? Fair enough.  But there are other ways that our investment dollars can help support you financially.  Think about what your stocks or funds provide you in the way of shareholder yield, which is a combination of share buybacks and dividends.  The vast majority of stocks and stock index funds out there provide almost no shareholder yield; it’s all a game focused on price appreciation – aka growth.  The yield on the S&P 500 as an index is 1.45% currently, close to the all-time lows.    

Alternatively, our Multi-Asset Income model kicks out 9.3% annualized dividends, which are paid monthly in most cases.  This week, we will receive 14 dividend checks as free cash flow from our 42 positions, regardless of what happens to the markets.  If you are looking for a Street Wise strategy that cares less about growth and more about consistent, near-double-digit income replacement, this is an option.  To be clear, your balance may not move up as much or be in sync with growth-type investments, but that’s not the objective.  The objective of this approach is to lean into a strategy that does not depend on rising prices as much as consistency of income. When prices also turn higher, as they did in 2020 and 2021, the total returns compound quite nicely, just like a rental property but without property taxes, broken toilets, and troublesome tenants! Sorry for the shameless advertising.  

Generally, this would be the time to also lean toward value managers who can compile a pool of companies generating high free cash flow, profit margins of over 15% and price to sales ratios well below 10.  Most investor money is now highly concentrated in companies that have almost no “value” if one is using these metrics. Have you seen the free cash flow from Microsoft and Apple? 

Here’s another Street Wise idea. 

Consider The Alternatives 

I think the last time I felt this way was 1999.  Alternative asset classes like real estate, gold, commodities, emerging markets and tactical trading strategies were clearly the most hated of all things at that time, just like today.  Of course, these very groups went on to earn double digit, even triple digit returns while the broad US stock indexes plummeted over 50% through March of 2003.   

The table certainly seems set here for alternatives in many forms to begin outperforming any of your basic stock index ETFs.  Last week, gold bullion (GLD) decisively broke out of a trading range dating back to 2011.  This is perhaps the most meaningful macroeconomic event of the last decade, and it received almost no press over the weekend.  Amazing.  We own gold and gold miners and have started accumulating positions in silver.  Speaking of…  Tactical trading strategies are also a good addition now. They can be found in ETF form or generally through separate account management, like our All Season, Worldwide Sectors, and Gain Keeper strategies. Know when to hold ‘em, know when to fold ‘em.   

Consider Future Climate Change Impacts 

I thought this was a fascinating article from Forbes, and I encourage you to read it. 

Climate Change is a Financial Threat to Your Retirement 

Real estate in select coastal areas in states like Florida, S. Carolina, and California is approaching the status of “uninsurable.”  They have been hit by hurricanes, floods, and mudslides so often that insurers simply will not carry them any longer.  How marketable is your house when you go to sell if you can’t get home insurance or the premium cost is so high that it swamps your monthly payment, no pun intended?  Insurance providers are suddenly huge profit centers as premiums are sharply on the rise.  They are very good at quantifying the risk of loss and charging customers commensurately.  We bought KIE (insurance ETF) as a new theme position in our Worldwide Sectors strategy last September.   

Climate change is factually and quantifiably adding risk to select companies, asset classes, and industries that are heavy carbon polluters.  Others are beneficiaries of these changes.  The SEC is forcing all public companies to disclose and quantify their known climate and carbon risks in their quarterly earnings reports.  Make no mistake, shareholders recognize these risks now, just like any other, and are quickly moving toward industries and sectors that are less exposed.  Should we be surprised that traditional fossil fuel companies are struggling again despite their attractive valuations and healthy dividends?  I’m not.  Investment strategies like our New Power fund are clear beneficiaries of these changes toward a cleaner, carbon-neutral world while strictly avoiding companies subject to climate change risk.   

Control the Things You Can Control 

like spending, OMG, OMG! 

It would be wise to consider your financial situation if you suddenly lose your $250k job.  How much debt are you carrying? Multiple car payments? Who will pay your mortgage and your kid’s private school education? What kind of reserves do you have for THAT rainy day?  Controlled spending, limiting debt, and positive day-to-day savings habits are, quite honestly, the most impactful things you can do to improve your financial independence.  It is not how much you make but how much you save that creates wealth over time.  The markets are largely out of your control.  Your income is also largely out of your control whether you are self-made or work for the man.  Personal finance is difficult if you tend to be an undisciplined person, so perhaps the first step is to do a little self-reflection and get help if you need it.  Discipline is a learned habit, and it must be nurtured, reinforced, rewarded, and practiced daily.  Make your bed every day, right? 

That’s it for this week.  Let’s keep it real. 


Good chat 

Sam Jones 

President, CIO – All Season Financial Advisors 


The NEW New Power Fund

March 11, 2024

The New Power Fund (NPF) is currently undergoing a remodeling process, and this transition is happening at the perfect time. Please read on to learn about the future plans for NPF and to discover how we are enhancing its appeal to clients who are eager to invest in a genuine climate solutions strategy.

The Last 20 years

The New Power Fund is celebrating its 20th anniversary and has been consistently outperforming its benchmark, the Powershares Clean Energy Index (PBW), by a significant margin. However, the fund’s original strategy of investing in pure plays in the renewable energy sector has proven to be financially speculative, volatile, and subject to resistance from the fossil fuel industry. To minimize the risk of the strategy, the fund started including companies that fit with ESG (Environmental, Social, and Governance) metrics in 2013. The belief was that ESG metrics would provide a broader framework for investing towards a climate solutions objective. But the water was murky surrounding the collective standards of the many “ESG ratings” and the fund found itself uncomfortably far from its original objectives. Thankfully, in recent months, the SEC and several other regulatory bodies are moving strongly to mandate that public companies provide full disclosures and quantify of all known climate risks as well as expected carbon emissions.  Subsequently, the fund decided to reconstruct its strategy in late 2023 with the aim of maintaining performance while focusing exclusively on companies that have a clear objective of climate responsibility.  We are grateful that the new regulatory metrics will give us more clarity and breadth of opportunity in our security selection process.

The NEW New Power Fund

The New Power Fund has recently made a strategic decision to concentrate its investments solely on climate solutions. In line with this objective, the fund has also introduced a new logo to represent its new direction. To ensure its stability and returns, the fund will no longer rely on investments outside of this objective. Instead, it will allocate investments across three sleeves, with the exact proportions yet to be determined.

  • Transformers
  • Innovators
  • Players

Let’s start by discussing the Transformers sleeve. This sleeve comprises companies that are shifting towards sustainable business practices, products, or services, and those that provide technologies to facilitate this transition for others. For instance, consider one of our latest investments, Waste Management (WM). WM is a well-established company that has witnessed significant growth, both financially and as a business model. However, it’s no longer solely focused on waste diversion but has emerged as a leader in methane capture from their landfills that fuel their Compressed Natural Gas (CNG trucks) and is now installing solar arrays over mature landfills.  You can read all about it HERE.  This is the perfect example of a Transformer; this is a company that is shifting their business model to become a closed loop ecosystem as well as move the needle away from fossil fuel energy sources.

Looking at the second sleeve: Innovators. These are companies that have been publicly traded for 2-4 years, targeting emerging technologies and potential “game changers”. Aris Water Solutions (ARIS) is a wonderful example of a company that has recently been added to the New Power Fund. Aris is a relatively new company but is already exhibiting solid financials. As of this quarter, Aris has 22% year-over-year revenue growth, 142% growth in earnings per share, generates $183M in free cash flow and is still trading at a 40% discount to the market’s current valuation. As a business, Aris is responsible for the recycling and reuse of wastewater generated from oil and gas drilling operations. Aris is working to eliminate the need for freshwater resources from the oil and gas industry! In our minds (and on paper), this is the kind of company we could see having incredible returns while maintaining an “eco-friendly” business model, providing a real solution to an otherwise dirty business.

Moving on, let discuss the final sleeve which is called Players. This section will focus solely on companies that are directly involved in renewable energy, electrification of transportation, building efficiency, as well as broad, clean energy-focused ETFs. One company that we are particularly excited about is First Solar (FSLR). It is a top-tier manufacturer and global installer of Solar PV for utilities, commercial and industrial customers. Moreover, it is currently trading at a deep discount.

We believe that the allocation of assets across the three sleeves is optimal for several reasons. Firstly, the objective of this investment strategy is not only to outperform the benchmark, but also to keep the portfolio’s risk level within the boundaries of the broad US stock market. Secondly, this allocation can be effective because our new holdings are predominantly non-cyclical. Below is an illustration of the current sector distribution, where we have almost 70% of this fund invested in non-cyclical sectors (sensitive) companies.  Non-cyclicals, just like they sound, tend to be less sensitive to the directional trends in economic cycles.  As you can see, we are heavy in industrials and technology which are quite necessary now for everyday needs.

Finally, our three sleeves provide us with the chance to invest in climate solutions from different perspectives. Some of our companies are incumbents, established stable companies that are transitioning towards becoming environmentally friendly. Others are on the cutting edge of emerging technologies, while some are purely dedicated to climate solutions. With this range, we can ensure that we have all our bases covered!

Why Are We Doing This Now?

Fact: The Clean Energy sector has experienced a decline of approximately 80% since its peak in 2021. However, this presents an opportunity to invest at a low point in a sector with immense growth potential. As awareness of the need for climate solutions increases, companies across various industries, including oil and gas, chemical, and manufacturing, are realizing the importance of adapting and committing to environmentally responsible practices. Stakeholders are pressuring them to transform and be more sustainable, leading to significant changes in their operations. What an awesome opportunity to double down on our own commitment with our investment dollars!

What’s Next?

We are currently in the process of reorganizing our investments in the New Power Fund. This involves selling off our previous holdings and replacing them with new ones. The process is expected to take several months to complete, but so far, we are making good progress. Since November 2023, our results have been excellent. The architectural planning for the Fund is complete, and we are excited to finish the remodel. Looking forward, we will provide further updates as progress is made. Stay tuned and feel free to contact us directly if you have any questions or are interested in the New Power Fund. Visit www.NewPowerFund.com for more information.

Regards,

Cooper Jones

New Power Fund Analyst

Cooper Jones analyst


40% Off, Part II

February 22, 2024

I thought I would commemorate this moment with a look back to our popular blog post “40% Off” on October 16th, 2023 and provide a little update as to what has happened since.  There are some great lessons for investors of all types in the last 5 months.  Extremes can get even more extreme and our perceptions of how high or low something can go, are limited only by our imaginations.

My Good American Darn Tough Socks


Because I know you’re curious, my Darn Tough American socks have been under heavy wear now.  They are still as good as new.  No pilling, no holes, not even faded.  Really an amazing product.  I should have bought more when they were 40% off!  Looking back to October 16th of last year, in our post, we talked about the many sectors, stocks and asset classes that were being thrown out for dead and placed on the 40% off rack (40% off from the highs in 2021).  This was the list in October of 2023 with a cautionary note to not buy until these turned higher.

  • Telecom companies like Verizon, 8.48% and AT&T , 7.34% dividends
  • Dows stocks like 3M (MMM), Boeing (BA) and Disney (DIS)
  • Mega theme sectors like clean energy (ICLN, TAN) and Biotech (XBI)
  • Oversold banks (KRE, KBE, BAC and C)
  • Mortgage and equity REITS paying 8-11% dividends.
  • The retail sector (XRT)
  • China and Chinese Technology (MCHI and KWEB)
  • Silver Miners (SIL, SLVP)
  • Long term US Treasury bonds

So, what’s happened to these oversold, forgotten, thrown out, gone for good, sectors since October of 2023.  Well not surprisingly, most are up strongly.

Fact: Since October 24th of 2023:

Banks, retail, mortgage and equity REITs, Biotech and several oversold Dow stocks like Disney (DIS) are still outperforming the mighty S&P 500!

Others in the group are up but not quite as strong as the market.

And several sectors like Long Term bonds, Silver, Clean technology and Chinese Tech are still down.

Two Important Things Happened Yesterday

First, you may have heard of a company called Nvidia.  It’s been on a tear in the last year, up over 400%, and is the poster child of the AI revolution.  Last night, Nvidia reported earnings and they came in as expected but showed clearly that growth, sales and earnings were slowing dramatically compared to one year ago.  Naturally, the stock is up 14% to a new all-time high as I write despite the fact that the stock trades at 41 times gross revenues.  That means that if you are buying NVDA today, you are paying for 41 years’ worth of top line revenues and assuming the company has zero expenses, cost of goods or taxes to pay against those revenues.  If you are buying NVDA today, you are paying a price for a company with the market capitalization (enterprise value) larger than the combined total of all Chinese internet stocks as well as the entire energy sector in the United states.  Maybe Nvidia is that big?  Maybe AI is going to replace humanity? Maybe one company can be bigger than everything else combined.  As a lifetime contrarian, I have my doubts and it seems fairly obvious to me that given the valuation, frenzy and piling on effect in play, this would seem like an obvious time and place for NVDA stock to top out as fully valued.  While companies like NVDA can defy gravity for longer than our imaginations can grasp, we must not forget that gravity still exists.

Second, Walgreens (WBA) was replaced with Amazon (AMZN) in the Dow Jones Industrial Average yesterday.  This feels like another bell ringing moment on a lot of fronts.  The good folks at Dow Jones are quite literally the worst ever in their timing of changes to the index.  Their last big change occurred on August 31st of 2020 when they replaced Exxon Mobil (XOM) with Salesforce (CRM).  Here’s what has happened to both stocks since August 31st, of 2020.  Sorry for the quick screen scrape.


XOM is in Red, up + 209% and CRM is in green up only 4% after moving straight down -52%.

Read all about it here:

https://seekingalpha.com/article/4411886-exxon-mobil-far-outpacing-salesforce-com-since-was-removed-from-dow

Walgreens has seen some tough sledding since it’s last major peak in 2015, down -69% but in the process, we have seen its dividend push up to a whopping 8.61% annually.  I couldn’t say what might be the catalyst for Walgreens stock to rise from the ashes with 100’s of store closures pending.  Perhaps it’s a game of survivor since Rite Aid just declared bankruptcy leaving only two players in the retail pharmacy world – CVS and Walgreens?  But that dividend!

Meanwhile, Amazon is being added to the Dow and it seems logical that Amazon will continue to eat the lunch of all small business and suck the air out of all competition.  Could Amazon march higher? Of course.  Amazon certainly represents the US economy more than Walgreens but maybe they will run into antitrust issues, or continue to see their revenue growth shrink, or maybe Amazon’s best days are behind it (fact)?  The good folks at Dow Jones are clearly pursuing the path of least embarrassment with this change.  If only their track record of timing was better.

For what it’s worth, Pfizer (PFE) and Raytheon (RTX) were also removed from the Dow in August of 2020.  Put them on your watch list?

Opportunities Everywhere

I am reminded of 1999 and I know the situation today is far different.  But what is not different between now and then is the clear piling on effect and concentration of investor wealth in just a few names.  Some would argue that the best and strongest companies like Nvidia, Amazon, Apple and Microsoft, etc. are the most resilient to a flagging economy given their size and scale.  True, true and the companies themselves will be just fine even if we slip into recession.   But when the stocks of these companies rise to a point where it just doesn’t make any sense to buy at current prices, we have to start looking around for where else we might deploy our capital. We don’t need to sell out of our winners completely yet, but we certainly don’t need to add to them; might I suggest taking some profits? The sentiment bells are ringing loudly now as the expectation of higher forever reaches a fever pitch in mega cap tech.  Historically, these types of moments don’t bode well for the future.   Meanwhile, there are deeply discounted opportunities everywhere that bottomed in October of 2023 and still rising strongly!

Our clients know that we make these tough decisions in our managed strategies, and we are not stock pickers as much as asset allocators using low cost ETFs.  Already we are sliding into oversold value, internationals, emerging markets, small caps, pharma, banks, basic materials, oversold industrials, insurance, financials and looking at the deep discount sectors.   We are not chasing anything, just buying slowly and methodically at low-risk entry points.  The point I want to make today is that investors at large need to be aware of the condition of the markets;  specifically, the imbalances we see today with extreme concentrations of wealth in the most expensive sector of the most expensive stock exchange in the world. Why not follow our lead and explore the rest of the market where opportunity lies ahead?

Just like my socks…

I think we’ll all look back on this time and wish we had bought more from the 40% off rack!

Sincerely,

Sam Jones


Mission Accomplished?

January 22, 2024

Every new year in the markets tends to bring a new set of leaders, laggards, and themes.  I always find it helpful to just observe any changes as they unfold in the first 30 days to help guide my thoughts, challenge my assumptions, and shed my own backwards looking biases as needed.  Portfolio management is an art and a science that mandates a certain level of flexibility, humility, and a constant reminder that our emotions are our worst enemy.  For this update, let’s look at what has changed in terms of intermarket action from late 2023 and perhaps more importantly, what relationships have stayed the same.

The Three Horseman?

Bespoke Institutional Research has highlighted the importance of the Three Horseman in the financial markets.  These three variables have arguably been the most important influences on which sectors, asset classes and themes dominate the markets.  They are as follows:

The trend of the US dollar

The trend of the yield on 10-year US Treasury bonds

The price of Oil

Now if you hadn’t noticed, the vast majority of gains generated from stocks in 2023, happened in the last 60 days of the year.  We were all grateful of course to finish strong.  But it’s important to recognize that these gains occurred because the condition of all Three Horseman simultaneously reversed course in a favorable direction.  Specifically, from late October through the end of the year we saw:

The US dollar fall -4.5%

The yield on the 10-year US Treasury bond fall -23.9%

The price of Oil fall – 22.4%

Taken together as a team, these three variables effectively reflected an expectation of falling inflation.  When all three fall in unison, we understand that inflation expectations are falling.  Conversely, when all three rise in unison, we understand that inflation expectations are rising – and are still a threat to the economy.

Unfortunately, in the first 20 days of 2024, all three seem to be forming a new higher base and are starting to trend higher again.  Quickly, our mind begins to ask that hard question.

Is inflation coming back in earnest or did the market simply get ahead of itself in late 2023?  Honestly, we don’t have a clear answer yet.  For now, we are assuming the later case but remain watchful of the former.

Sectors, like Real Estate were clearly the best performers from the lows of late October, ripping higher by 27% in less than 60 days; but so far, the market is “digesting” these gains and real estate is down over 7% in 2024.  Similarly, internationals had a fantastic run in late 2023 but like real estate, they are digesting those gains now as the US dollar is trending higher again.  Oil is marginally higher so far in 2024, so of course we see the Dow Jones Industrial Index and Dow Transportation Index falling.

In short, the market ecosystem is responding to the trends in the Three Horseman again: All up in 2024 so far.    But we are approaching a critical moment for these trends with important ramifications for investors.

I have shown this chart in the past and will bring it forward again, courtesy of Crescat Capital, who has very high conviction that we are nearly approaching a second wave of inflation, like the pattern from the 70’s.  Our conviction is not so high, and we will let the data guide us.  But the risk is real, and we’ll be watching the Three Horseman closely in the next several weeks.


Crescat suggests that the primary forces and drivers of inflation are still present and persistently out of the Federal Reserve’s control.  We presented these non-monetary drivers of inflation at our annual meeting last October:

    • Deglobalization/ Nationalism/ Geopolitical instability
    • Climate adaptation and mitigation
    • Long term underinvestment in raw materials and commodities.
    • Unsustainable levels of global government debt and fiscal deficits.

*I would probably add one more – persistently high costs of housing which account for over 40% of the Consumer Price Index in the US now.

It seems the market and the Fed have proclaimed victory over inflation.  I am not yet convinced, neither is the bond market and they say bond money is the smart money.

I am reminded of young president George Bush standing on the deck of the USS Abraham Lincoln Aircraft Carrier declaring victory over his 3 month old war in Iraq on May 2nd, 2003, with his infamous “Mission Accomplished” speech.  Oh my.


The War in Iraq was not over by a long shot and raged on until the official end on December 15th, 2011 – 8 years later!

Bonds and Stocks; Friends or Frenemies?

From 1982 until early 2021, stocks and bonds moved in opposite directions which gave birth to the magic of the 60/40 portfolio (60% stocks/ 40% bonds).  Make no mistake, this condition was all a fabrication of our own Federal Reserve who have used the Federal Funds rate and monetary policy to effectively support the financial markets, and the economy to a lesser degree, when times get tough.  Historically, when stock prices fell, the Fed dropped interest rates and bond prices rose.  Consequently, the mix of the 60/40 portfolio created a smooth ride for investors:  Up and to the right, no real volatility, no worries, investor bliss.  But history shows that this 40-year cycle is an unnatural and unsustainable condition. Discerning investors are beginning to recognize that the relationship between stocks and bonds changed in 2021.

Consider the correlations between stocks and bonds in different time periods.

1968-1981 (70’s Inflationary period)              Positive  .42 

This means that stocks and bonds were positively correlated, both moving in the same direction during inflationary periods.  There is no diversification benefit when correlations are positive.

1982 – 2021 (40 years of investor bliss)                   Negative  .32

This means that stocks and bonds moved in opposite directions providing excellent diversification benefits.   Enjoy the 60/40 magic carpet ride!

2021-2024                                                    Positive   .35

Back to no diversification benefit

Last 12 months                                           Positive   .42

Back to the 70’s??????

Stock prices and bond prices are still moving in the same direction.  Mission Accomplished?  Not yet.  What’s the point?  The point is that investors now have a few uncomfortable realities to contend with.

    1. Bonds are no longer a safety net for stocks.  They do not yet add value to a portfolio in terms of dampening volatility and they don’t yet pay enough income beyond cash or a money market to justify a permanent or normal size allocation.
    2. We need to consider other asset classes or portfolio strategies that can replace the traditional role of bonds (more on this in a minute).
    3. Higher portfolio volatility is expected and normal until we have a formal economic recession.
    4. A 100% stock portfolio is not a tolerable option for most, especially considering today’s very high valuations.

Big Opportunities

          Despite what you might feel and hear, there are still very rich opportunities for investors in this environment. A few thoughts on this front.

    1. Stocks are factually trending higher, pushing out to new highs in some cases, so we need to remain invested in stocks and avoid the temptation to hide in cash with our stock money. In fact, the first 20 days of 2024, has provided an orderly pullback for those interested in adding to their equity positions.
    2. Small caps are still far more attractive than large caps and tend to perform better when inflation is falling, as it is now.
    3. Relative valuations and growth rates strongly favor these countries looking forward:
      • Brazil/Latin America
      • Hong Kong
      • India
      • Spain
      • UK

*The United States and Japan remain the most overvalued countries in the world by a wide margin.

    1. The Presidential cycle still seems to be in force. “Election years” (2024) tend to be a little weak in the first half but finish strong, followed by a healthy “Post election year” (2025). So, while volatility is to be expected now, it is rare to see more than a garden variety correction in the broad US stock market in the next 24 months.  Given the stakes of our pending election, we should all give this pattern much more room for error!


Alternatives to Treasury Bonds

          This gets tricky and honestly falls outside the domain of most investors’ knowledge and comfort zone.  Our firm has expertise and experience with strategies that do not depend on Treasury Bonds or falling interest rates to generate reasonable portfolio total returns over time.  Here are five ideas without getting too deep in the weeds.

    1. Tactical trading strategies – These strategies can trade away stock market risk either through dynamic asset allocation or relative strength analysis as a means of controlling portfolio volatility.
    2. Alternative asset classes – These are things that have low or negative correlation to stocks and bonds. Things like precious metals, perhaps Bitcoin (now that the SEC has approved public consumption), hard assets and commodities or specialty strategies like covered calls, mergers and acquisition funds.
    3. High dividend paying securities, preferred securities, REITS, credit funds and other hybrid income producers.
    4. Stock picking strategies – Believe it or not, stock picking is back! Select value managers are earning their keep offering both high returns with limited downside volatility.   Think Berkshire Hathaway.
    5. Cash and Money Market funds paying 5% – Yes, this is still a viable option to bonds for as long as cash rates are higher than bond rates!

I’ll close with one critical observation looking back at the last two years, since the highs in late 2021.  Lots of investors got excited about the market action in 2023.  Yes, the markets were up in 2023 but can we say Mission Accomplished?  We mostly saw a healthy recovery from the losses in 2022.  A 60/40 portfolio is still down a little over 5% in total return from January of 2021 to present.  My sense is that we are in a different market environment now.  One in which we need to work a little harder and be a little less complacent with our assumptions about what has worked well in the past in terms of portfolio allocations.  Remember, the Mission of creating wealth and defending it is never accomplished.

Stay tuned!

Sam Jones


Where Are We Now?

December 18, 2023

It’s nice to see the markets finally moving higher in a broad and inclusive way.  Regular readers know that market gains prior to mid-October were largely the product of only 7 stocks, the mega cap technology names that you hear every day in the news. But since October 27th, everything changed for the better and suddenly diversified portfolios and value oriented investment strategies, like ours, are ripping higher.  For this final update of 2023, I’m going to take the pulse on all things financial.  My intent is not to forecast as much as highlight where things stand today on issues like markets and the economy, housing and mortgages, spending and saving, and of course, investor behavior.  I’ll finish with some practical observations regarding the art of Financial Planning.

The Last Dance – Just Like We Said on October 9th

To be clear, this rally in global bonds and stocks, was not difficult to predict.  We did so explicitly way back on October 9th in the blog post called The Last Dance.  I’ll copy and paste the relevant text below as a reminder.

During the 4th quarter, I expect we will see the following:

  • A quick recovery in stocks from the July-Sept sell off that ultimately gives way to the longer-term bear market in place since December of 2021.
  • Bonds should form a bottom here and begin rising stronger than most would expect.
  • Commodities and inflation beneficiaries should participate in the year-end rally but lag, especially as we close in on January.
  • Internationals should rip higher if the dollar begins to sell off.
  • Economic reports will continue to come in weaker than expected this quarter.
  • We will see a peak in corporate earnings this quarter.
  • We will see a peak in employment and wages.
  • We will see real estate prices fall as supply finally arrives.
  • There is a high probability that the Fed is done raising rates.

Ok, so that’s a pretty accurate assessment of what has actually happened in the last 9 weeks.  The point is NOT to beat my chest and say I told you so.  The point is to show that the action in the markets and where we are in the economic cycle are happening exactly as they typically do as the economic cycle starts over at Stage 1 (feel free to reread The Last Dance update for more detail).

Recession or No Recession?

The probabilities are nearly 100% for a recession to occur in the US some time in 2024 but that is still just a probability. It’s also just a matter of semantics honestly. Recession is technically two consecutive quarters of negative GDP.  We actually saw that happen in the first two quarters of 2022.  You can see in the chart below that annual (year over year) GDP fell to 0.7% in Q4 of 2022.

Maybe that’s as close as we get to recession?  Today, factually, economic growth is stable in aggregate and inflation is coming down quickly.  Markets love that set up.  We heard as much from the Fed this week.  And predictably, stocks and bonds exploded higher in relief.  Relieved from what?  Relieved that the worst of inflation is behind us.  What we do not know and haven’t seen yet are the lagging effects of inflation and the Fed’s historically late tightening cycle.  They are only one week away from telling the markets that they are likely done raising rates and several quarters away from recognizing the lagging effects of said rate hikes.  Remember the facts of the past.

  1. There is always a pause in Fed policy after a protracted period of raising interest rates and before they begin lowering rates. The minimum Pause historically has been 7.25 months, 218 calendar days or 150 market days.  This is the minimum.
  2. The last rate hike was July of 2023. We are now 142 calendar days into the Pause.
  3. The Fed starts dropping interest rates when there are clear signs of recession, not before.

All things considered, I’m going to guess that we don’t have any clear signs of recession until the 2nd half of 2024 and that will be the time when the Fed starts to drop interest rates, not sooner.

So, dear investors, we have a nice relief rally happening now and we’ll enjoy the ride for as long as it lasts.  We are fully  invested and have been since the middle of October.    But it’s important to understand the context of why this is happening now and our position in the economic cycle.

Housing and Mortgages

As of Friday, mortgage rates dropped below 7%.  I found plenty of quotes, for those with a near perfect credit score, of 6.90% here in Colorado. That feels like a step in the right direction and mortgage rates should continue to drop predictably from here.  Is 6.90% enough to entice buyers to act?

Honestly, we can’t answer that question in aggregate because people buy and sell homes for a variety of reasons, only one of which is related to borrowing costs.  However, there is one giant comparative variable that is often used as an affordability benchmark and that is rental equivalencies.   The question as always, should I rent or buy?   This is a fun Rent v buy calculator tool from Nerd Wallet that I like to play around with.  I entered a bunch of data for Denver which you can see on the right side.  All pretty accurate for a single-family home, rents and today’s mortgage rates.   Here’s the output.

Ouch, ok so the breakeven today in Denver, CO. is about 28 years out.  Meaning, even though mortgages have dropped below 7%, home prices are still way too high, and rents are still comparatively low.  The Wall Street Journal ran an article with the same assessment and the same conclusions yesterday.   Best to stay in that rental young lady, until rates fall closer to 5% or prices come down ~15-20%.  The American Dream is still alive and well, but it looks like a good entry point is still a ways out.  Of course, if you are paying with all cash or find something that is a screaming deal, have at it but keep in mind that prices are still working their way back down to the long term price trend (historically CPI) according to Bankingstrategist.com.  Millennials and Gen Zs are well aware of this fact and we’re seeing the average age of first time home buyers move closer to 40 years old for the first time in history.  They are none too pleased about it.

Spending and Saving Trends

Luxury goods, leisure travel, hotels, airlines and experiential spending are all very strong today.  I laughed out loud when I saw this (nothing against Tata- she’s awesome!).

I laughed because the Time Person of the Year should be Consumer Spending!  That is what Time is really pointing to when Taylor Swift is HER and personally responsible for $3 Billion in economic activity in the US in 2023.  Wow.

In other spending news. On-line sports gambling is on the rise, like a rocket.  A few stats for you:

  • 1 in 4 adults over 18 now describe their sports betting activity as regular.
  • 42% of all sports betters, gamble daily.
  • Daily gamblers spend on average more than 50% of their monthly take home earnings on bets.
  • Only 3% of sports gamblers make money each year.
  • ONLY 3% OF SPORTS GAMBLERS MAKE MONEY EACH YEAR (in case you missed it the first time).
  • On-line sites like Draft Kings are required to report your winnings to the IRS, but not your losses. Ouch!
  • Money spent on Sports Gambling in 2022 was $7.56 Billion, up from $920 Million in 2019.
  • 85% report that sports gambling improves their lives. Good entertainment I suppose?

Hmmmm, so that’s a new spending trend.

Other spending categories are really the same as ever except everyone is still spending more money to get the same stuff like cars, food, electricity, trash, water, energy, healthcare, construction materials, etc.

What do we make of all this?

Well, we know that spending is still robust especially in luxury and fully discretionary type consumption.   I see quite a bit of YOLO behavior (You Only Live Once) combined with a wealth effect from those who have benefited from the growth in asset prices like stocks and real estate.  I also see a rather enormous pile of savings in the form of M2 (bank accounts, money market funds, CDs, etc).  This has been growing exponentially since COVID.  When we have cash available at our disposal, we tend to spend it.  I certainly hope the Millennials and Gen Zs aren’t spending their future home down payment dollars?

Today, unfortunately, this is also happening.

And we are seeing credit card delinquencies rising strongly now but from a 5 year low.

So, I’m not sure what to make of all that but it does seem obvious that the Time Person of the Year curse might point to 2023 as the year of peak consumer spending in the US.  After all Trump and Elon Musk were both Persons of the year at the peak of their power and popularity.

Investor Behavior

Charles Munger was famous for saying that investors are driven by Envy not Greed.  He is 100% right.  This too feels like an important moment in time for investors to really consider their individual goals, their needs and their personal risk tolerance.  During periods like these, Envy investing drives bad decision making when we feel like we have failed if we are not making more than…. (your neighbor, some index, or something we heard on CBNC).  We find ourselves chasing short term momentum and naturally we become more impatient, ignoring things like valuations.  Yes Virginia, valuations are real, and they matter!  Regular readers might recall our post called “40% Off Rack”.  We have been beating the drum since mid-October about the incredible discounts in stocks, sectors and certain asset types, still trading at 40-50% below the highs of 2022.  And yet, I continue to see more and more money plowing into stocks and sectors that have already moved up more than 200%.

So, where things stand today, investors would be very wise to considering digging deep for those discounts, perhaps trimming big winners, and getting those portfolios rebalanced, rediversified, and ready for 2024.

The Art of Financial Planning

When I was 21 years old my mother gave me an interesting gift.  It was a session with an astrologer who was going to predict my future.  I can remember very little about events or conversations I had at the age of 21 but I do clearly remember what this man told me.  It has haunted me ever since.  He told me that I would reach the peak of my career at age 42.  What a terrible thing to say to a 21 year old.  I don’t even know what “peak” means.  Peak happiness?  Peak income?  Peak skills?  42 years old came and went but throughout my life, I have often benchmarked my career assessment on that arbitrary prediction.  We all have a human interest in knowing the future, especially our own futures.   Financial planning and all the algorithms we employ to predict our future, do a reasonable job of projecting and forecasting our financial well-being all the way out to our death.  Our team of wealth managers including our Certified Financial Planners, work diligently to help you make life decisions like do I have enough to retire? Can I afford that house?  How much do I have to save for my kids’ College Education?   But as Carl Richards likes to illustrate:

There are a few important takeaways I would like to leave with you.

  1. Planning is as much of an art as a science. Optimizing is elusive and we need to stay flexible regarding any predictive work.
  2. Planning is not something that is One And Done. The practice is best done regularly and especially when one has significant life changes like pending retirement, death, divorce, a liquidity event with company stock, a new child, etc.
  3. The All Season business model is built to encourage regular consultation with our certified financial planning partner, Kristi Sullivan. We charge a low asset based management fee (1.1% on average) for comprehensive wealth management that includes full discretionary asset management, tax preparation, up to 4 hours of annual financial planning and periodic updates to your estate with our attorney partners.

This is a clear value to our clients relatively and absolutely.   But most importantly, our business model gives our team the opportunity to show you what the art of financial well-being really means.

I hope everyone has a happy and healthy holiday and we look forward to serving you in 2024!

Cheers

Sam Jones


2023 Strategy Insights – The All Season Strategy

November 30, 2023

We are moving on to review our flagship investment strategy called All Season, the brand of our firm and our longest standing investment program with an inception date of 12/13/1997 managed by yours truly.   It’s my baby and everyone loves their baby.  I’m going to describe the All Season strategy in the context of a solution to investor grievances, specifically one brought to me in full color by my eloquent college roommate back in May of 2021.  He is very wealthy, is on a first name basis with powerful people in DC and was famed to be the speech writer for Al Gore as his first gig out of college.  I keep an email from him on my desk as a reminder.  The All Season strategy directly answers the question of “WHY” we do what we do for investors.  Specifically, the strategy gives wealthy investors what they actually want from a wealth manager, not what they are sold.

My College Roommate’s Words of Wisdom

“I’ve worked with every kind of wealth manager over the years and have watched the industry pretty closely.  Started with Fidelity in their managed funds program and have since used Merrill Lynch, Goldman Sachs, Credit Suisse, and UBS.  My overall take is pretty dismal.  My broadest view is that the industry of wealth management is one of the greatest marketing machines capitalism has ever created.  My own experience is kind of silly from a distance but repeated all the time.  The things I needed most – thoughtful financial planning and scenario planning has been really hard to find.  I continue to search for smart investment management with a careful focus on the tax implications of the management; a sophisticated and active understanding of economic cycles and the willingness to crisply move to meet macro changes in the economy and the corresponding impact on types of assets.  I promise you, this package is really, really hard to find.”

Enter the All Season Strategy…

We built “All Season” as a strategy that would adapt to all stages of the business cycle with dramatically lower costs, full transparency, and daily liquidity for individual investor accounts.   I often describe “All Season” as a dynamic asset allocation strategy – like a hedge fund for individuals without all the high fees and illiquidity.  The strategy offers investors a top down approach that “crisply moves to meet macro changes in the economy and corresponding impact on types of assets.”  In short, the strategy goes where it needs to go, overweighting and underweighting asset classes based on our current position in the business cycle.  These types of changes are not that frequent believe it or not.  After all, the business cycle tends to move rather slowly over time.

Principles behind the methodology of All Season are simple and logical:

  • The economy moves through a cycle of expansion and contraction (see below).
  • Asset class performance is dramatically and persistently different in each stage of the business cycle.
  • We can improve on both risk and returns by overweighting and underweighting our investment allocations if we properly align our holdings with the current stage of the business cycle.

Graphically, this is the business and market cycle (Pring Turner Six Business Cycle Stages) with oversimplified guidelines for when to overweight and underweight stocks, bonds, and commodities.


Easy right?   Not really.  In practice, each stage differs in duration and magnitude by variables that are considered non-systematic; The behavior of the Federal Reserve, global pandemics, war, politics, etc.  Still, the methodology has solid roots and is well worth the effort in terms of the productivity of your investment capital over time.

Let’s look at Treasury bonds over the last 3 years as an example.  Clearly, all evidence in early 2020 pointed to a rapidly growing economy on the back of $7 Trillion in Covid relief stimulus spending.  Remember those days?  Inflation was ripping higher, the Fed was queuing up to raise rates and US Treasury bonds had just gone parabolically higher in price with yields sitting at zero.  At that moment in time, we didn’t need to be a genius to recognize that we were in Stage 4 above.  The evidence was overwhelming.  The model would suggest selling bonds or at least reduce exposure to short term maturities including cash and money markets.  All Season carried almost no bond exposure from April of 2020 until October of 2023.  During this time period, long term bonds fell 41%.  Now, as we described in our October 9th, update “The Last Dance”, we have rebuilt our bond position as the business cycle is clearly moving back to Stage 1 (Buy Bonds!).  We are heading into Economic Contraction and the evidence is again overwhelming.  Long term bonds are already up strongly (+11.50%) since the October 19th low and outperforming the stock market.

Again, the evidence is overwhelming if one is willing and able to look at the data objectively.  The index of leading economic indicators (LEI) has been falling for 19 consecutive months.  Note that the index tends to bottom just as the economy actually falls swiftly into recession.  We are here!


The methodology behind All Season stands the test of time and will continue to generate very high risk adjusted results for as long as we have economic expansions and contractions.

Highlights

All Season is providing our investors with stability and growth over time net of all fees – See the green shaded area below with unfortunate benchmarks for comparison.

At a high level, All Season has delivered the following:

Positive returns in 71% of all quarters

Returns with less than 50% of the volatility of our stock benchmark (ACWI)

A correlation coefficient of .079 to the bond market (AGG) meaning the strategy DOES NOT DEPEND on a falling interest rate environment to generate returns like so many investment solutions out there.

Consistent, healthy, and boring.  Just what we want with our investment capital!

How Does All Season Fit Into Your Portfolio?

All Season can be a core holding representing a majority of your portfolio for select types of investors and investor accounts:

  • More conservative investors who are not comfortable with market volatility (bonds or stocks).
  • Investors with tax deferred accounts where trading does not create short term taxable gains.
  • Investors who are looking for a compliment to a more passive index model or concentrated stock positions.
  • Most importantly, investors who do not feel compelled to beat a designated benchmark.

The Comfort of Tribalism

I want to expand on the last bullet point above for a moment.  A benchmark is really just a measuring tool used by our industry as a means for investors to judge their investment portfolio performance.  We feel like we have failed if we don’t beat the benchmark on the way up but we never seem to feel any sense of success when we beat the benchmark on the way down (by losing less).  Why is that?  The reason is tied to an unfortunate emotional reality; Our need to belong to a tribe.  The tribe is the benchmark which theoretically represents our peers.  If the tribe is suffering, we’re ok suffering too.  Misery loves company after all.  If the tribe is thriving, we want to be thriving too.  Emotionally, it’s incredibly challenging to feel different, alone, outside the comfort of the tribe.  The very top performing investment managers over time, (Warren Buffet, George Soros, Sir John Templeton, Peter Lynch, John Neff) know that the greatest investing success regularly comes from opportunity outside the tribal walls.

Unfortunately, every psychologist would agree that the vast majority of individuals would rather fail spectacularly within a crowd, than try to succeed all on our own.  Consequently, you begin to see why the financial services industry preys on this human emotion and need to belong.

In reality, your benchmark should be your own personal financial needs for growth, income, stability.  The planning process identifies your personal target rate of return over time, not any benchmark.   Your investments returns are there to support your lifestyle and provide financial freedom.  Benchmarking and tribalism do not serve you, especially when they reduce your financial freedom.  The All Season strategy does not play the tribal comfort game.  If benchmark performance is important to you, we have passive index strategies that will impress you.

The Solution

In my many years in this business, I do see the merit of diversifying an investment portfolio not by holdings but by methodology.  We can and should certainly have a portion of our portfolio in a strategy like All Season.  This strategy will keep you in the game, keep your emotional and physical capital intact when the tribe is suffering!  Likewise, we can and should have exposure to the tribe and own market indexes passively.  We want to feel like we are thriving when the tribe is thriving.  The magic is in the mix between the two worlds and our individual blend can be dialed to our needs.  In our shop, we have 9 investment strategies, four of them are tied to the passive index investing methodologies.  The other 5, like All Season, are there to satisfy your proud individualism.

Looking Forward

The table is certainly set to benefit investors who have a healthy allocation to more dynamic asset allocation strategies in 2024.  All Season has lagged the US stock market in 2023 which is why I will be personally adding to my All Season strategy account balance at year end with my annual retirement contributions.  Sadly, I suspect most investors will be looking for ways to add to their large cap growth (aka Technology) investment strategies because this has been the source, the only source of gains in 2023.  From a rebalancing, financial planning, valuation, and logic perspective, this is of course exactly the wrong thing to do now.  Buy low, sell high right?

Please stay tuned for our next Strategy Insights update as we complete the line up throughout December.

P.S. Charlie Munger R.I.P.

Charlie Munger was a brilliant investor and will be missed by all.  My lasting memory of Charlie will always be his dismissive attitude toward everything that Wall Street seemed to love at any given moment.  He was the essence of discipline and always true to the value based, Berkshire methodology.  He leaves our world and investors in Berkshire Hathaway with a cool $160B sitting in cash waiting for something big enough and “valuable” enough to deserve their investment.  Take note.  I will miss Charlie as a lighthouse of common sense.

Sincerely,

Sam Jones


ASFA 2023 Year-End Planning Guide

November 27, 2023

All Season Financial Advisors

Year-End Planning Checklist for Financial Success

As we approach the end of another year, it’s crucial to reflect on your financial goals and make strategic decisions to optimize your financial situation. Our Year-End Planning Checklist is designed to help you navigate through important considerations, taking into account the income, contributions, deduction limits, charitable giving advice, and year-end retirement plan deadlines for December 31st,  2023.  With input from our capable team of wealth management partners, we offer this year end planning checklist to help make your complicated financial life easy.  Get your highlighter out, print and post it on the fridge, and pass this on to your friends and family.   As always, please feel free to reach out to our team with any questions.

  1. Review Your Financial Goals:
    • Assess your progress and financial goals via your E-Money planning portal.
    • Identify any changes in your personal or financial situation that may impact your goals.
    • Be prepared to communicate these to us at your next meeting. Write them down now!
  1. Investment Portfolio Analysis:
    • Conduct a comprehensive review of your investment portfolio with our team.
    • Discuss any significant life changes that may impact your risk tolerance and investment strategy.
  1. Tax Planning:
    • Review your tax situation to identify potential opportunities. We can offer a great deal of customized advice via our AI-driven tax planning software (Holistiplan), if you are willing to share previous years’ tax returns.
    • Let us help you evaluate capital loss carry forwards and potential tax-loss harvesting opportunities to offset gains before year end.
    • Consider maximizing contributions to tax-advantaged accounts, such as IRAs and 401(k)s, keeping in mind the updated contribution limits for 2023.
      • 401(k): $22,500 (plus $7,500 catch-up contribution for those aged 50 and older)
      • IRA (Traditional and Roth): $6,500 (plus $1,000 catch-up contribution for those aged 50 and older)
      • SIMPLE IRA & SARSEP: $15,500 (plus $3,500 over age 49 catch-up)
    • Make your HSA (Health Savings Account) contributions by year end: $3,850 for individuals and $7,750 for families (plus $1,000 catch-up contribution for those aged 55 and older)
  1. Charitable Giving
    • Consider the impact of your charitable contributions on your tax situation.
    • Review the updated charitable giving limits for 2023 and explore tax-efficient giving strategies.
      • Cash Contributions: Up to 60% of adjusted gross income (AGI)
      • Non-Cash Contributions: Generally, up to 30% of AGI
      • Explore gifting appreciated securities to maximize tax benefits.
  • If over 70 and ½ use the qualified charitable distribution rule to make charitable contributions up to $100,000 per year from your IRA to a charity without paying tax on the withdrawal. An additional benefit applies if the taxpayer is 73 or over in that it even qualifies as a required minimum distribution.
  • Advice:
      • Consider itemizing your deductions and batching multiple years of giving. Contribute the lump sum to a donor-advised fund in order to exceed your annual standard deduction ($27,700 for MFJ and $13,850 for Single filers).
      • Document and keep records of all charitable contributions for tax purposes.
  1. Retirement Plan Deadlines:
    • Retirement Plan Contribution Deadlines for 2023:
      • 401(k) and 403(b): Employee contributions must be made by December 31, 2023.
      • Solo 401(k): Employee contributions must be made by December 31, 2023. Employer contributions can be made until the tax filing deadline, including extensions.
      • *Traditional IRA and Roth IRA: Contributions can be made up to April 15, 2024, for the 2023 tax year.
  1. Educational Funding:
      • If you have children or grandchildren, review and contribute to 529 education savings accounts within limits before December 31, 2023. States offer various income tax deductions for contributions to 529 education savings accounts

Remember, your team at All Season Financial Advisors is here to guide you through these considerations and help you make informed decisions.

We wish you a prosperous and financially healthy new year!

Your Team at All Season Financial

Sam Jones           Registered Investment Advisor

Kristi Sullivan    Certified Financial Planner

Dustin Nelson    Certified Public Accountant

Scott Colby          Certified Public Accountant

Dan Mong          Estate Attorney

Merry Balson     Estate Attorney

Create Wealth/ Defend It – According to Morgan Housel

November 13, 2023

Create Wealth/ Defend It – According to Morgan Housel

You may not have heard of Morgan Housel, the 33-year-old, best-selling author of Psychology of Money.  If not, you’re probably way into fiction, not that there is anything wrong with that.  Morgan has recently launched a podcast which I would encourage everyone to follow on your favorite audio streaming service. He is an excellent storyteller, researcher and observer of human financial behavior serving up much needed basic financial literacy to those who are relatively new to the sport.  In today’s update, I will lean on one of his more timely posts regarding “Getting Rich vs. Staying Rich” which we sympathize with via our company tag; “Create Wealth / Defend It”.  In my long history in this business, this may be one of the most important moments to consider the delicate balance between these two opposing forces.

The Pod

As a shareholder of Spotify (SPOT), I like the service and listen to several podcasts a day.  Here’s a link to “The Morgan Housel Podcast” on Spotify but you can search for it by name on any service.

The Morgan Housel Podcast – Getting Rich vs. Staying Rich

What I would like to do for this update is apply several of Morgan’s key points to today’s market environment.  The extremes and bifurcated nature of today’s market is something we have not seen since the 70’s and in some cases since the 40’s.  We are truly writing new chapters in the economic textbooks (is that a thing anymore?).  With history as our guide, investors need to be aware of this situation as extremes such as these tend to mean revert not gradually, buy very suddenly.  There are 38 market days remaining in 2023.  During these final days, we expect current extremes to maintain a tax loss as selling pushes losing sectors and asset classes down while the creamiest of the cream stays frothy right into 2024.  But on January 1st,  2024, the race begins again.  The score is 0-0 and investors are free to buy AND sell based on forward looking opportunity and risk as they see it.  38 days.

I’ll frame this discussion with quotes from this episode and weave in current market conditions.

“Past success cannot be relied on to repeat indefinitely.”

Indeed!  You have also heard the standard industry disclaimer, “Past performance is no guarantee of future returns”.  Not a new concept.

What success is being relied upon in today’s market?

I will give you $1 for every person who believes that the “Magnificent 7” stocks (Facebook, Apple, Amazon, Netflix, Google, Tesla, Nvidia) will underperform the broad US stock market for the next 5 years.  I might owe you $5. Said another way, the past success of the Mag 7 is being relied upon indefinitely by nearly all investors, the media, and the Wall Street sales machine.  It would be downright foolish, overly bearish and unpatriotic to suggest otherwise.

Other relied upon past success comes from the concept that an investor should simply own the mighty S&P 500 index which is magically up 15% YTD while the rest of the market sits on the sidelines.  Why own anything else?  Isn’t the S&P an index of 500 stocks?  Why diversify?  If you can’t beat em, join em?

In 1999, I was the president of the National Association of Active Investment Managers.  I stood in front of a conference room of 200+ risk managers and marked the moment in history by opening with a recent quote from Abby Joseph Cohen of Goldman Sachs.

“There has never been a worst time in history to be a risk manager” – Said Abby

We all had a good chuckle three years later when the S&P 500 and Nasdaq fell 52% and 75% respectively in the first of several historic bear markets.  Neither of these indices made a new high for 13 years.  In 1999, it certainly didn’t seem like it, but we were clearly ending a long period of “Creating Wealth” and moving into a long period of “Defending Wealth”.

Today the S&P 500 is mighty indeed but only so by way of the same Mag 7 stocks that have driven nearly 80% of all gains YTD.  Factually the average stock in the US market is up only 2.36% YTD through November 10th according to Bespoke.  The largest 100 non-dividend paying stocks are up almost 9% while the 100 highest yielding stocks are down almost as much.  Small caps are down over -4% in aggregate YTD.

Did I mention we have a few extremes it the market today?

In short, this is a moment to consider the balance of risk and relative opportunity.  Looking forward, it is safe to say that leadership will change, and money will flow out of overvalued high-risk assets once they begin to experience more downside volatility.  And if history repeats, that same money will quickly flow into lower risk assets offering investors safety, dividends, interest and rising prices.  This is not a call to stick your money in the mattress and hide.  We are simply pointing to obvious extremes and giving all of our clients a better understanding for where we are, and are not, looking to generate returns in 2024.

“Compound interest only works if you give an asset years of growth.”

The benefits of compounding come from long term holds yes,  but real compounding leverage is a function of dividend, income or share buyback type reinvestment combined with price growth.  If I buy 100 shares of a stock and it goes up, great!  But if I reinvest the real cash dividends of that same stock and my 100 shares becomes 150 shares, and it all goes up, then we see compounding in full force!  Dividend payers have been hammered in 2023 (see above) due the Federal Reserve’s tightening cycle.  Now they are done; now rates can stabilize. Now we are seeing a peak in rates.

Today, wise investors might consider sifting through the wreckage of the high dividend payers keeping in mind that tax loss selling period is upon us.  In the last few weeks, we have initiated entry level positions in deeply oversold large cap stocks paying extraordinary dividends in our Multi-Asset Income strategy.

Walgreens (WBA)            9.39% dividend yield trading down 71% from its high in 2015.

3M (MMM)                       6.54% dividend yield trading down 54% from its high in 2018.

Verizon (VZ)                     7.47% dividend yield trading down 40% from its high in 2020.

We have 24 more names on the buy list but currently waiting for prices to stop falling and the end of tax loss selling.  Here’s a hard fact for you.  From 1968 to 1982, an investor’s total return from owning the S&P 500 index, came exclusively from dividends and interest.  If we are repeating the past to any degree, why would we not reach for higher dividends now that they are dramatically higher and easy to find?  For the record, the dividend yield from owning the S&P 500 index is just 1.62% and falling.

Outside of high dividend payers, we have been talking at length recently about the extreme relative underperformance, but real value found today in small caps, mid-caps and internationals, especially emerging markets value.  As we slide faster and faster toward recession, Treasury bonds, municipal bonds, investment grade corporate bonds, municipal bonds, REITs and preferred securities should also begin to contribute to the stability and modest growth of any portfolio.  Today, these are all just a drag on portfolio performance and a source of frustration for all.  Should we chuck them all?  Capitulate and buy the S&P 500? Buy even more Tesla?  Of course not.   Smart investors remain disciplined, diversified and recognize temporary oversold and overbought extremes for what they are.  Fear of missing out can be just as strong as fear associated with losses.  Both cause bad behavior and this is clearly a time to manage your emotions and lean into fact.

“A financial plan is only useful if it can survive reality.”

Let’s finish with this important concept.  Morgan talks about planning for plans to go wrong.  How do we do that?  How can we plan for something that we can’t anticipate? Enter the magical world of probabilities.  Our financial planning software packages, E-Money Advisor and Money Tree, do a respectable job of factoring in things like inflation, spending, income, debt, education costs, planned purchases, etc.  Like any planning software, they can project your finances out into the future based on the impact of these variables and give you a picture of your available capital all the way to your death.  But of course, this is a moving target.  Inflation was 2% forever.  Now it’s probably twice that, maybe permanently.  That fact alone can dramatically change the math of your projections.  Then there are the various assumptions made regarding market rates of return embedded in your assumptions.  If market returns are above average, projections look wildly optimistic.  If they are below average, the outcomes are not so favorable.  What about unforeseen health issues or support for an adult child?

In today’s financial world, I see one enormous factor that has the capacity to disrupt planning assumptions regarding your net worth and that is the value of your real estate.  Real estate prices have appreciated more than 50% nationwide in the last four years.  This success is not reliable indefinitely – see above.    Everyone who is looking at a net worth report is likely to be looking at a wildly inflated number when real estate values are combined with investment account values.   While projections do not typically include the value of real estate, it is human nature to factor in “net worth” in our spending and investment decisions.

My reality check message is pretty simple.  Be very careful about your decisions and assumptions made with regards to real estate prices and current value of your homes.  Examples might include a decision to take out a Home Equity Line of credit while perceived equity is high or buying out a partner in a commercial real estate venture.  Perhaps you need the assessed value of a home to come in high in order to close a contract to sell.   Today’s real estate prices are highly susceptible to any increase in supply for as long as mortgage rates stay where they are.  Any planning done when all markets are experiencing these types of extremes needs a wide buffer to account for the unaccountable.

I’ll leave it there for this week.  Please do follow Morgan Housel on his podcast.  He’s sensible at a time when very little makes sense.

Regards to all,

Sam Jones


Strategy Insights 2023 – Worldwide Sectors

November 8, 2023

Last week I planned to highlight our New Power strategy in this week’s strategy insight, but realized that we have many more client assets invested in our long-standing Worldwide Sectors strategy.  Let’s hit this one first so we can weave in some current holdings and some rather serious considerations as we approach year-end.

Strategy Description

Ripped fresh from our website, this is our description of Worldwide Sectors which is approaching its own 25-year anniversary in January of 2024.

The primary objective of the Worldwide Sectors strategy is to produce consistent, growth-oriented returns over a complete business cycle using individual stocks and ETFs, with lower correlation to the MSCI All Country World Index benchmark.

Worldwide Sectors will produce its best returns in market environments in which there is broad participation and leadership. This strategy has three distinct investment sleeves of approximate equal weightings: Thematic, Domestic and International.  Within each sleeve, selection criteria favor securities with attractive valuations and positive relative strength to peers.

Worldwide Sectors is an all-equity strategy that attempts to remain fully invested in all market conditions and will at times experience full stock market volatility.  Investors will experience both short- and long-term capital gains over time.  Consequently, Worldwide Sectors is more appropriate for tax advantaged/ retirement account registrations.

Ok, so that’s what Worldwide is and the basic framework for the guts of the strategy.   There are several reasons why I like Worldwide Sectors and why it remains one of our longest standing equity strategies.

“Themes” are Persistent and Secular

Themes used to be called Sectors, thus the historical name, Worldwide “Sectors”.  But Thematic investing is a new and improved version of sectors with ETFs and other funds widely available that offer investors a way to capture mega trends.  BlackRock does an excellent job educating investors on the primary megatrends below.  In fact, they have a 19-minute video on the subject if you care to cuddle up with your favorite drink for some financial literacy.

https://www.youtube.com/watch?v=mtxiJWjN2SE


As BlackRock illustrates in the video, thematic investing offers investors a more targeted discipline than owning just any broad market index but eliminates single stock risk at the same time.  Today, Worldwide Sectors is participating in all five megatrends with current ownership positions as follows:

Technological Breakthrough:

SPDR Communications ETF – XLC (50% allocated to Meta and Alphabet)

I Shares Software ETF – IGV (Big positions in Microsoft, Adobe, Salesforce, Oracle)

Global X Cyber Security – BUG

Microsoft (our one and only stock position for double exposure)

Demographics and Social Change

ARK Genomic Revolution – ARKG (new position! Big in Exact Sciences and Crisper)

Rapid Urbanization

Global X US Infrastructure – PAVE

Climate Change and Resource Scarcity

Rydex Commodities mutual fund

Rydex Precious Metals funds

*Looking to add clean energy ETFs ASAP

Emerging Global Wealth

I Shares Brazil – EWZ

I Shares Latin America – ILF

I Shares India – INDA

I Shares Taiwan  -EWT

I Shares Saudi Arabia – KSA

I Shares Emerging Markets Dividend – DVYE

Today we have a US stock market that is cosmetically up on the year, but you have likely heard the truth by now that only mega cap technology is up and up big.  Of course, Worldwide has exposure to technology as you can see above, but we certainly don’t have 100% of assets in “Technology Breakthrough” because that would be foolish and reckless.  In fact, Technology is the theme that we are poised to reduce in size and take profits in the coming weeks as we find other themes to be far more attractive given recent relative performance and valuations.

Internationals/ Emerging Markets Offer Value

Another reason I am so passionate about Worldwide Sectors is the “Worldwide” sleeve.  See above, our exposure to emerging markets is pronounced and justified not only because it fits the mega trend of emerging wealth outside of the developed world but also because this is where we see value across the universe of investment options.

Stay with me as I take a short detour in talking through expected 7-year returns.   Jeremy Grantham, co-founder and Chief Investment Strategist of GMO LLC is famous for his 7-year forecasts by asset class.  He is also the ultimate curmudgeon.  His firms’ analysis has a way of proving right over time but is often seen as wildly out of sync with the markets year by year.   In Jan of 2021, I presented the GMO 7-year forecast and received plenty of feedback that this forecast was way too bearish.  After all, how could stocks AND bonds be projected to fall at the same time.  Unheard of!  Well, we know what happened in 2022 – Exactly that.


Remember this is a rolling 7 year forecast not an annual forecast.  Let’s see where things stand today compared to this forecast looking back from January of 2021 to present.

US large caps                      + 17%                       Way higher than forecast

US small caps                     -16%                         Way lower than forecast

Internationals                    – 4%                          Lower than forecast

Emerging markets           – 18%                       Way lower than forecast

US Bonds                             -14%                         Way lower than forecast

Emerging bonds               -17%                         Way Lower than forecast

TIPS                                       -7%                            Lower than forecast

Thus far, the old man seems to be off track.  Outside of Large Cap US stocks (aka Technology), every asset class is tracking far worse than his 7-year average expected returns.  Here’s the latest from GMO.


Now if we believe the GMO 7 year rolling forecast is good and has a long track record for accuracy in dictating expected asset class returns, which it does, then we can derive several things from the change in expectations over the last couple years coupled with real actual returns dating back to 2021.

In the next 5 years:

  1. US and international bonds are likely to have a very strong period of outperformance.
  2. International stocks, especially Emerging Markets should outperform dramatically.
  3. US large caps are likely to underperform badly while US small caps may do well.

Don’t shoot the messenger because I know and appreciate how much the world has invested emotionally and physically in large cap technology right now.  We are bound only by our failure to imagine a different future than the one we live in today.  Someone important said that once.

Worldwide Sectors has a dedicated 30% allocation to Internationals and emerging markets.  Thus far, it’s been a bit painful as the strategy in aggregate is barely up in 2023 while the S&P 500 is up almost 13% due exclusively to a handful of large cap technology stocks.  In the next 5 years, I think it’s going to work out just fine as all asset class returns revert back to what good ole Jeremy suggests.

I’ll leave it there.  I can see your eyes rolling back in your head.  I am wildly excited with the design and discipline of Worldwide Sectors despite recent performance.  The strategy has a long track record of outperforming our benchmark, the All-Country World Stock index (ACWI), net of all fees and doing so with lower correlation and volatility. This a keeper for any investor looking for a thoughtful, managed,  stock allocation dedicated to value and thematic investing.

Thanks for reading!

Sam Jones

2023 Strategy Insights – Multi Asset Income

November 3, 2023

Year End Investment Strategy Insights – Multi-Asset Income

With imperfect consistency, we try to give our clients a peak under the hood of each of our various strategies as we approach year-end.  Our intent is to answer that pesky question; What are you doing with my money?  Let’s dive in starting with Multi-Asset Income, our creation born in the depths of COVID in March of 2020.

Multi-Asset Income (aka MASS Income)

Before I get into it, let me state plainly that any performance numbers referenced in these discussions is based on internal data and the use of real tracking accounts held since inception of each strategy, net of any and all fees.  Each clients’ true experience with any of our strategies is a function of timing of entry, additions, withdrawals, etc.  This discussion is for educational purposes only with data believed to be accurate and true but unverified or audited by any third party at this time.  We do not provide performance numbers in any public form outside of these strategy insights.  Each of our clients is provided with 24/7 access to their accounts including true performance data generated quarterly from our third-party provider,  Orion Advisory Services.   I’ll leave it at that.  On with the show.

MASS Income has done actually what we would expect in this type of environment.  For comparison purposes, I’ll put the (unofficial) results up against several relevant benchmarks.  These are total returns net of any and all fees.  Let’s first look at losses since the tippy top on December 31, 2021, to Tuesday, October 31st, 2023.

MASS Income Strategy                                  -20.22%

US 20 Year Treasury Bond (TLT)                  -40.85%

Lehman Ishares Aggregate Bond (AGG)    -15.27%

*Vanguard REIT Index (VNQ)                       -32.78%

*The Vanguard REIT index (VNQ), has the highest correlation to our MASS Income strategy just for reference.

Cold comfort I know because I have the majority of my personal investment net worth in the MASS Income strategy.   On the upside, the strategy has delivered an average annual total return since inception of 6.10%/ year including recent losses.  Not great but not terrible.

Let me back up the tape as to why we created MASS Income in March of 2020 and talk through the design, intended purpose, and perceived benefits to investors.

Why MASS Income?  Why Now?

MASS Income was designed to offer our clients a high dividend alternative to Treasury bonds and pure common stocks which at the time paid next to nothing in dividend yield or interest and carried historically high valuations.  Effectively we wanted to build a strategy that had strong total return ingredients with low correlation to both stocks and Treasury bonds. Treasury bonds in March of 2020 were perhaps the least attractive asset class on a fundamental basis of any investible security in the world.  US Stocks were, and are still, unattractive from a valuation basis and continue to pay historically low dividends in the aggregate.   MASS Income, by design is oriented toward hybrid type securities that offered both growth and high dividends without relying on Stocks or Treasury bonds.  These hybrids include the relatively unknown and misunderstood worlds of preferred securities, closed end funds, High Income ETFS,  mortgage REITs, equity REITS, CLO’s, Master limited partnerships, Business Development Companies (BDC), secure lending and credit funds.

Our view of economic conditions back in March of 2020 was simple and clear;  Inflation was coming fast, and we wanted to offer something that would generate income above rising inflation rates.  We wanted to take advantage of a side of the security’s market that could even benefit from higher rates.  Imagine a security that sits on the lending side of the table during a period of rising rates.  These securities generate higher cash flows with inflation, as they are able to charge borrowers higher and higher rates.  These are BDCs, secure lending and bank loan funds and they have all performed as expected – up and to the right!   REITS and preferred securities on the other hand have been smashed during the Fed’s relentless fight against inflation with 11 rate hikes.

In sum, the design of MASS Income is to offer a fully diversified portfolio of securities that generates 7-9% in annual dividend income across 35-45 different securities.  We intend to stay fully invested in all markets and price action of the underlying securities is really a secondary concern to consistent dependable income generation.  We describe the strategy as a winning alternative to owning real rental or income properties.  MASS Income will generate higher annual dividends, plus growth potential, 100% liquidity of capital with 24 hours’ notice and no transaction costs.  Compare that to buying a rental property now at today’s prices and borrowing rates with a 6% commission + your time + taxes + tenants + toilets!

When we started MASS Income in March of 2020, the dividend yield was just over 6%.  Today, MASS Income is generating an estimated annual yield (Dividends and Income) of 9.25% with the vast majority paid monthly.  Wow.  Read that again if you need to.   After nearly three years, we also observe that 40% of total income is received as qualified dividends, taxable at long term capital gains rates.

In March of 2020, I messaged to all that we would never see mortgage rates at then current levels again, in our lifetimes.  Mortgage rates then were near 2.5% for a 30-year fixed rate.  I will tell you with high confidence that you will never see an entire portfolio of securities generate an aggregate yield approaching 10% again in your lifetime.  Seriously, not in your lifetime.   At the same time, we are now seeing the prices of the underlying securities in the portfolio trading at discounts to par, down 25-40% from the highs in 2021.  Now that the Federal Reserve has completed their rate hiking cycle, we are already seeing prices jump.  MASS Income is our best performing strategy in our entire line up, over the last two weeks, as smart investors snatch up these discounts in sync with the Federal Reserve’s new pivot in monetary policy.

I am shamelessly recommending that any of our clients hold and continue adding to the MASS Income strategy now, as a means of generating dividends far above inflation with real potential for price improvement from these depressed levels.  This is a true buy the dip opportunity.  High earners beware, this is not a tax efficient investment strategy and best applied with qualified retirement funds.

Next up… The New Power strategy.

Until next week.

Sam Jones


Where Risk and Opportunity Exist in Your Life

October 30, 2023

Where Does Risk and Opportunity Exist in Your Life?

When I first started in this business in 1994, I honestly looked at wealth only through the lens of investments.  As an asset manager, my thought process was singularly focused.  If I could make big returns and keep them over time, then I would have wealth.  Done!  But 30 years later, I realize that wealth accumulation comes from risk management across many areas of your financial life.  The condition of “the market” is a daily firehose of noise these days drawing our attention away from other variables in our lives where we can have larger control and positive impact on our financial futures.   Let’s take a moment to look at the spectrum of where risk (and opportunities) exist in our lives.

Behavioral Economics

Ok, let’s get this out of the way.  Market risk and opportunity are legitimately one of the primary tools used in our quest for wealth accumulation.  Managing the balance between risk and opportunity in the financial markets by way of our 9 different investment strategies is one of the primary value propositions we offer our clients.   Most of the financial services industry is made up of salespeople disguised as brokers or reps who sell products to investors and do little to no management of those assets once they are invested.  “Set it and forget it” is an industry mantra.  Sometimes that works, but in my 30 years of experience, when bear markets inevitably roll through, that strategy turns into Set it – lose it and sell out at the lows.  We are witnessing capitulation selling in the markets now if you hadn’t noticed.  Conversely, regular readers know that we became very defensive in our risk managed strategies in September by raising cash, buying gold, short positions, commodities, reducing our stock allocations and eliminating all corporate bonds.  Please Re-read “The Last Dance” post on October 9th for more details.   And now, after a waterfall 10% decline, many are hitting the panic button.  Wealthy people rarely manage their own money because they know they are prone to making these behavioral errors.  They hire someone who has the experience and knowledge to make tough decisions for them at the right times.  Sometimes those decisions involve avoiding overhyped and overvalued sides of the market.  Sometimes those decisions involve buying asset classes that everyone hates.

Humans are not designed for investing success.  We are mentally programmed to seek safety/shelter and avoid pain/danger.  However, the most successful investors over time are those that literally do the opposite of consensus opinion by actively allocating investment capital to unloved sectors, asset classes and stocks.  Since it’s Halloween, let’s dress up as a contrarian and see what we can see.  I’ll give you two ideas.

Small caps!

Small caps have been beaten down badly since 2021.  Consequently, the market hates small caps.  No surprise.  Rising interest rates are tough on companies that tend to survive on borrowed money.  But if we believe that rates are peaking now (as we do), then we might consider the potential in small caps.  Valuations are less than 1/3 of their large cap growth brothers.  In fact, according to Bespoke the ratio of small caps to the Nasdaq (home of large cap growth) has only been this extreme once in the last 40 years.

That time was the high peak in 1999.  Those of us who were managing money then, remember clearly that small caps outperformed large caps and the Nasdaq by nearly 60% over the next few years.  Today we have the same extreme situation that should serve as an early warning to sell large cap growth or buy small caps, maybe both. We’ll wait for those trends to emerge but we are clearly keeping an eye on this.

Treasury Bonds

               Today, you would find it difficult to find anyone recommending Treasury bonds.  After all, they have lost 20-50% over a span of three years.  With the gubbermint in disarray over the budget, a cumulative deficit of $1.7 Trillion and $34 Trillion of outstanding debt, who would want to effectively loan more money to the US of A?   Treasury bonds are perhaps the most hated of all asset classes now.  But value has returned in this space with rates now at 5% on a 10-year Treasury, especially as we slip closer toward recession when bonds tend to be the best performing asset class.   If Treasury bond rates simply move DOWN to the current inflation rate of 3.5% over the course of the next 12 months, that move would represent a 25% gain in price.  I like the sound of that especially knowing that we have a well-oiled printing press of the world’s reserve currency  – the US dollar.  Are we heading toward slower growth, or recession?  Yes, at least according to 18 consecutive months of declines in the Leading Economic Index (LEI).  GDP was just reported at north of 4% strangely but it should follow the LEI down into 2024 as it has done historically.


We are actively adding to our bond positions in our risk managed strategies.  As I write today 10/27, bonds are up, commodities up, gold up, and stocks are down (again).

Investing against consensus opinion is very tough but very often the right way to make consistent, low risk, returns over time.  The point is that most investors are prone to bad behavior like buying high and selling low.  It’s human nature.  Market risk and opportunity are always present but the difference between success and failure is how we respond to each with our investment capital.   If you have the time, energy, knowledge and desire to make these choices, go for it.  If not, hire someone with a proven long-term track record.

Cyber Security

Cyber security is as much of a threat to your financial future as anything out there.  I wish we had the time and capacity to offer some much-needed home security training in password protocols, what to look for with email phishing attempts, and setting up multi factor authentication on all financial sites.  I could finally put my masters in Information Technology to use!  Every year we thwart a serious attempt from bad guys who have hacked into one of our client’s email accounts asking us to move money or change the address of record on accounts.  We have protocols and cyber security procedures in place to identify and prevent these attempts.  All Season uses Right Size Solutions as a real time technology partner who monitors all traffic to and from our organization and can provide threat response 24/7.  No one can guarantee full security, but we can do our very best to minimize access and control damage if and when it happens.  We would strongly recommend that you spend some time learning how to use a Password Manager – we like Lastpass.com !  We would strongly recommend that you avoid clicking on any hot links coming to you in email unless you are quite confident in the sender and have verified their “from” email address.  And never, never, never give confidential information to someone who calls you and says your credit card or bank has been compromised – hackers love to pose as cyber security professionals!

Taxes

This is an area of financial opportunity that I have come to enjoy.  They say there is nothing more certain than death and taxes.  Bunk.  Taxes are not certain and can be managed.  This is a clear area of opportunity for most that is in your control and carries direct financial benefit.  Here’s an example.

Did you know that if you can get your income below $116,950 year for MFJ filers, your long-term capital gains tax rate could be zero % (sounds like zeee row)?  Here’s a scenario outlined in our January Solutions Series on the Secure Act 2.0.


How can you get your income below $116,950?  Great question. You can get there by being retired of course, or perhaps doing some charitable giving at year end to slide under the line.  You can use a deferred comp plan, profit sharing plan or cash balance plan to reduce your taxable income if that’s an option.  You can maximize your deductions.  You can chip away at your IRA account balance early so your required distributions (RMDs) post 70 years old aren’t huge.  You can make sure that your taxable investment accounts are passively invested and not generating short term capital gains taxable as income (but do actively manage your retirement accounts!).

Again, if you don’t want to read tax code for fun on the weekends, feel free to work with our tax planning partners and software to help you minimize your taxes each and every year.  This is in your control and directly helps build your wealth over time.

Financial Planning

For years, I didn’t really understand financial planning.  It seemed like an overused label for financial services salespeople. But I have come to appreciate the real value behind regular planning.  I’ll give you an example.  If you are approaching Medicare, it’s important to pay attention to your income in the two years prior to avoid paying extra premiums.  Medicare is means tested with a two year look back to income.  MFJ filers making more than $206k will pay premiums.   Again, careful income planning can help save money and build wealth.

Much of the opportunity and risk control in planning comes from projection work where we look into the future of your cash flows and balance sheet factoring in practically all aspects of your financial life.  Those include, incomes, expenses, home values, debt, rates of return on your investments, inflation, taxes, even budgeting for things like a car, a second home or long-term care down the road.  We can run your “plan” against all types of market conditions to see how much you are projected to have at death leading to discussion about legacy planning and gifting strategies.  There is much to do here that can help answer critical questions like:

  • Will I outlive my money?
  • Can I afford to buy a vacation property?
  • How should my assets be invested to make my plan work?
  • To what extent can I help my adult children financially?

Most of all, clients who go through the planning process and have a clear idea of what they can and can’t do from a spending perspective, find themselves much more at peace about the future.  The process of building your plan is manageable but does take some effort on your side.  We need to gather a lot of information from you, put it all in one digital space, ask questions, evaluate, ask more questions and then put together your financial plan.  It’s a real thing that lives and breathes and needs to be updated annually.  I have found the whole process to be useful, valuable, and it ultimately helps build wealth as well as any of the issues above.

As always, we’re here to help you solve these puzzles with our team of wealth management professionals, working in collaboration toward your benefit.  Today, I see a lot of energy focused on things that are largely out of our control like the markets, the Federal Reserve, wars and politics.  How about spending more time on the things that we can directly control to help manage risk and find opportunities.

Wealth Transfer Solution Series Coming in 2024

This seems like an opportune moment to announce our upcoming Solution Series starting in 2024.  The series is targeted to families that need help, organization, education and training on how to pass wealth efficiently from one generation to the next.  Naturally, this will appeal to those designated as Executors for parents’ estates and/or those designated with a Power of Attorney.  The series will be hosted by each of our Wealth Management Partners offering advice and guidance from their respective fields and delivered quarterly.  Stay tuned for more detail.

Have a great week!

Sam Jones

Upcoming Event

All Season Financial Advisors Virtual 2024 Annual Client Meeting | Details & RSVP >>