May 20, 2024
I’ve been short on words for the last couple of weeks. There is not much to say, really, as nothing—literally nothing—has changed since early April. But there is one topic that lives with me constantly, like a cold that just won’t go away. That topic is wealth concentration and how it seems to be the root of our current discontent on many levels.
Stock Market Concentration
The concentration of enterprise value (EV) as a percentage of GDP among the top 10 stocks in the US is something we have lived with since late 2021. Today, we have reached a double top with the 2021 level at 55% of GDP. WOW! If you just stop for a second to think about that, it will become more and more shocking.
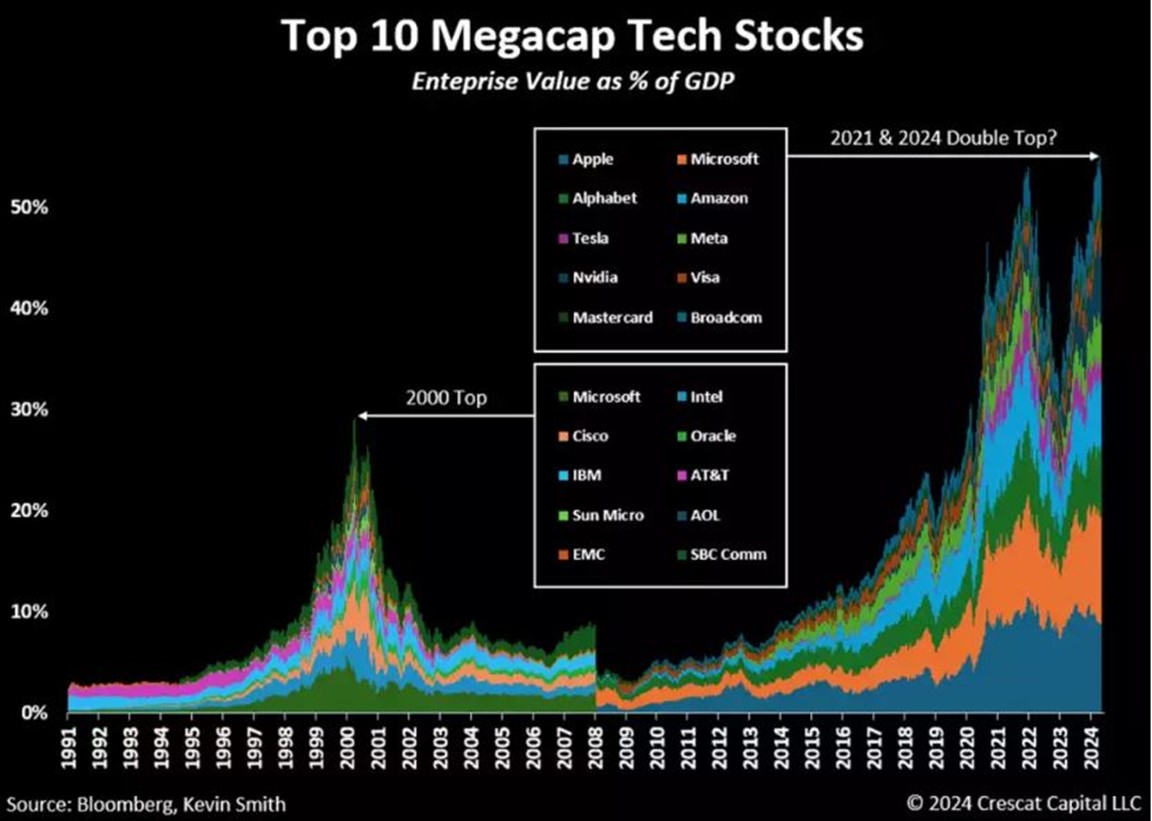
The chart above shows the history of EV concentration, with a notable spike in 2000. Comparing the list of top 10 names in 2000 to the list today, we see one notable standout that has survived both cycles: Microsoft (MSFT). You might also note that EMC, Sun Microsystems, AOL, and SBC Communications no longer exist despite their inclusion in the top 10 companies just 24 years ago. I watched them all get huge and then, one by one, fall into irrelevance.
If history repeats, can you pick which four companies in the current top 10 list will likely be gone in the next 20 years? Which companies have a true wide moat against competition, regulation, and irrelevance if we squint into the distance?
I know my answers, but I’ll hold my tongue to avoid tongue-lashing from the tech loyalists out there. However, the most important point of the chart above (courtesy of Crescat Capital) is that the concentration of enterprise value into the hands of just a few names has never represented 55% of GDP. We are making records. Let’s pick that statistic apart to genuinely understand why historical periods of concentration are highly significant.
What is Enterprise Value?
Enterprise value is by definition, the market capitalization of a company (Shares outstanding x current price) plus its short and long-term debt. In a way, EV is an all-encompassing number showing the raw scale of a public company and how much financial power it carries day to day. To reach a big number, a company has to have issued many millions of shares, which are owned by many millions of investors who have bid the price of all of these shares up and up and up over time. These same companies might also have issued corporate debt, which is held by millions of investors plus endowments and institutions. EV is a measure of the total financialization of a public company, which may or may not reflect the underlying earnings of the company. Let’s be clear that financial power can be an enormous wealth creator as well as a wealth destroyer. Now, the EV of any company can be compared to its peer group or another sector or, in this case, the entire annual Gross Domestic Product (GDP) of the United States expressed as a percentage. When we look at the chart above, we are essentially answering this question:
How much control and influence do these top ten companies have over the future of our nation’s economy? The answer is 55%. I hope you are starting to grasp why this is an issue, perhaps the issue of our current times.
I will now argue that the future of these ten companies is the future of the US economy. How so? These are just public companies, right? Who cares if they suffer? Let me pick apart wealth concentration to explain.
Wealth Concentration
We know that wealth inequality in the US and around the world is at an all-time high. In other words, in the last 30 years, wealth has become highly concentrated, as the chart below shows.
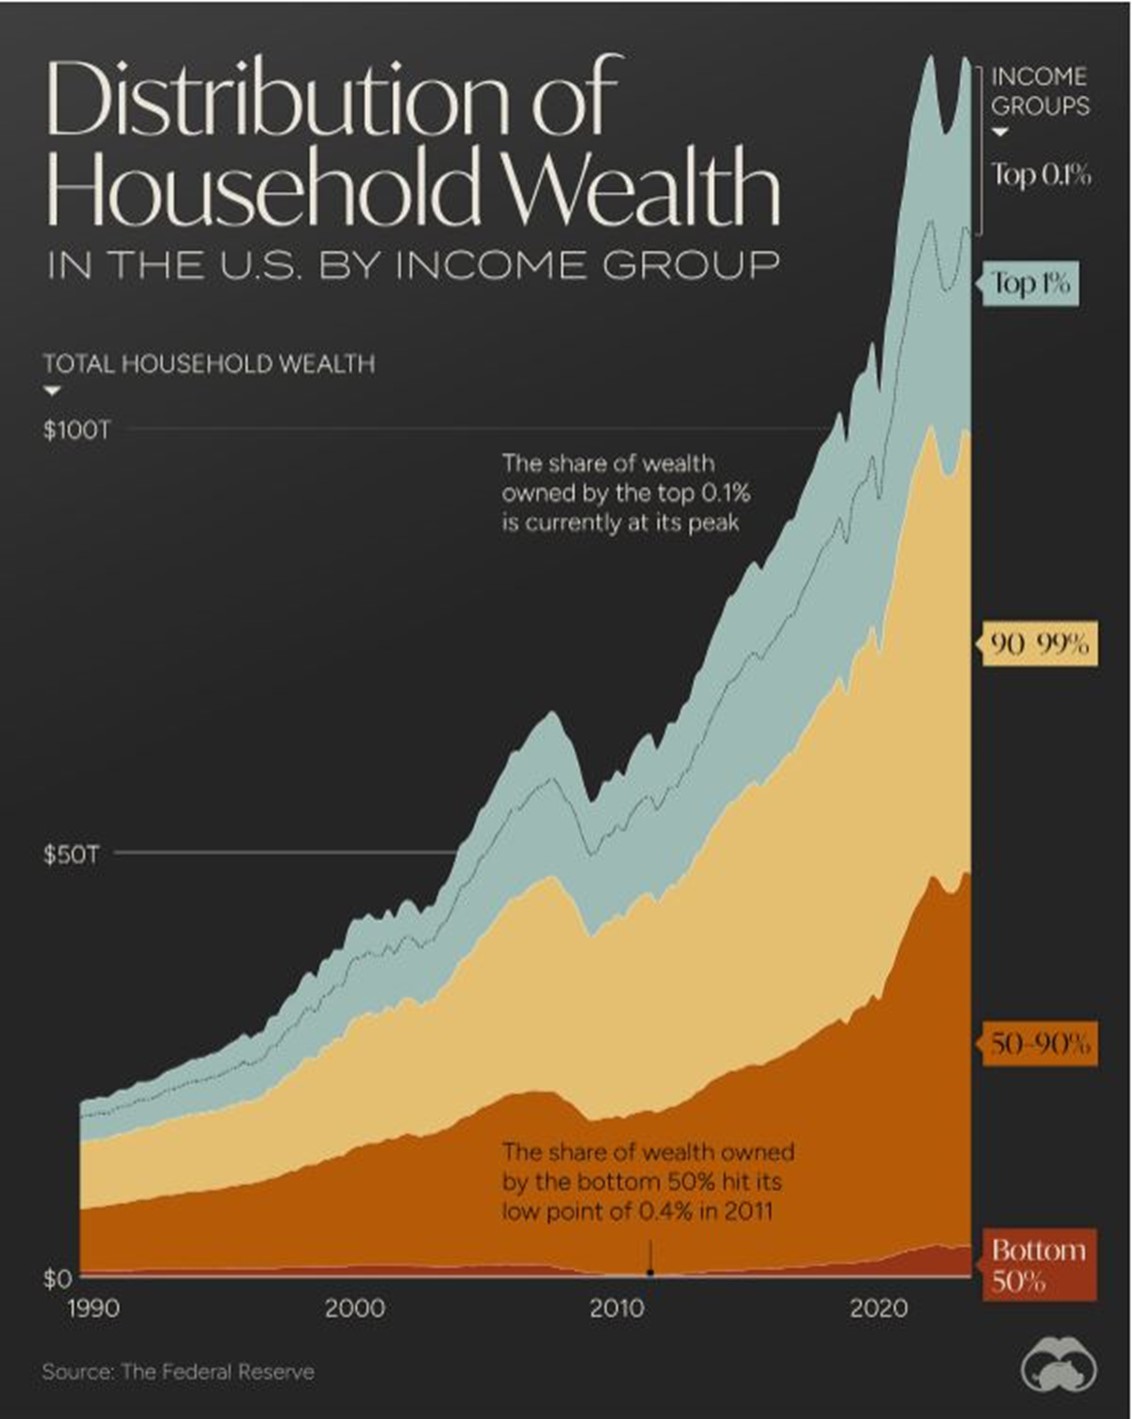 The share of wealth held by the bottom 50% barely registers. By the eye, it looks like roughly 1/3 of all wealth is owned by 90% of our population. Then, of course, we see the headline statistic that 1% of “us” carry nearly as much wealth as 90% of the population combined. Statistically, in July of 2021, we entered a 2nd Gilded Age where the top .01% of our population controls even more than the giants of wealth did at the end of the 1st Gilded Age in 1913. The legacy names of Rockefeller, Carnegie, JP Morgan, Baker, and Frick were all tied to a monopolistic company’s “financial power.” Today, we see the same linkage as the enormous wealth of Jeff Bezos (Amazon), Mark Zuckerberg (Meta), and Bill Gates (Microsoft), which are tied to today’s monopolistic companies.
Ok, so what?
What are the implications of Wealth Concentration in our population, which is factually created by the same forces we see playing out in stock market concentration?
Federal Stimulus Concentrates Wealth
Note in the chart above when wealth concentration in our country took off. It was actually in the mid 80’s, but the chart only goes back to 1990. Students of market history might also recognize that this was the same 30 years in which the Federal Reserve, the Treasury, and Congress began more aggressive measures to support our economy and the markets through stimulus, Federal Spending, “Too Big to Fail!”, quantitative easing (QE 1, QE2, QE 3, QE to Infinity!), and Zero Interest Rate Policies (ZIRP) at the Fed.
Since the mid-80s, we have been in an easy money, debt-driven economy, and we have simultaneously seen wealth concentrate to today’s standards over the same period. Easy money, stimulus, and low interest rates favor asset owners, and wealthy people are the greatest owners of assets. The trickle-down theory is 100% bunk.
Spending and inflation Impact “the rest of us” more
Vox ran a great article on Spending Trends in 2024 by category this morning. I helplessly click on these things over morning coffee. The article discussed current increased spending on services over products, which in general is true, but that’s been going on for about a decade. It’s just slightly more pronounced in 2024. If we forget the comparison and look only at where we are increasing our spending in 2024, we see the ugly head of inflation. We are not factually consuming more insurance, healthcare, shoes, or transportation. It’s just that these items are still experiencing very high increases in costs year over year (aka inflation), and thus, effectively, we need to “increase” our spending by as much as possible to receive the same quantity.
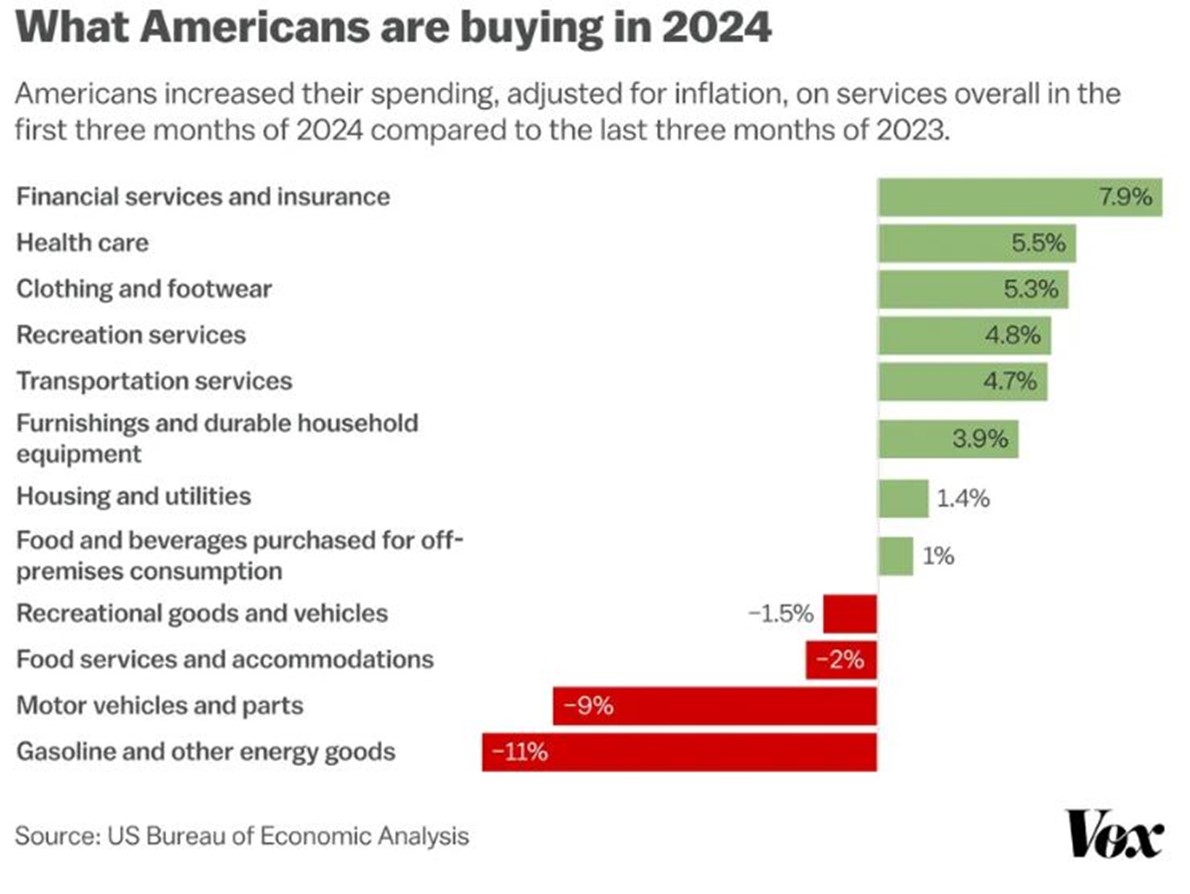 On the other side, you can see demand for discretionary items starting to dry up as we head towards a not-soft landing (wink). Van life is over, obviously. Restaurants are starting to feel the pressure of fewer customers, car purchases are slowing down, and home buying and furnishing are still hard frozen. I like to observe spending trends because they essentially neutralize the issue of who is spending (and the amount being spent) and instead aggregates where the money is going and what it is being spent on, not just its source. From this, we get a truer sense of what is happening in the aggregate. What we know already is that “the rest of us” who do not live among the 10% of wealthiest households are impacted more by inflation. Obviously, things we need that cost more take a bigger bite out of our monthly paychecks. Wealthier people are economically insensitive. So what we see from the chart above represents in full color why so many people in our country feel like they are not participating in an economy that is supposedly growing. They see the headlines. They see and feel wealth concentration all around them, yet they struggle to pay basic bills. Ask any young person under 40 how they feel. Ask anyone in the unskilled service economy. Ask anyone who is working their butt off in a trade, and they will tell you they are barely hanging on. And no surprise at all, we are seeing new records in credit card debt now exceeding $1 trillion as households across the country have burned through any savings.
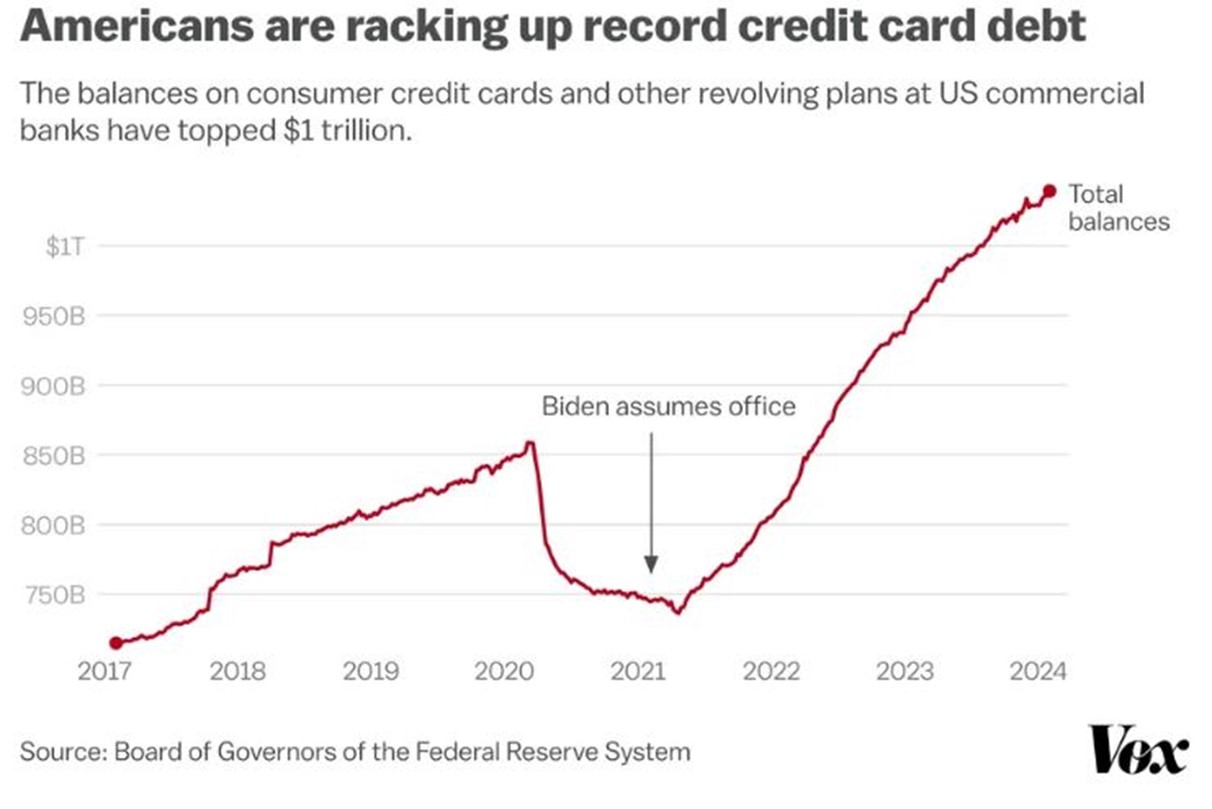 You might note on the chart when Biden took office. Very unfortunate timing for him, as the US consumer was just consuming the last of their COVID stimulus checks. Politically, I’ve heard many in the last few weeks wondering why Biden is polling so poorly even while DJT is sitting in the courtroom. It has nothing to do with his age. It has everything to do with the chart above. The “People” want change, and they don’t feel like Biden is that agent despite his efforts to support lower and middle-class citizens with debt relief, child tax credits, bumping minimum wages, supporting unions, fending off Chinese competition, Etc. Oddly enough, Biden is probably the most aggressive champion of the unwealthy we have seen in modern history. If re-elected, he has already promised to seriously work toward wealth redistribution. Hopefully, he can get that message out clearly before November. I suspect his term, accomplishments, and campaign promises are being overshadowed by bad timing and still sticky inflation.
Let me try to wrap this all up and put a bow on it for you.
Wealth is becoming more and more concentrated in the hands of less than 10% of our population by way of record high concentration in the enterprise value of just a handful of public companies as well as Federal stimulus over the 30 years. The top 10% of our country own assets like houses, businesses, and a whole lot of stocks. These two things are inextricably linked. The stock market will become less concentrated when the top public companies structurally go into decline, and yes, this will happen eventually, just as it has in the past.
The bottom 90% of our country, measured by wealth, are now feeling pinched, and they are going into debt just to keep the lights on. Inflation is impacting them more. This will continue to be a trend economically and we should expect to see demand for goods and services continue to dry up in the aggregate as it has since March. 10% of our country cannot keep the entire economy afloat even if they spend extravagantly.
Politically and socially, we are a mess because of all of the above. Wealth inequality is one of the root causes of political and social polarization today, in my opinion. Ironically, you need to be a very wealthy person to be in Congress or run for federal office of any sort these days, not to mention the crippling age issues of our incumbents. How can they represent the common good when our very leaders are part of the wealth inequality problem? But I digress. This leads us to the big question. How do we unwind all of this? How do we reverse the trends that tear us apart politically, economically, and socially? You’re going to hate the answer, but it’s the hard truth: A Significant Recession.
So that is what’s on my mind now, and I hope this serves as an explainer of sorts for many of the questions you might have rolling around in your head.
Next update, we’re going to dive back into real estate because there is a new trend emerging that is going to surprise you.
Until next time – thanks for reading!
Sam Jones
