CALLING ALL CARS – RECOMMENDATION TO PARTIALLY ALLOCATE NEW MONEY (CASH)!

Calling All Cars – Recommendation to partially allocate new money (cash)

It feels like it’s been a long time since we’ve had any chance or reason to recommend adding new money to investments. But there is now sufficient evidence to do so with a portion (not all) of your planned annual investment savings.

Calling All Cars is a notice to our clients and regular readers with instructions regarding when to add new money to more passive oriented investment accounts.  These are things like 401k plans, 529 education accounts or even an investment strategy that is committed to passive indexing.  In these situations, when trading away market risk is either not possible or not part of your plan, we have one simple task. That task is to add money when the markets are down, selling at a reasonable discount and presenting technical evidence that a bottom is developing. This is such a time. The S&P 500 and most global equities are down a clean 10% from the highs set on January 26th and today we saw a full attempt to smash through the February lows by 2%, only to see buyers step up smartly (again).  As I said in my update yesterday, we have “Entered the buy zone” and now we have even more evidence for price support at these levels.

With that said, let’s not go crazy.  This is not a situation where anything is really attractively valued on a longer term basis and I fully expect to see lower prices for the market in the second half of 2018 and into 2019.  But from this price level, the markets could easily move back to the top of the range and partially out to all time new highs. Therefore, we need to look at this as a place to put some money to work.

Our recommendation is to deploy approximately 1/3 of your planned investment savings for 2018 into the equity investments of your choice at this time.  Our net exposure model is angling to go positive this week but we won’t really know until Friday’s close so it would make sense to get your buys done in the next couple days if conditions remain favorable.

529 Plan Recommendation (my personal accounts)

I can’t offer specific advice to anyone via this blog as everyone has individual circumstances but I will tell you what I did with my own 529 accounts today for my kids who are 16 and 14 years old if it helps.

Prior to today I was allocated as follows:

40% Aggressive Growth

60% Money Markets

After today I will be allocated as follows:

60% Aggressive Growth

20% Income

20% Money Markets

So I’m not talking about a big change but I did deploy 1/3 (20%) of my available cash (60%) that has been sitting there since December of last year to stock.

I also bought an “Income” allocation for the first time in many years.  Why?  Because short term interest rates have been moving higher for most of the last 5 years and are now comparatively attractive. I also like international bonds and emerging market bonds here. The “income” allocation in the Colorado 529 College Investment program offers a nice blend of these bonds so I threw in a little portfolio ballast and income against my increased stock exposure.

Passive investors, or those looking to make timely contributions to 401k plans can follow the same approach and allocations making your own selections as per your available fund options.  Again, I’m sorry I can’t be more specific on what to buy as much as telling you when to buy via Calling All Cars.

As always, please feel free to contact us directly if you would like to get into the weeds of your personal situation.

We’re here to help!

Cheers,

The Team at All Season Financial Advisors

ENTERING THE BUY ZONE?

Entering the Buy Zone?

I’ll be brief and to the point.  The markets are now approaching another potential inflection point. Wise investors will be on the lookout for several important markers in their decision making.

Satisfied a Standard Correction, But Best to Wait

With today’s (Tuesday) selling, down almost 3{1de7caaf0b891e8de3ff5bef940389bb3ad66cfa642e6e11bdb96925e6e15654}, the US stock market has now completed a basic A-B-C pattern for a standard 10{1de7caaf0b891e8de3ff5bef940389bb3ad66cfa642e6e11bdb96925e6e15654} correction in prices from the highs.  The standard involves a hard, shocking first down move, which we saw into point “A” the lows on February 8th.  Then we see a partial rebound back up to point “B” which occurred on March 9th.  Finally, there is the widely anticipated retest of the lows, now at point “C”.  Sometimes, this is where the correction ends forming a tidy double bottom from which investors can start to make new purchases.  But more often than not, the double bottom doesn’t hold especially after a historic period of low volatility like we saw in all of 2017.

Today, I see some adjacent evidence that our markets may indeed need to go lower before finding a final low.  Here’s what I’m seeing.

  • I’m seeing the FAANG stocks that have led this entire bull market higher for the last couple years, see the brunt of selling pressure.   As I write, the US stock market is down just shy of 3{1de7caaf0b891e8de3ff5bef940389bb3ad66cfa642e6e11bdb96925e6e15654} while Amazon is down 5.6{1de7caaf0b891e8de3ff5bef940389bb3ad66cfa642e6e11bdb96925e6e15654}, Netflix is down 5.78{1de7caaf0b891e8de3ff5bef940389bb3ad66cfa642e6e11bdb96925e6e15654}, Microsoft down 3.36{1de7caaf0b891e8de3ff5bef940389bb3ad66cfa642e6e11bdb96925e6e15654} and so forth.  When your market leaders are leading lower, it’s often a good idea to take a wait and see approach before buying anything.
  • I’m also seeing the breakout in US Treasury bonds continue to upside.  This was not supposed to happen right?  But it is, just as the Fed is now aggressively raising interest rates – late to the party as usual.  The bond market is a good indicator of investor fear and the continuing strength here indicates that stocks may have more downside as well.
  • Technically, if the US stock market were to close where it is now, it would marginally break below the widely watched and quoted, 200 day moving average.  For many this average of prices looking back 200 days, marks the trend and a broken trend is reason enough to sell more stocks.  There is no magic to the 200 day moving average beyond the self-fulfilling nature of it.  So many technical people watch this line, and when price breaks below it, you can see additional selling.

So, all things considered, there is a set up developing for a potential bottom here that could take the markets up and out to all time new highs.  But this is not a time for heroics.  This is a time to wait and see what happens because this is also that moment on the edge where accidents occur.  No need to stick your neck out just for bragging rights.

Our models are still sitting on a pile of cash developed in early February and again in early March (around 40{1de7caaf0b891e8de3ff5bef940389bb3ad66cfa642e6e11bdb96925e6e15654} or more now).  That is a lot of cash that can be used to buy any number of new positions at now lower discounted prices.  Our Net Exposure model finished last week sitting at a -8, the same reading as the previous week giving us little reason to deploy cash yet.  So, we’ll sit and watch and know that our exposure to the markets is just about right for this stage of the cycle.

Just a quick update for those who are wondering how we see this.

That’s it for now.

Stay tuned!

Sam Jones

CHECK YOUR PULSE

Check Your Pulse

Now that March is behind us and the markets have finally done the unthinkable act of going down over the course of a quarter, this is a great time to take your pulse and look inwards at your own Risk Capacity.  Until you really know yourself and understand this concept, you’re going to be prone to making unproductive investment decisions.  This commentary is oriented toward non ASFA clients who are struggling with what’s happening in the markets.

Know Your True Financial Situation

You might feel some anxiety when the market falls 1000 points, or 3000 points as it has done since late January.  It lost a clean 10{1de7caaf0b891e8de3ff5bef940389bb3ad66cfa642e6e11bdb96925e6e15654} most of which happened while you were brushing your teeth at night or maybe enjoying a late lunch.  Naturally, we want to check our account balances and do a little damage assessment.  It’s a bit like falling off a bike.  You crash, you sit there for a moment, feeling numb, and then take inventory on your scrapes and bruises.  That’s we suddenly sense pain.

But the level of pain associated with market losses, even if still on paper, is really a function of your personal capacity for risk.  I’ve discussed this before at length.  As a reminder, risk capacity gets to the heart of what you and your household can really tolerate in the way of volatility in your net worth on the basis of your true financial situation.  In other words, risk capacity is based on your net worth, your living expenses, your age, your income, your future expenses and your general financial situation.

This is often enormously different than how you might think of yourself in terms of your willingness to take risk!

We might think, hey I’m a risk taker.  I want to make big money and take a swing at big opportunities like crypto currencies or Canadian Marijuana companies or that next big IPO.  But when these things don’t really work out like we expect, and we begin to recognize big losses, our high risk tolerance has a funny way of becoming highly risk averse and we sell, at the lows, for a huge loss.

Risk Capacity defines your eligibility to invest in stocks or other risk assets, not your perceptions of yourself, which are often at odds.  The most tragic cases are those who do not have very high risk capacity (low net worth, sketchy job security, running out of peak earning years, etc) and are looking to their investment portfolios to bail them out or make up for lost years of not saving enough.  I see this a lot.  Honestly, it’s wishful thinking based on need not reality.  The markets will only produce so much in the way of gains over time regardless of your financial needs.

Of course, this is an extreme example but I do see many many portfolios that are way too exposed to stock and stock index funds for a market that is showing this level of mean reversion and volatility.

So this is a great time to have an honest conversation with yourself and it’s not too late to do so.  If your portfolio is not allocated according to your risk capacity, you will ultimately behave badly at the wrong time.  That looks like selling in panic at a time and place when you should not.  It can also look like chasing (buying) something like the FANG stocks just as they are seeing their final hours of price gains.  This happened in mass around the middle of January and most are now down 15-20{1de7caaf0b891e8de3ff5bef940389bb3ad66cfa642e6e11bdb96925e6e15654}.

In our firm, we work hard to ask the right questions of our clients, know their real financial situations through our intake process and build portfolios of strategies that align with their true risk capacity.  Our clients have all heard us say, “no, we need to stick with the current allocation because of where YOU are in your financial life”.

Risk Capacity moves very slowly, while willingness to take risk shifts with the wind.

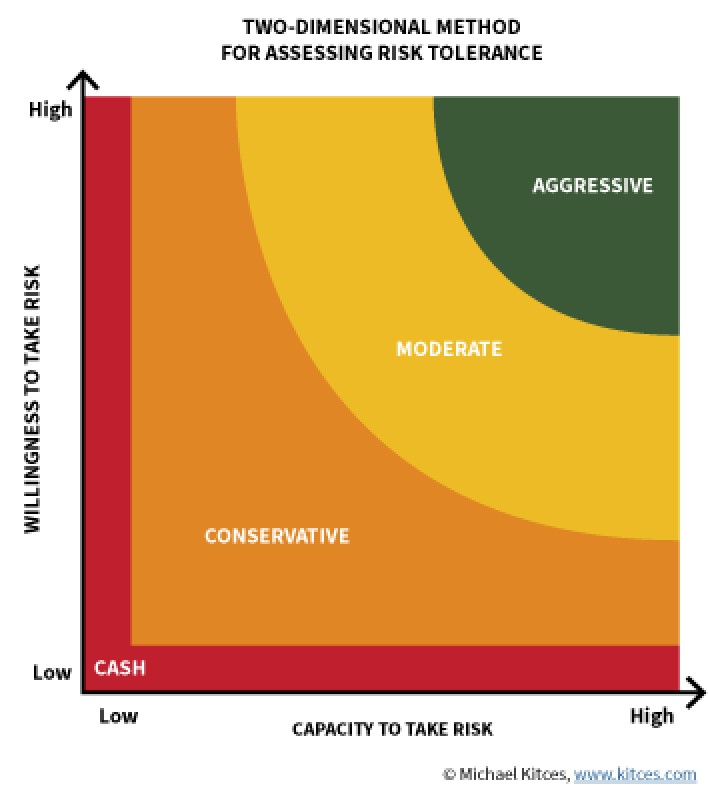
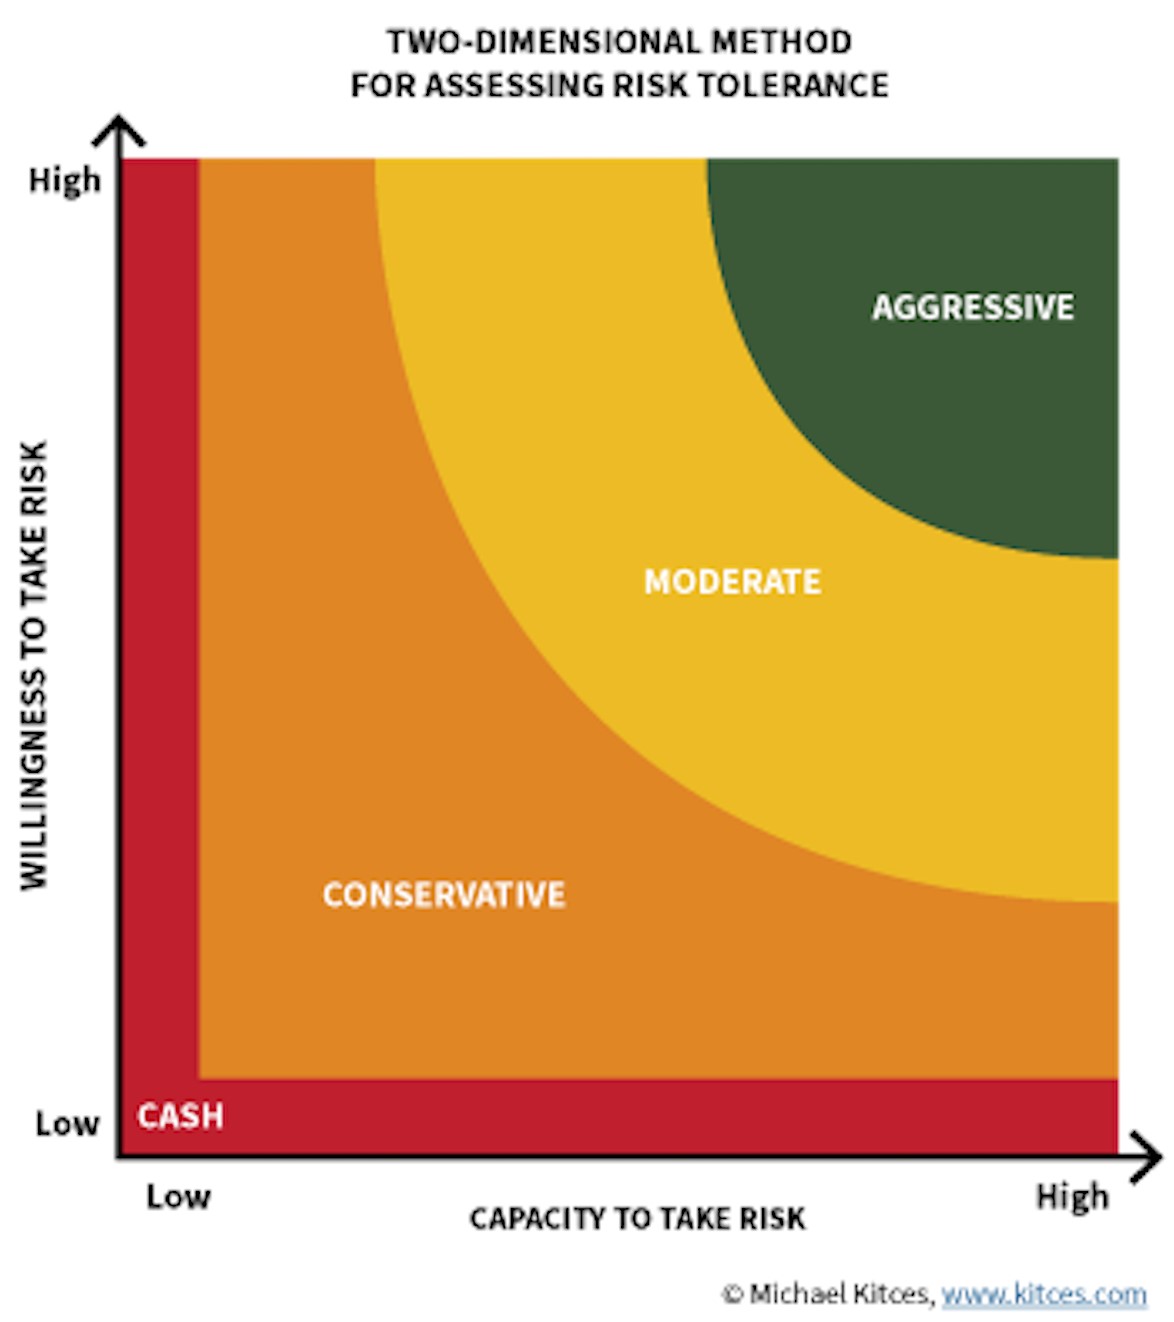
Here’s the chart that I’ve shown many times of the relationship between Risk Capacity and Willingness to Take Risk provided by Michael Kitces of www.kitces.com .  What you’ll notice is that very few investors would actually find themselves in the upper right hand corner.  That little piece of pie is pretty far out there as a cross section of both high Risk Capacity and high Willingness to Take Risk.

You’ll also recognize that the vast majority of investors should maintain conservative allocations or may not even be eligible to invest because they are still in the Red Zone (Cash).

I remember listening to Jim Cramer of CNBC who said in no uncertain terms that you are not ALLOWED to invest in individual stocks at all until you have at least a $100,000 account.  I hate to agree with Jim but he’s probably right.

All of this is inconsistent with what I see today under the hood of prospective client portfolio statements.

I’ll step down from the pulpit and leave you with an action item to consider.

On January 12th, 2018, we launched The Lighthouse Project (https://allseasonfunds.com/red-sky-report/the-lighthouse-project)

This is a no obligation, free and easy, opportunity for any non-ASFA client who feels they may be more exposed to more risk than they should (wink) considering the very real change of character in today’s market.

Through the process we will:

  • Stress test your current portfolio holdings for
  • Assess your tax efficiency
  • Recommend solutions to better control your portfolio returns

Please contact us if you’d simply like a second opinion on your portfolio.  It’s not too late to make changes and reorient your portfolio for the new investing environment.

Don’t take our word for it.  I just read this from Jared Dillian who is a highly seasoned market guy with decades of real time experience.

“I can say with a very high degree of confidence that we have now departed the low volatility regime and entered a high volatility regime. Everything that worked for you for the last several years will no longer work. I don’t even know what that is, but it is definitely true.”  

Jared Dillian 3/29/2018

That’s it for now.  Enjoy the long holiday

Cheers

Sam Jones

CRAZY TALK

Crazy Talk

     I found myself shaking my head over breakfast while reading this article.   I couldn’t disagree more with most of it, but there are a lot of topics discussed that are relevant to a discussion of today’s financial conditions, economics, and investor behavior.  For this update, please read along and enjoy my snarky commentary in Blue.

Ten years after the crash, Americans still have not fallen back in love with stocks

David RandallApril Joyner

6 MIN READ

NEW YORK (Reuters) – Luke Thomas, 44, an information technology field manager who lives in Miami, began investing in the U.S. stock market in his early 20s, attracted by the prospect of learning “how to grow a little bit of money into a lot,” he said.

At the time, he put most of his money into a handful of small-cap and over-the-counter stocks. Yet watching the Russell 2000 index of small-cap companies fall more than 60 percent during the 2008-2009 financial crisis scared him into diversifying his portfolio. He now invests in large-cap stocks, real estate, options, and cryptocurrencies such as bitcoin, spreading his risk over several asset classes.

I’m glad Luke learned his lesson but he still doesn’t really understand how correlations change in different markets.  When it goes down, it all goes and Luke’s stated “diversified” portfolio will offer him almost zero downside protection.

“A younger Luke would have focused 90 percent on crypto, putting all my eggs in one basket. But this way, I’m not overly exposed,” he said.

Luke is still exposed

Thomas is not alone in his hesitation to make big bets.

Because Cryptos, Options and Large Caps are small bets?

Ten years after the start of the financial crisis that erased $16.4 trillion in assets from U.S. households, Americans have yet to embrace the U.S. stock market with the same fervor as before, holding fewer individual stocks and putting less money into equities overall despite an uninterrupted 9-year bull market that has pushed the S&P 500 up nearly 310 percent from its 2009 lows.

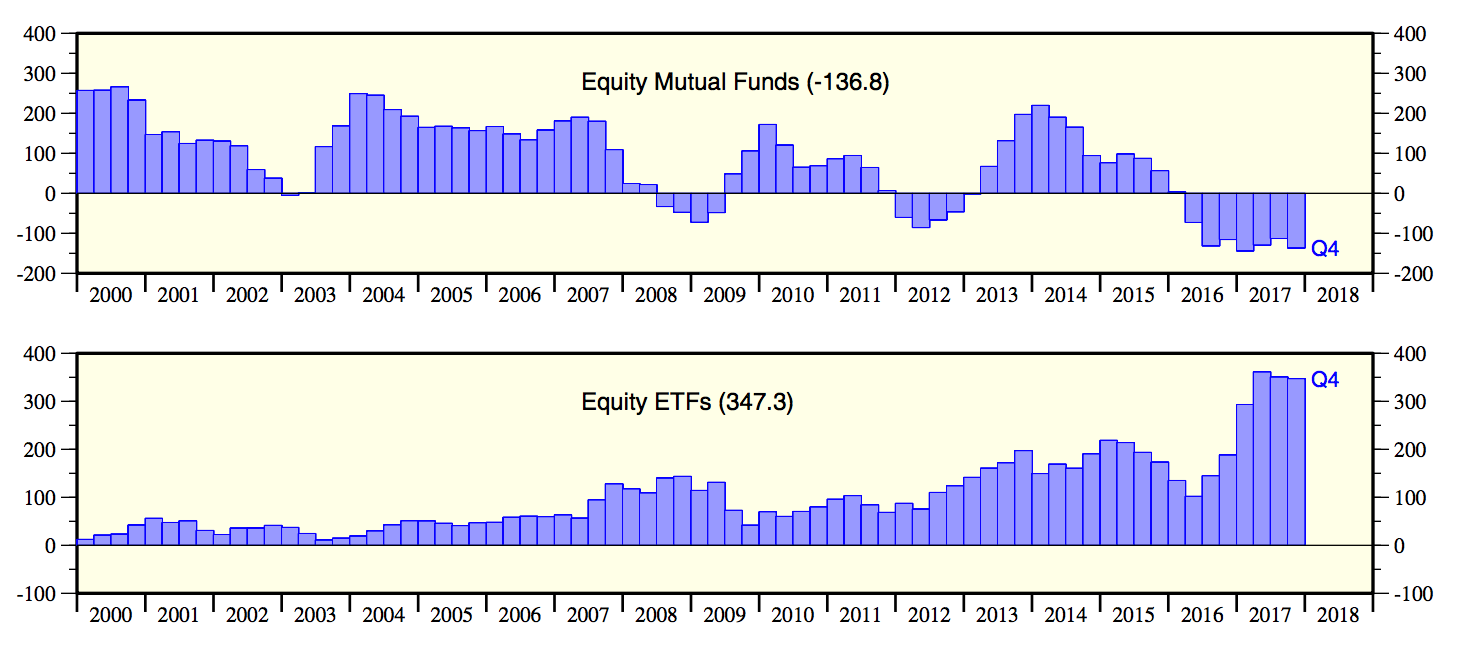
Bunk – Inflows into equities (ETFs) have been accelerating since 2012 and are now at a record level.  Equities held on margin are at an all time high as well so not only are flows strong but current holdings are leveraged!  This is a chart from Yardeni Research posted yesterday, shown in $Billions.  Maybe the authors of this article are only looking at Mutual fund flows?  I don’t know.
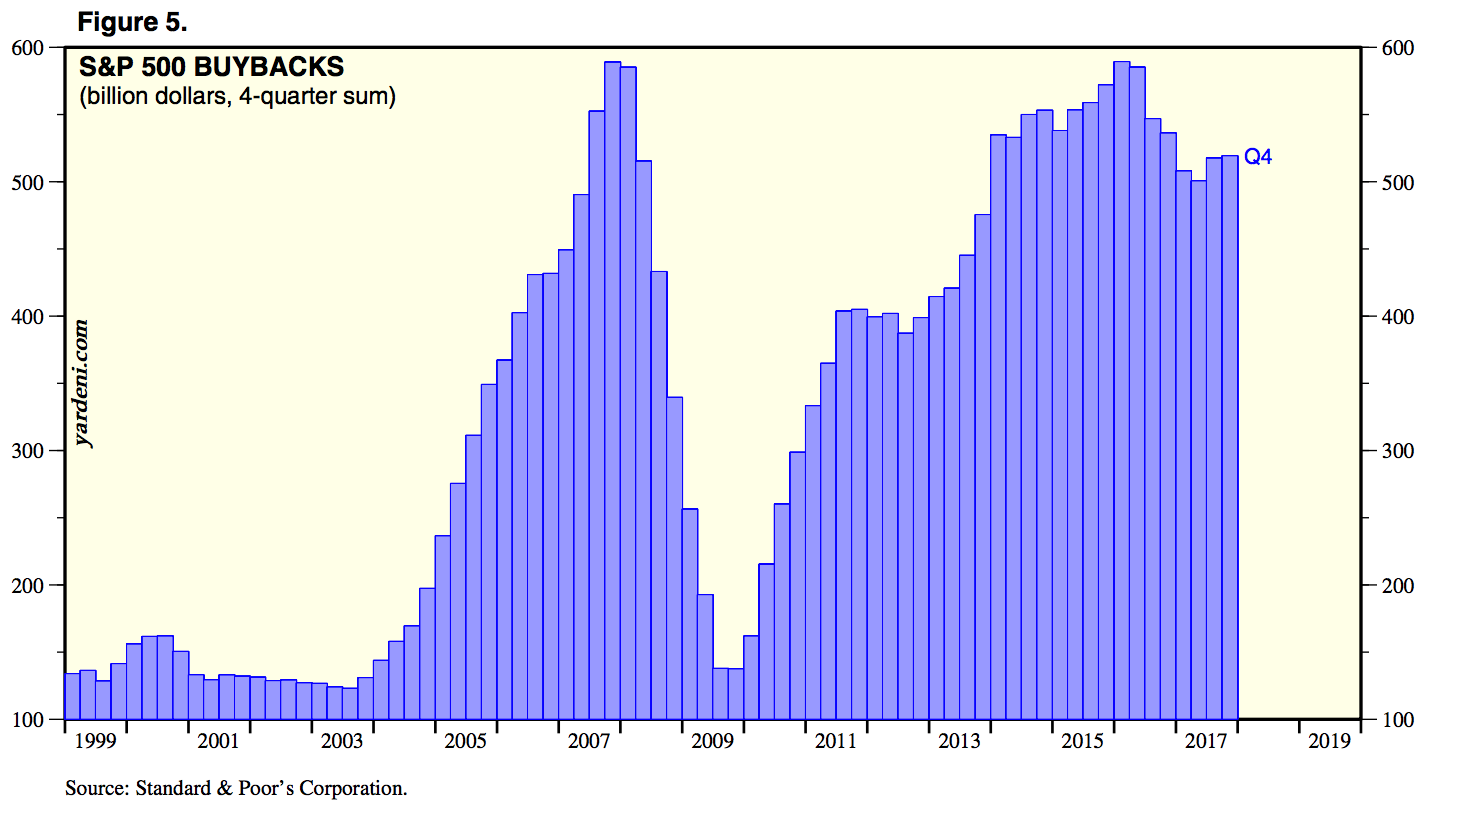
Overall, U.S. households have $900 billion less invested in stocks than in 2007, according to Goldman Sachs research, leaving buying by U.S. corporations now the greatest driver of demand.

This is true and very concerning.  Share buybacks by corporations are now a major market “investor” and source of price support during bull markets.  They love to buy the dips of their own companies during bull markets as it has the effect of boosting EPS (earnings per share).  That’s great as long as corporate cash flow remains strong.  But like we saw in 2007 and 2008, buybacks end when cash flow isn’t there and has the effect of removing one of the biggest “investors” in stocks.  Share buybacks have been the number 1 driver of stock price appreciation in the current bull market.  We need to watch this closely now. Another chart from Yardeni.
In 401(k) retirement plans, meanwhile, investors now hold an average of 52.4 percent in equity-only funds, down from the 64.7 percent they held in 2007, according to Fidelity.

Instead, investors now hold an average of 33.2 percent of their assets in blended target-date funds that combine stocks, bonds and cash based on a person’s expected retirement date, more than double the 14.5 percent of assets invested in the category in 2007.

Here again, we have a situation of new products sucking money out of “old” things like pure equity funds.  The average 401k investor loves a good packaged product like target-date funds.  It is the quintessential move to “Set it and forget it”. When we don’t know which equity-only fund to choose, that thing that says “Retirement 2030” looks good because hey, I plan to retire in 2030!  This is about packaging and not an accurate measure of investor confidence or sentiment in any way.  I will say this forever, but anything that looks or smells like a target date fund is going to generate poor returns for investors looking forward, especially those at or near retirement.  Treasury Bonds are dead money for a while and they are a big part of any target-date fund inside of 2025.

The decline in the assets invested in stocks comes even as investors have largely benefited from the recovery in equity prices. The average 401(k) balance at the end of 2017 was $104,300, up 112 percent from the average of $49,000 at the end of 2008 and up 54 percent from the pre-crisis average of $67,600 at the end of 2007, according to Fidelity.

If these are real average balances, we should be investing in cat food because there will be high demand for this product among retirees.

“There just doesn’t seem to be the same level of interest or animal spirits” among investors now for equities, said Mark Paccione, director of investment research at Raleigh, North Carolina-based Captrust Financial Advisors, which oversees $250 billion in assets.

Clients are much more concerned about the effect of rising interest rates and inflation on their bond portfolios, he said.

“They’re very worried we will have a bear market in bonds and direct almost all of their focus there,” he said.

And yet they are buying target-date funds that are chock full of Treasury bonds?

ERA OF STOCK-PICKING LOOKS OVER

Bunk – it’s just beginning.  Stock pickers and active managers outperform when volatility rises and markets (index funds) run into trouble.  We have just completed the longest period of extreme low volatility in history.  It’s now over as of January 26th, 2018.  Bet on stock pickers and active managers from here on out.

Investors are not only holding fewer assets in stocks overall, but those dollars that are invested in the market are increasingly likely to be put into index funds or exchange-traded funds that track broad indexes rather than in individual shares or funds that are run by a stockpicker.

Agreed, until the next bear market when all index funds will be sold in panic.

Financial advisors say that the push is driven by clients who lost trust in the ability of professional fund managers after nearly all of them failed to anticipate the financial crisis.

“Index investing is more prevalent than it’s ever been, and that’s because active management didn’t protect you from losses during the crisis and has underperformed over the last 10 years,” said Matt Hanson, a senior wealth advisor at Los-Angeles based Kayne Anderson Rudnick, which oversees approximately $18.9 billion in assets.

Classic stereotyping from an index shop.  Some active managers did very very well and continue to keep pace with this bull market.  You just need to find them.

Passive funds now comprise about 46 percent of total mutual fund and ETF assets, compared with just 8 percent in early 2008, according to fund-tracker Morningstar. There are now 1,400 passively managed equity mutual funds and ETFs, with a total of $5.4 trillion in assets, compared with 707 funds holding $1.2 trillion in 2007, according to Lipper data. That push toward passive investing has helped make index-based fund providers BlackRock Inc and privately-held Vanguard the world’s two largest money managers.

The growth rates of the trading of options are accelerating faster at brokers such as E-Trade Financial and TD Ameritrade than they are for the trading of individual equity shares, said Mac Sykes, an analyst at Gabelli & Co. Monthly stock trading volume for the NYSE Group, meanwhile, was 43 percent lower in 2017 than in 2007, according to NYSE data.

Instead of the day-traders of the 1990s dot-com craze or the house-flippers of the mid-2000s, small-scale investors say they are looking for cryptocurrencies such as bitcoin to deliver the outsized returns they no longer believe the stock market can deliver.

Bitcoin is down -64{1de7caaf0b891e8de3ff5bef940389bb3ad66cfa642e6e11bdb96925e6e15654} in the last three months.  Outsized returns?  You’re outside of your mind.

Layla Tabatabaie, an entrepreneur and advisor to tech startups who lives in New York, began investing in initial coin offerings, or ICOs, about a year and a half ago, she said. She now holds the majority of her portfolio in cryptocurrencies, which she sees as offering the possibility for greater gains.

“The way that I see crypto as being more favorable than stocks is it seems like there is more of an opportunity for retail investors to get in earlier,” she said. “Crypto now is taking the place of the way stocks used to behave 10 years ago, 15 years ago.”

Layla!  How old are you?  There is no chance you were investing 15 years ago.  I’m guessing you were in middle school around then.  Cryptos and stocks are not behaving the same in any way looking at any period of time.

This is a crazy quote but maybe an appropriate finish to a crazy article.

The market downtrend is accelerating and we’re now working to complete the retest of the February 8th lows that I spoke of on February 9th.  There is no reason to stick your neck out by trying to buy the retest (2529 on the S&P 500).  I think the odds are still reasonably high that the lows will not hold.  We are heavily in cash and will remain there until we see more signs that selling pressure is gone before looking for new entry points.

Rest easy this weekend and be careful about what you read – OMG!

Cheers,

Sam Jones

WHERE ARE THE OPPORTUNITIES TODAY?

Where Are the Opportunities Today?

It’s sort of bizarre for me to hear how so many are planning to just “sell everything” or may have already done so. Investors only seem to consider two options with their money – all in (index funds) or all out. Contrary to the last post which covered the somewhat bearish view of the markets from SIC 2018, I’m going to offer a round of relief for investors with this update on current and future opportunities. Remember, it’s a market of stocks, not a stock market.

Review of the BIG THREE OPPORTUNITIES

At the end of last year, we covered three big opportunities for investors in a three-part series. They are as follows, and these are all still very valid and working quite well in terms of providing risk-adjusted portfolio returns. Risk-adjusted is a code word for returns with limited downside risk.

  • Overweight Emerging Markets, Japan, Asia and Europe
  • Rebuild Commodities and Inflation Hedge positions for a trade
  • Avoid the next bear market in US stocks (and buy aggressively at the lows)

Just that easy, right?

Actually, it’s not really that hard once your free yourself from the shackles of what everyone says you should own in your portfolio.  I’m talking about a willingness to own an unconventional portfolio of investments with heavy positions in things like Commodities, Inflation Hedges, and Emerging Markets.  I see hundreds of investment portfolios every year (not-managed by ASFA).  They own the same thing 100{1de7caaf0b891e8de3ff5bef940389bb3ad66cfa642e6e11bdb96925e6e15654} of the time.  60{1de7caaf0b891e8de3ff5bef940389bb3ad66cfa642e6e11bdb96925e6e15654} in stock index funds, which include about 10{1de7caaf0b891e8de3ff5bef940389bb3ad66cfa642e6e11bdb96925e6e15654} internationals, 30{1de7caaf0b891e8de3ff5bef940389bb3ad66cfa642e6e11bdb96925e6e15654} in Treasury bond index funds of some sort, and 10{1de7caaf0b891e8de3ff5bef940389bb3ad66cfa642e6e11bdb96925e6e15654} cash or real estate.  I NEVER see a portfolio with any commodities or emerging market exposure.   Larger portfolios tend to own more individual names but here again, they are mostly Dow Jones Industrial Average stocks + Facebook and few banks.

We are repeatedly taught, told, and or guided by industry experts/ managers that you should just keep it simple, own a few index funds, “set it and forget it”.  There are indeed long periods of time, where this works well and a basic blend of index funds is hard to beat.  The last 5 years has been exactly that period of time.  But the next 5 years will not provide the same experience unless you believe that stocks and bonds go up forever in uninterrupted bliss.

Just NOT that easy, right?

In our shop, our clients pay us to manage market risk and purposely adopt unconventional portfolio holdings when market conditions tell us to do so.  Sometimes, that means we should just own indexes as we have done largely for most of this bull market.  But sometimes, that means we need to own big positions in Emerging Markets, Asia, Commodities, carry higher cash and go lighter on US equities as we are now.  In summary, the landscape of where opportunities lie is pretty obvious, but the hard part is getting yourself to act on that information when it’s a bit unconventional.  Remember that avoiding a big loss by systematically moving to cash is also an opportunity – to buy low with your capital intact!

Other Opportunities

In this section, I’m speaking specifically to opportunities within the US market at the sector and individual company level.  One could conceivably hate the US stock market as a whole, own zero index funds or even short the market, while still accumulating longer-term positions with far greater upside potential.  Let’s dive into those.

Real Estate

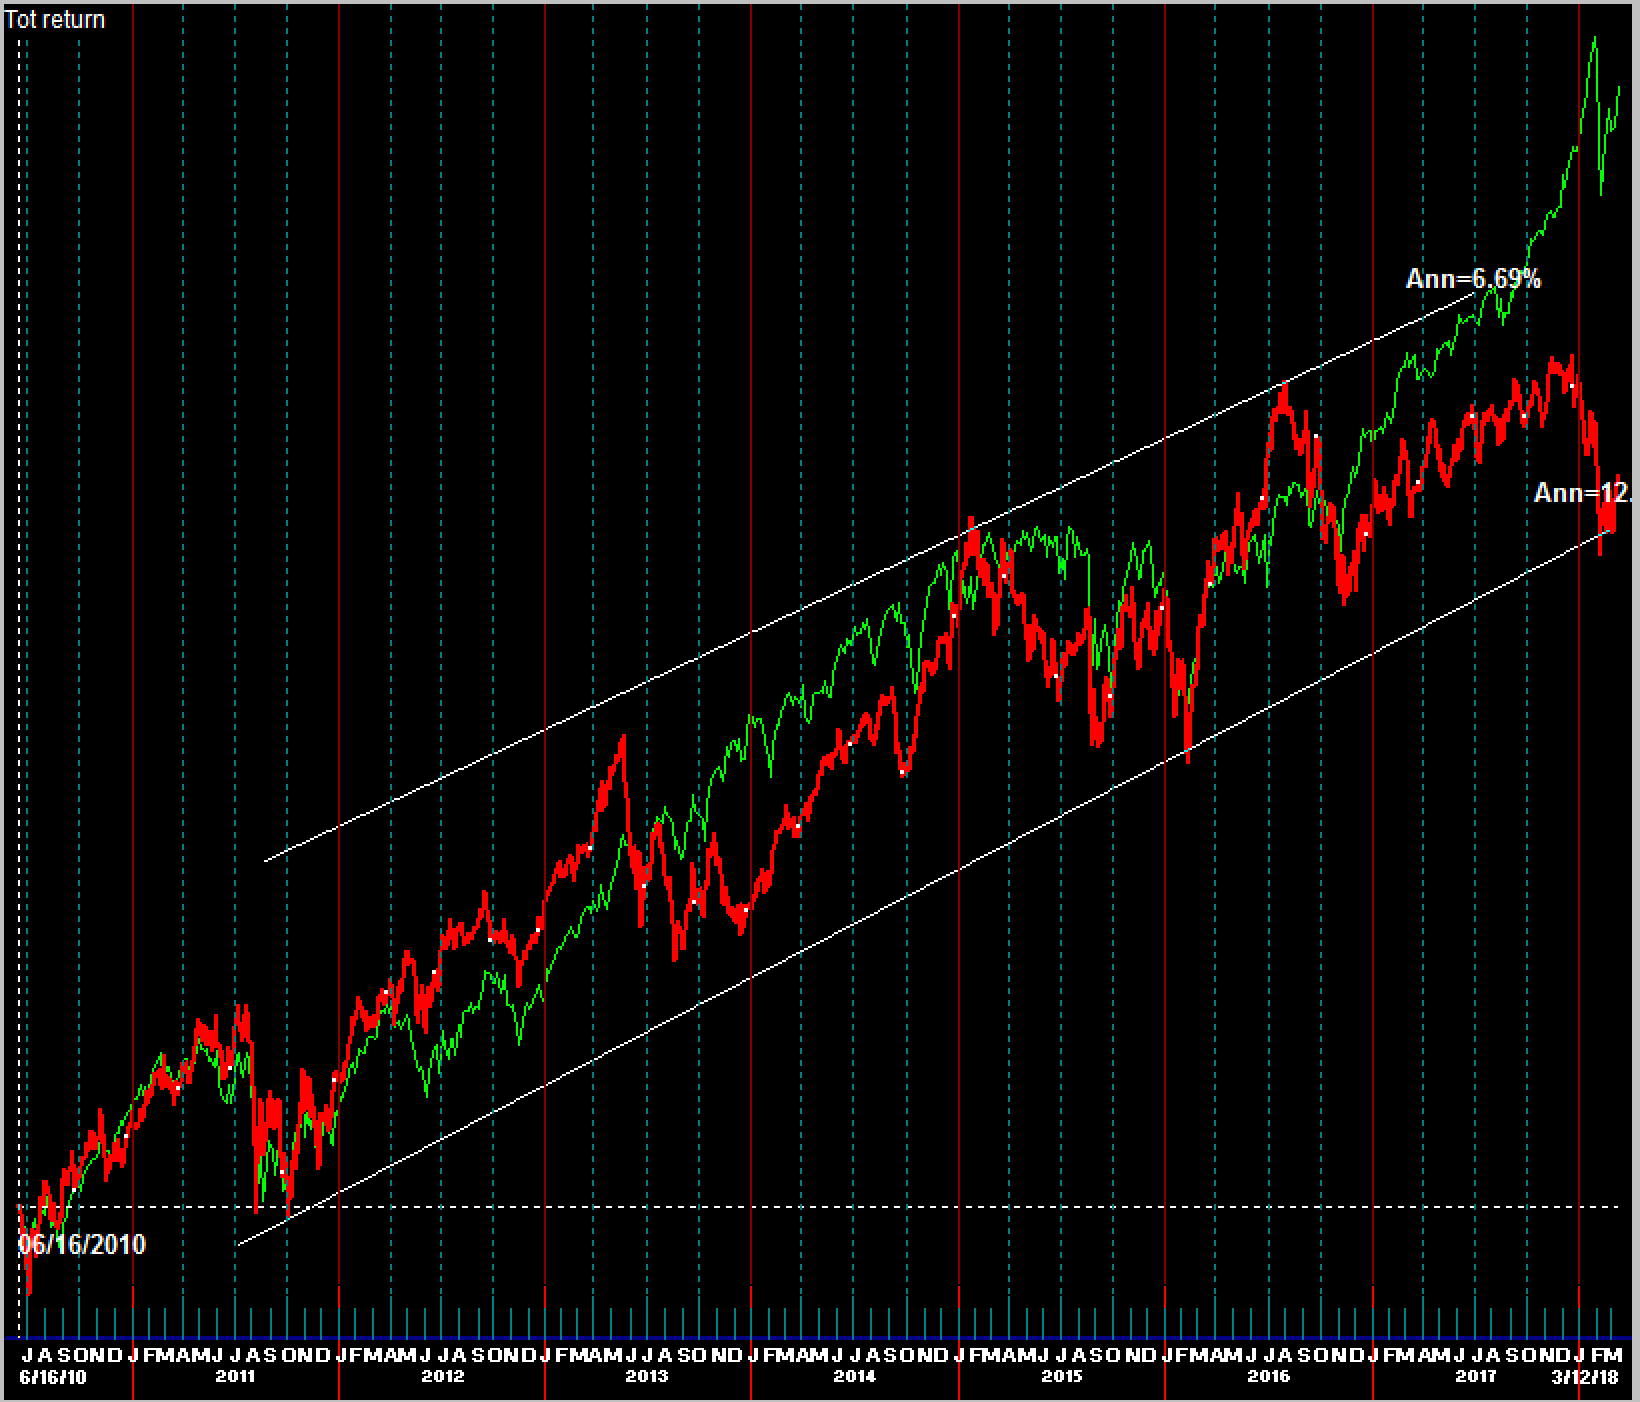
We like real estate at this level as a bit of a contrarian play on the mass consensus view that interest rates will go vertically higher from here.  We are not going to see a vertical move in rates at any time soon but rather a long slog higher over years; just like the last 6 years honestly.  Rates will drop periodically especially as stocks run into trouble and we seem to be approaching that situation now.  I doctored up this chart of real estate using the IYR ETF in red and compared it to the S&P 500 index shown in Green.  Obviously,  the two have been tracking each other nicely since 2010, until the end of 2017 when real estate fell out of favor.

Here’s why we like real estate now as an addition to our “alternative” baskets:

  • Real estate does not typically have a high correlation to rising interest rates.  In fact, real estate as a sector is often the beneficiary of some inflationary pressure, which we’re seeing now.
  • The supply/ demand equation for real estate and homebuilders is still very attractive, nowhere near the situation we had in 2006.
  • This particular ETF (IYR) also pays about 4{1de7caaf0b891e8de3ff5bef940389bb3ad66cfa642e6e11bdb96925e6e15654} in annual yield and is still annualizing over 9{1de7caaf0b891e8de3ff5bef940389bb3ad66cfa642e6e11bdb96925e6e15654}/ year.
  • It is currently trading at the bottom of a multi-year, well-defined price channel, which offers us a technical entry point.
  • Real estate is an “unconventional” holding (see above).

Next-Generation Opportunities

Students of cycles know that innovation moves in an upward sloping S-curve as it goes from early adopters to mass acceptance to maturity.  Today, I see a lot of technology companies that I would put on the “mature” side of the curve where upside growth is probably limited.  Apple and Netflix come to mind.  Conversely, we are far more interesting in the near tidal wave of companies on the very early adopter side of the curve.  These are the “disruptors” that we all have heard of but might not have used them ourselves.  These are the very companies that we invest in via our New Power Fund (Innovators, Facilitators, Game Changers, Integrators, Disruptors).  There are a ton of them, some just coming to market as IPOs, others are being bought by incumbent IT companies.  These are the type of companies on the front edge of the S-curve with enormous opportunities.  Please do your own homework on specific companies. This is not a recommendation to buy any specific company at this time.

  • 3D printing
  • Cyber Security
  • Cloud Based Enterprise Software
  • Automation and Robotics in products and service
  • Blockchain technologies and applications – Oh my this is big
  • Energy Storage/Transmission Solutions
  • Smart Home / Smart City/ Smart Car
  • The Internet of Things

As we heard from the SIC speaker notes in the last update, this is a critical time for the markets.  We believe that conditions have changed toward an environment where the trends of the past may be reverting on a different path.  In some areas, that might be a new surge of strength and in others, the opposite.  What appears obvious is the reality that what has worked well last year or since elections, is not going to be very productive in the months, quarters (years) ahead.  It is time to adapt to the new environment, respecting opportunities and new risks where they are today, not where they were in the past.

Stay tuned

Sam Jones

VERY IMPORTANT MOMENT FOR MANY MARKETS

VERY Important Moment for Many Markets 

         I haven’t written in a while because there has been nothing new to write about.  The rebound off the lows in mid-February continues.  However, all except the Nasdaq 100 remain 2-3{1de7caaf0b891e8de3ff5bef940389bb3ad66cfa642e6e11bdb96925e6e15654} below the peak set on January 26th.  Now we have something important to say about an approaching critical moment for many “markets”.

Notes from SIC 2018 

I spent about 15 hours last week, tuning into the live streaming presentations from the latest Strategic Investment Conference 2018.  Their speaker line up is made up of exceptional talent, independent thinkers and highly experienced market people who are managing serious assets.  They did not get where they are because they are posers.  No these guys and gals are the real deal offering me an opportunity to open my mind and just listen.  After distilling my notes several times, I worked up a short list of common themes among the various presentations.  Key presenters for me were, Gundlach, Rosenberg, McWilliams, Yusko, Lacy, and Dillian.  Here are my distilled themes and a bunch of important charts from their presentations.

US Equities

No real conviction, but generally bearish looking forward, especially in the 2nd half of 2018.  We are clearly in a late stage environment where the risk to reward ratios are flat at best.  Interest rates, gold, the US dollar, US stock market, and key sectors are all approaching a critical level.  Either current trends will accelerate or reverse course.  Investors need to be ready to deploy a relatively UNCONVENTIONAL investment portfolio if this level proves to be a major inflection point.  Several were quietly suggesting that 2018 will be a mildly negative year in the end.

Recession Risk  

No signs of a recession until 2019 at this point but stocks could easily peak (top of the 9-year bull market) in 2018.

US Treasuries

No conviction but generally bearish as inflation is heating up with strong consensus among indicators.  Short-term rates are becoming more relatively attractive as yields are now in their 6th year of moving up. A move above 3.22{1de7caaf0b891e8de3ff5bef940389bb3ad66cfa642e6e11bdb96925e6e15654} on the 30-year Treasury bond or above 3.00{1de7caaf0b891e8de3ff5bef940389bb3ad66cfa642e6e11bdb96925e6e15654} on the 10-year bond would likely correspond with a top in stocks and new long-term trend higher in rates.  There is a consensus among the presenters that our current exploding deficits, debt to GDP combined with the late stage of the business cycle, Fed tightening on rates as well as the “wrong direction” White House policies toward protectionism and trade barriers, are a perfect storm for the End Game in the debt supercycle.  Translation – be very flexible with your money, assumptions, stay liquid, and be prepared for some very high volatility in the credit and stock markets.

High Yield credit (all around) – disaster – do not touch,  3rd rail stuff.  High conviction to stay away.  Default rates and spreads may be turning higher right now.  Typical reset period for High yield to become attractive again from these levels is about 24 months.

Sectors

Expect relative strength to continue in Materials, Industrials, Technology, Commodities, and most late-stage cycle leaders.  Financials, Banks, and Tech are the drivers of the US market.  Technology is the most vulnerable looking forward.

Real Estate

Low conviction either way – headwinds of rising rates on REITS and Real Estate but most do not see the type of excesses in supply/ demand that we saw in 2006/2007.

International Investing

VERY high conviction for Japan, Developing Europe, Asia and Emerging Markets.  Modestly high conviction for Europe and China (except Yusko who still loves China).  The dominance of these markets over the US market began in late 2016, ironically as Trump is trying to Make America Great Again.  The US is losing the race to foreign countries across the board.  Valuations are almost ½ that of the US for international investments and thus far a falling US dollar is only accelerating relative performance (favoring internationals).  Europe is the least attractive of the bunch but still better than the US.  Overweight and hold Emerging markets but need to manage currency risks to performance.

Portfolio Construction

The more forward-looking managers are de-risking their portfolios now and have high confidence that US stocks will be in a bear market within 12 months.  They have been admittedly early in the past.         Several spoke off the cuff to the structural risks in portfolios construction today and the mass adoption of packaged asset allocation products (things like “Target Date funds, Lifestyle funds and many of the offerings you see in 401k plans, pension plans, etc).  These packaged funds rely on an inverse stock/ bond relationship that may be coming to a long-term end.  Stocks and bonds won’t move in opposite directions looking forward as much as they did in the past.  Personal note- we saw this happen in February (bonds and stocks both lost dramatically in sync).

Commodities are now offering a nice diversifier to portfolios for the first time in many years.

Gold is at an inflection point with the US dollar and interest rates.

That’s about it!

A Few Charts That Spoke To Me

Big thanks to Jeffery Gundlach of Double Line and David Rosenberg of Gluskin Sheff for these:

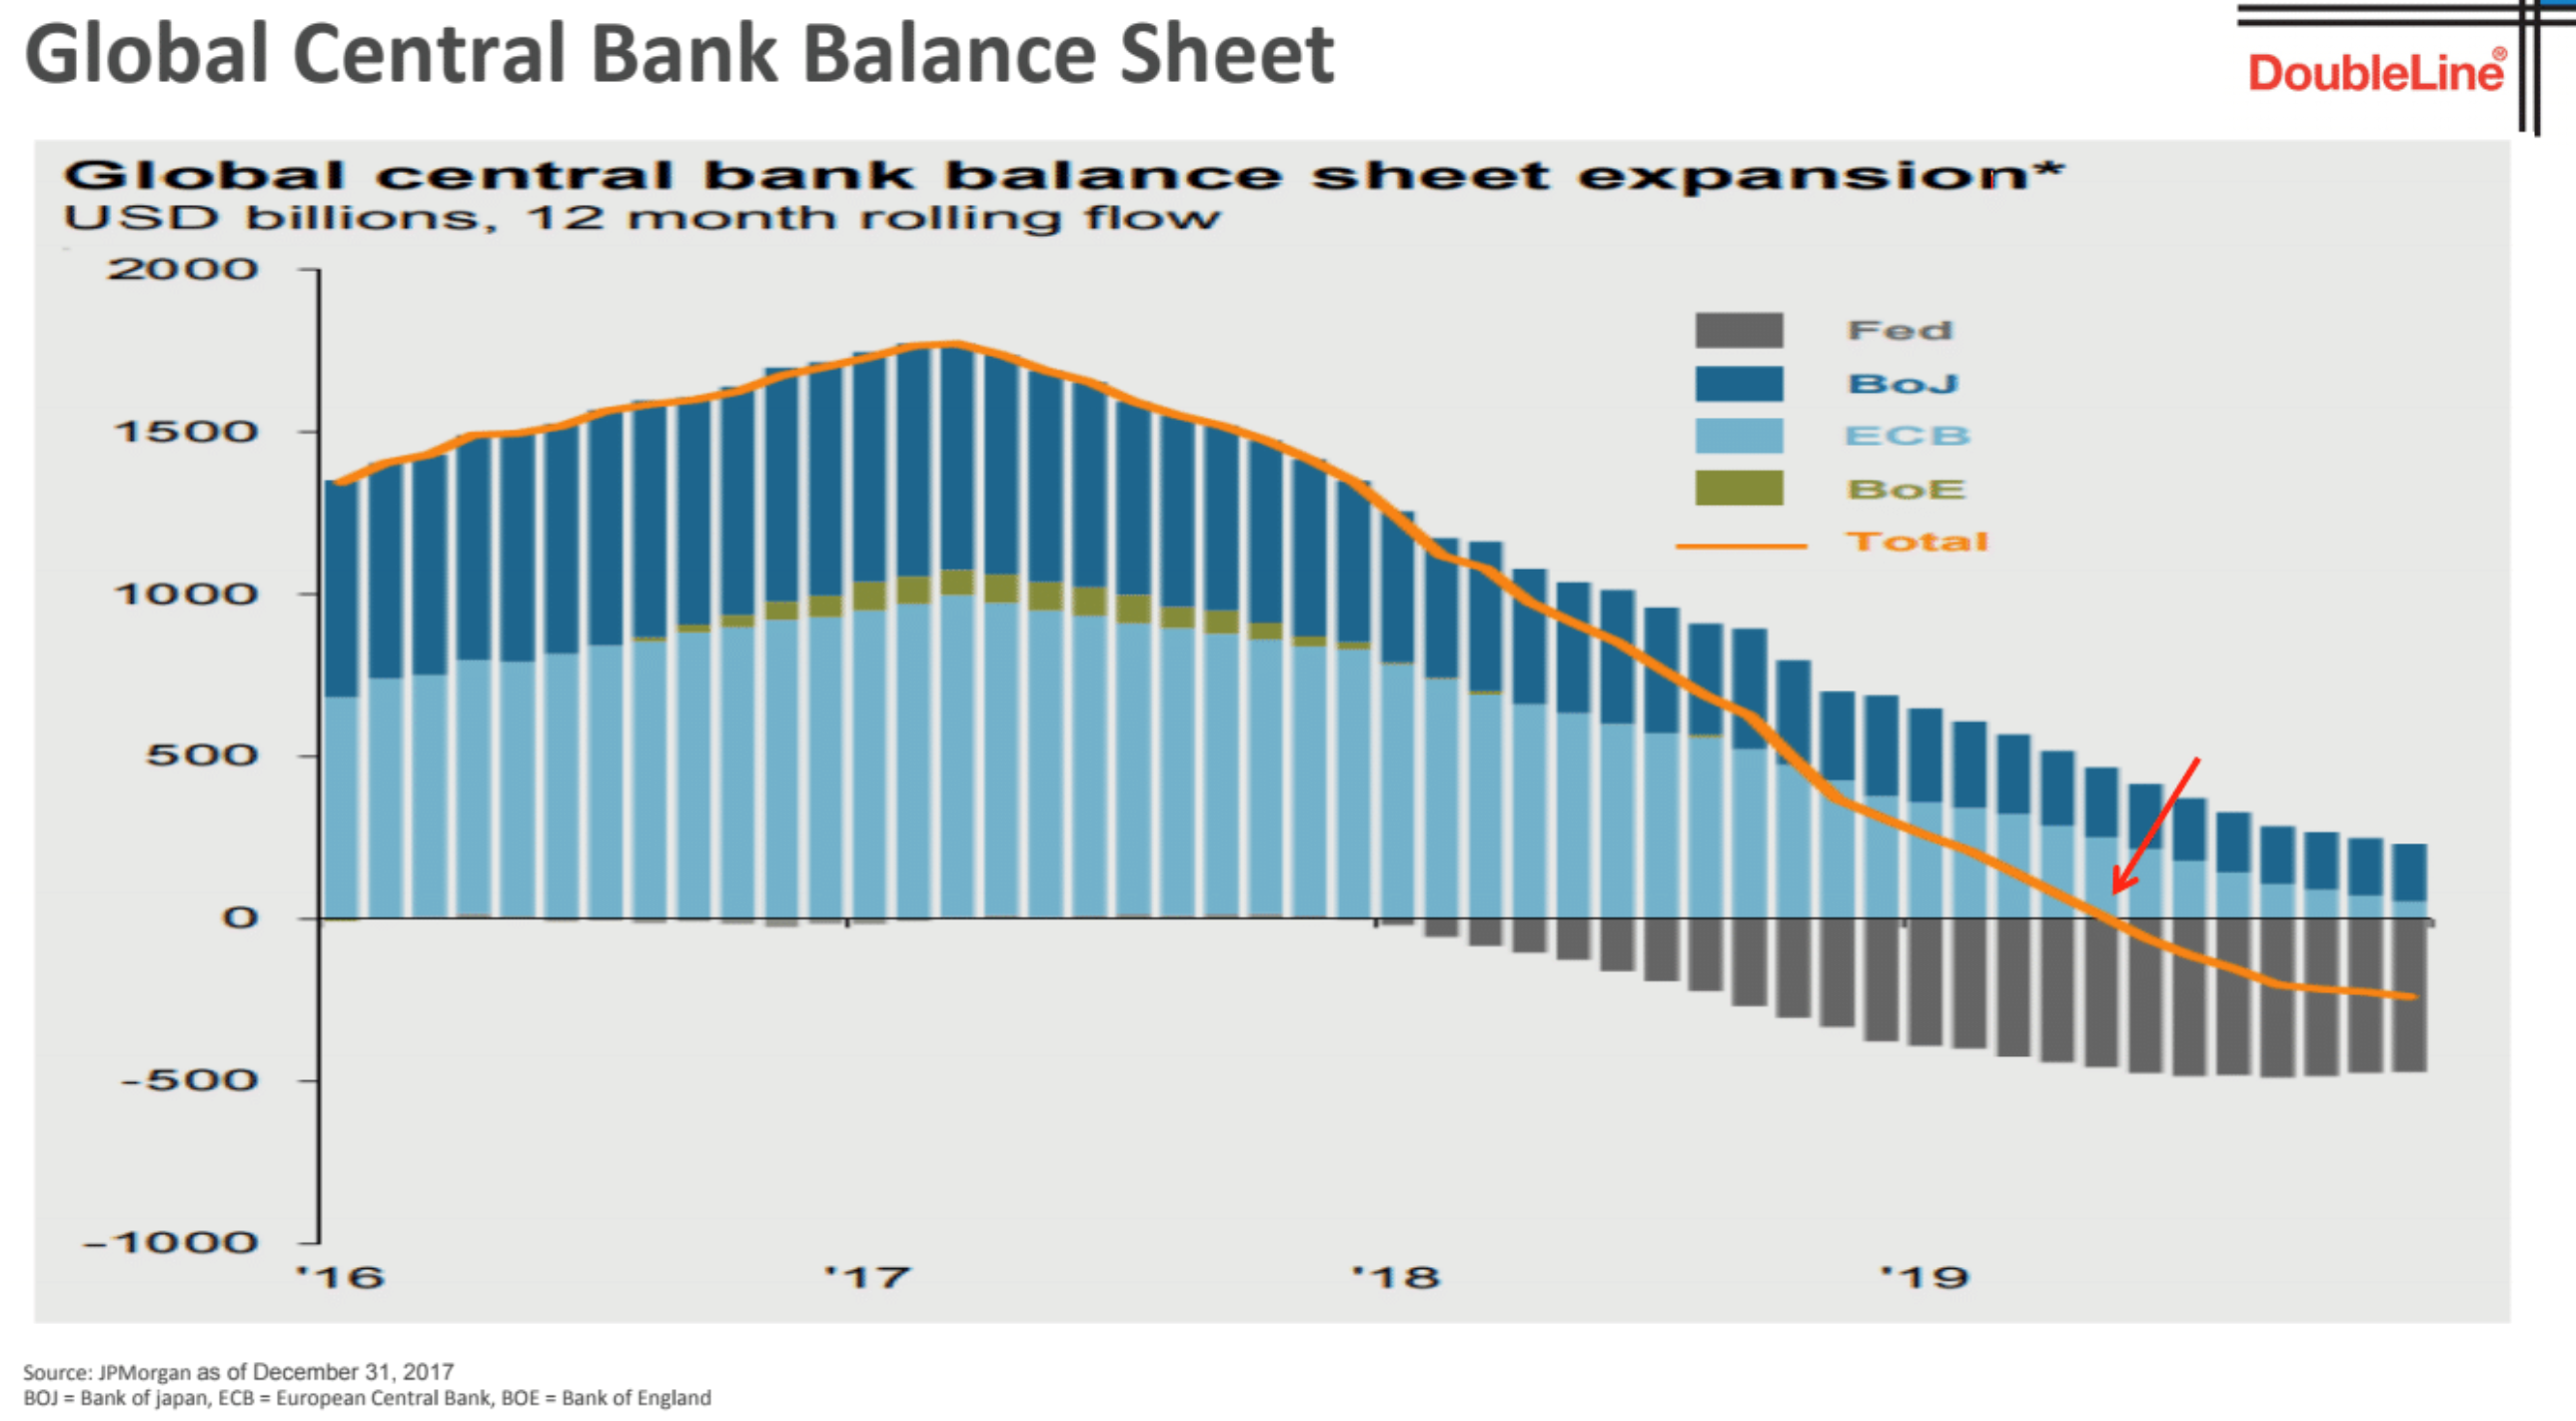
Note,  equity market performance is highly correlated to central bank balance sheets.  Expansion = more liquidity and stock prices rise (and visa versa).  Central banks are taking away liquidity globally now.  2019 looks like very tough sledding for stocks.

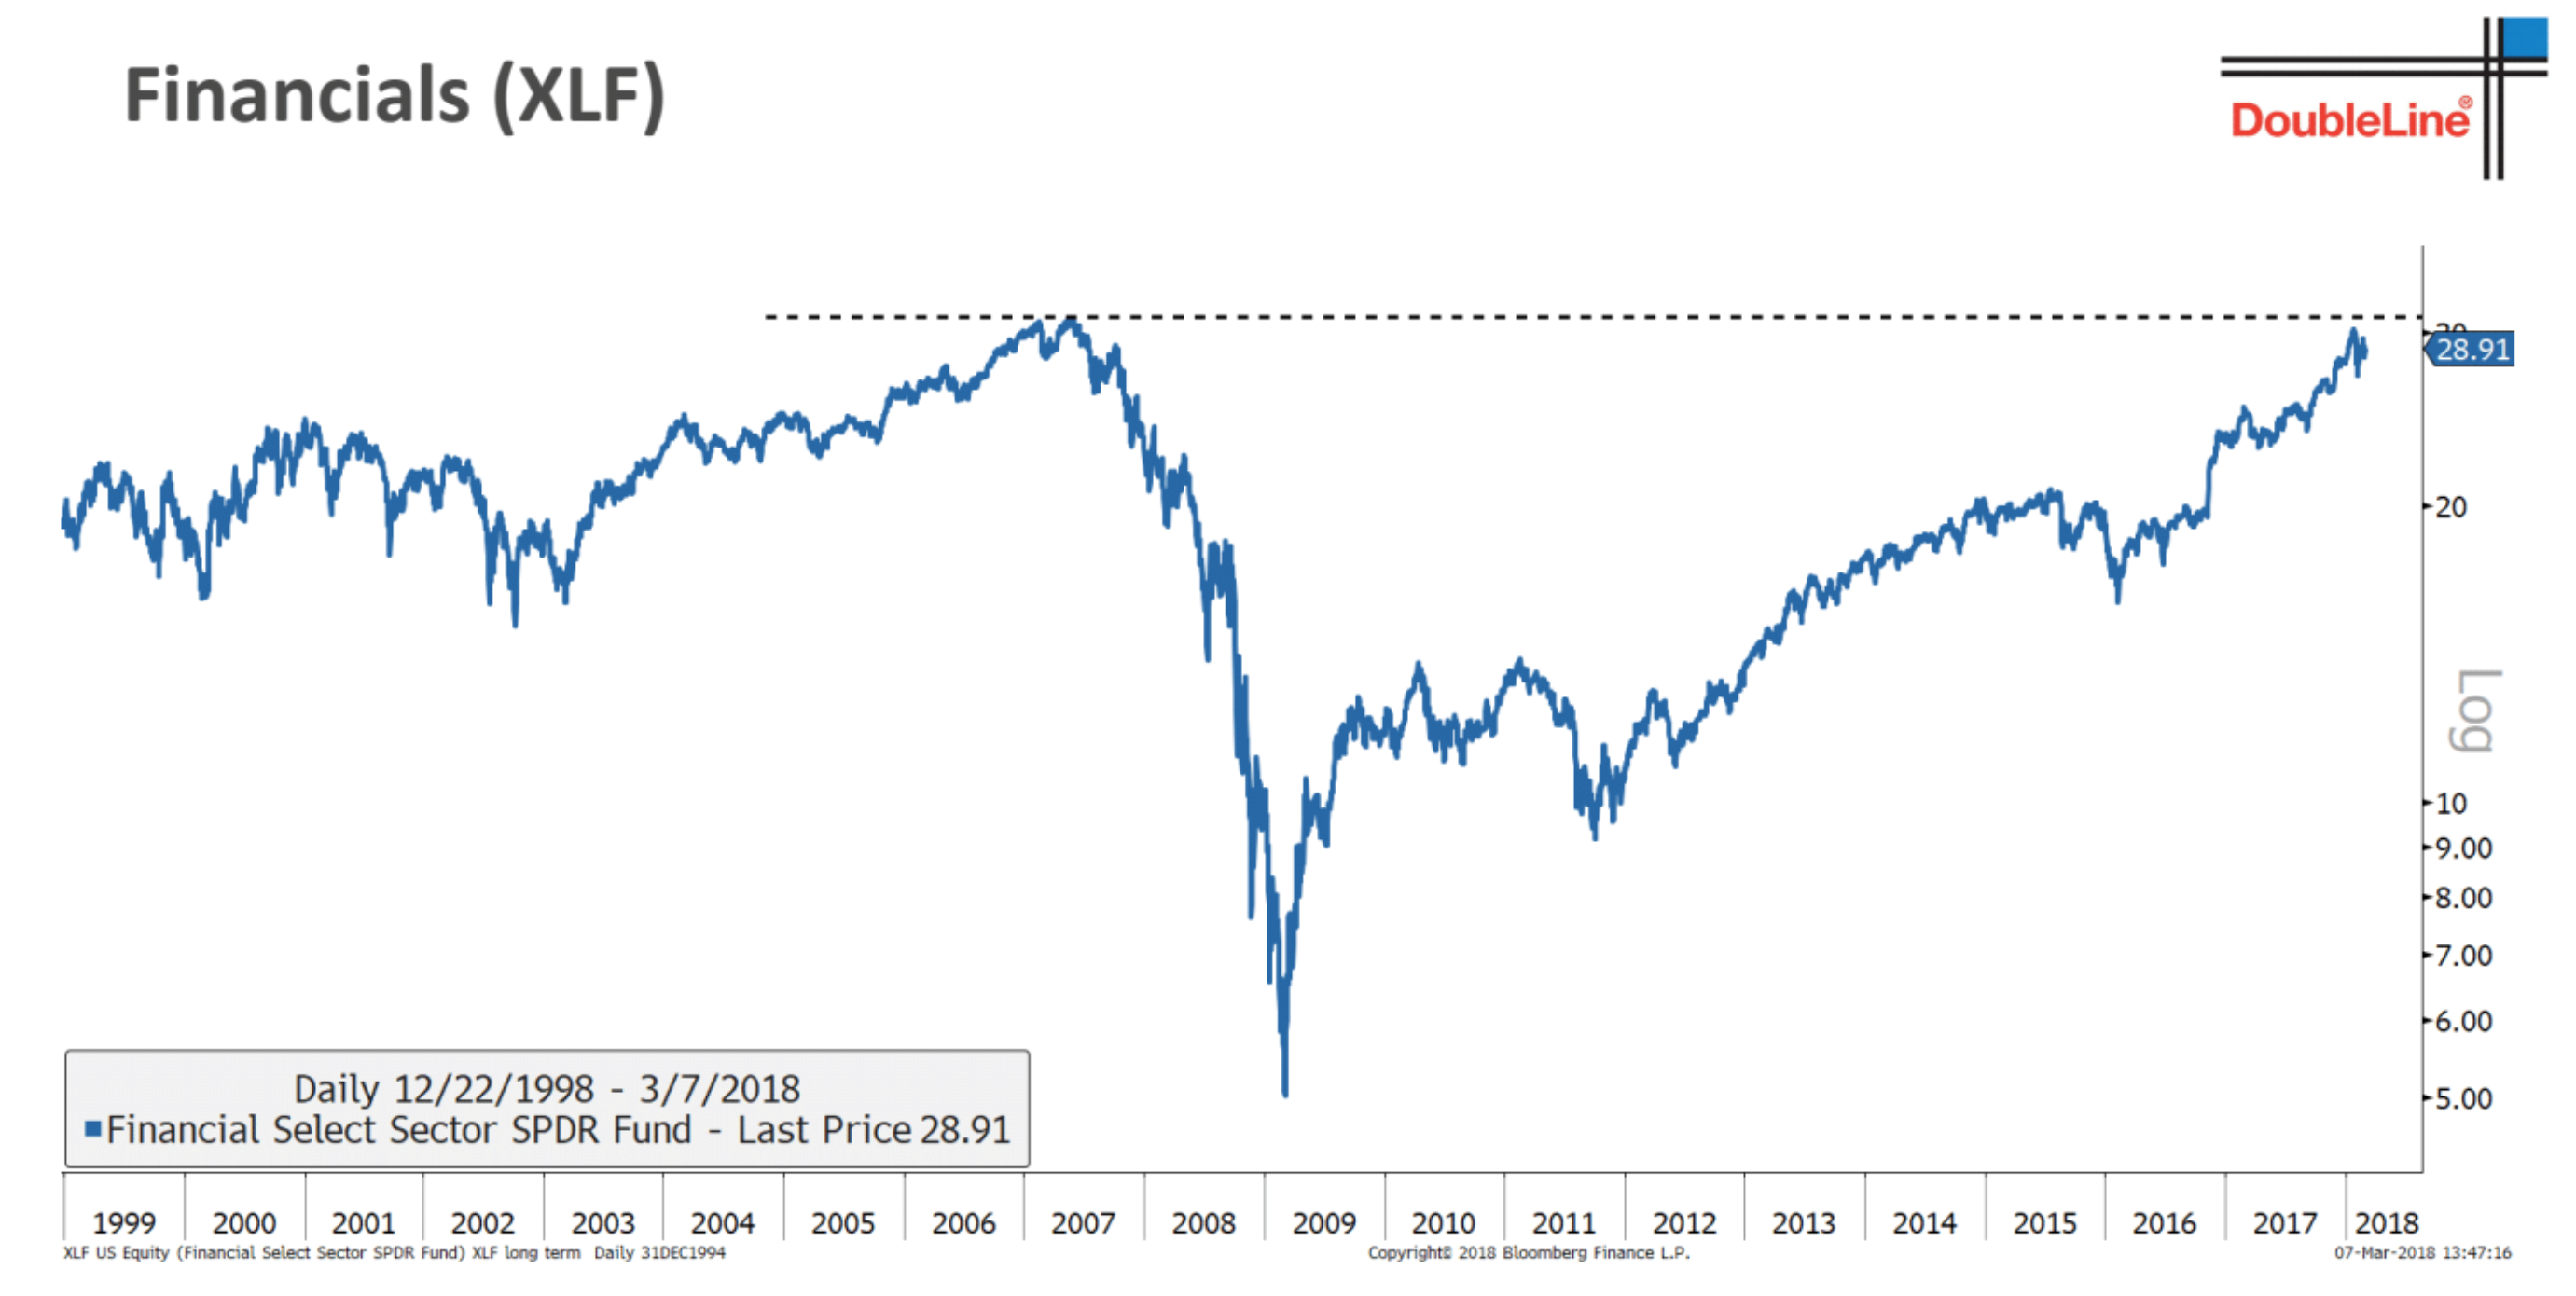
Financials are leading the markets but just now approaching a key level of resistance.  Make or break moment for the markets?

          Same for Semiconductors – long-standing “market” indicator.  Also approaching a critical resistance level.

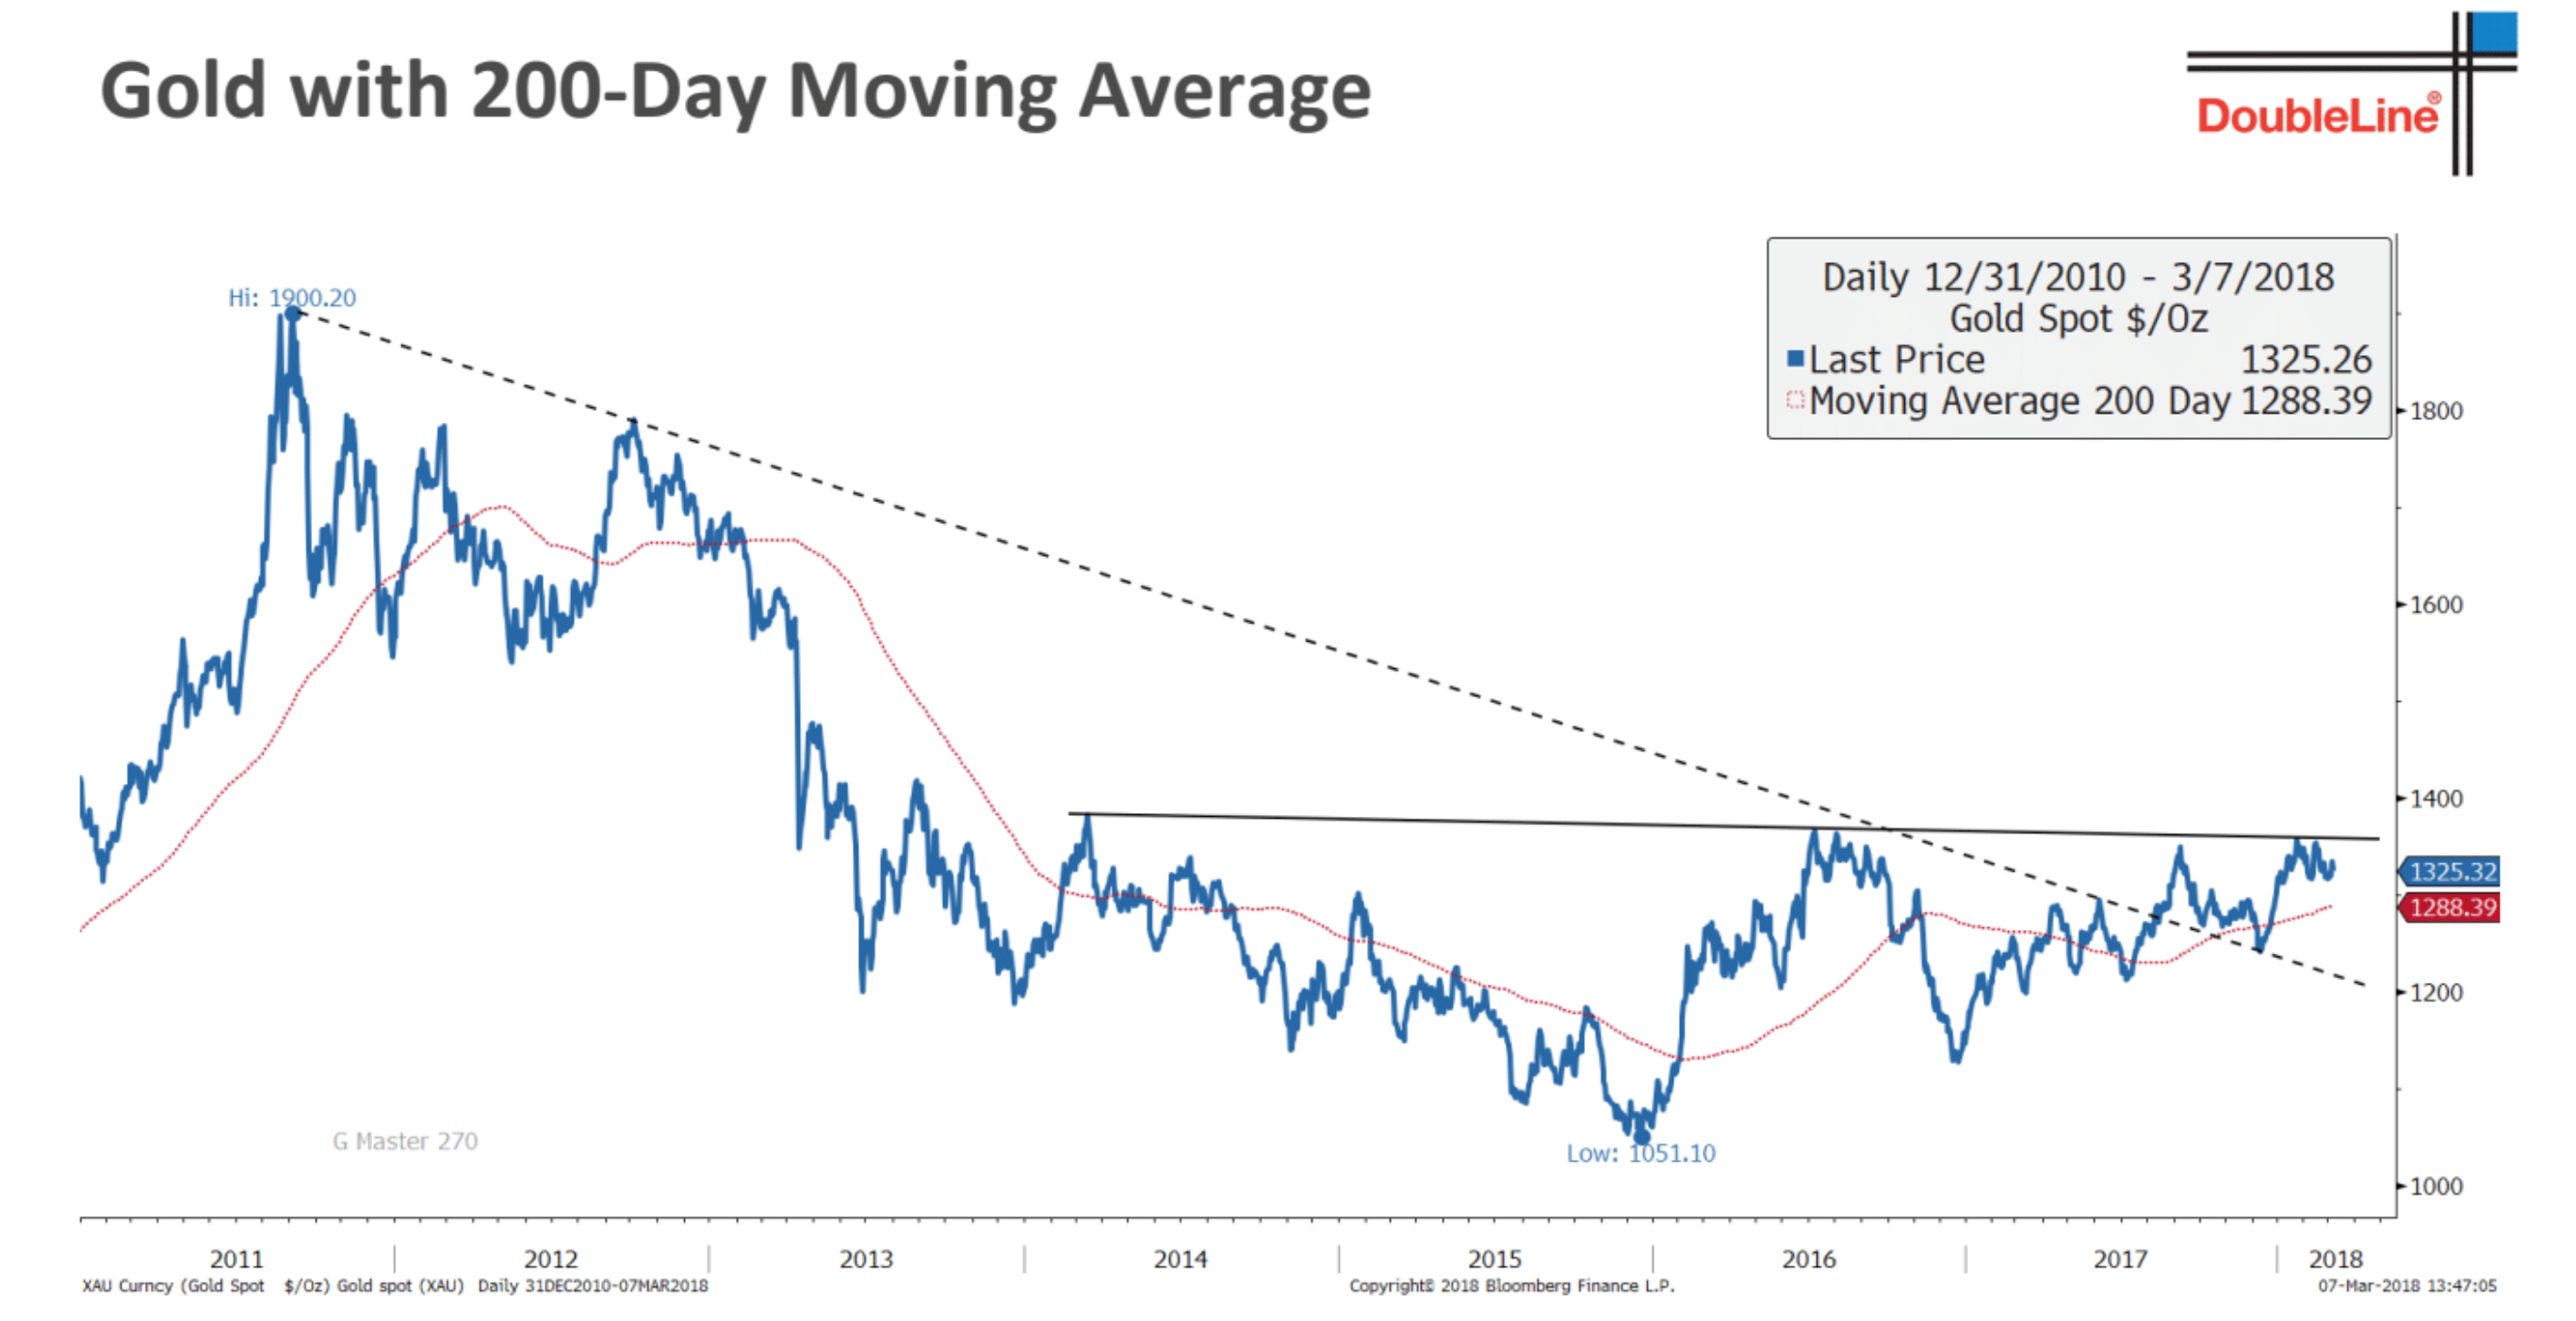
Same for Gold – At an important level.  Speaks to currency, fear, and interest rate risks in the system.

This one is a little more technical but it shows the ratio of the 10 year Treasury bond yield to the S&P 500 index.  We don’t want to see this line rising and a break above the horizontal line marked above would indicate trouble for stocks (rates are rising faster than stocks).  This indicator topped in early 2009 almost exactly corresponding to the last bottom in stocks.  Another thing that is now approaching an important inflection point.

          Did the US market already hit it’s 2018 upside target – on January 26th?  Crazy days.

This chart shows the annualized gains in the S&P 500 during previous bull markets – average 16.8{1de7caaf0b891e8de3ff5bef940389bb3ad66cfa642e6e11bdb96925e6e15654}/ year with an average Nominal GDP of 7.1{1de7caaf0b891e8de3ff5bef940389bb3ad66cfa642e6e11bdb96925e6e15654} and real GDP of 3.8{1de7caaf0b891e8de3ff5bef940389bb3ad66cfa642e6e11bdb96925e6e15654}.  While the gains and “months” of the current bull market are consistent with those of the past, it has done so with less than half of normal GDP growth.  Share buybacks, rather than real earnings have been driving excess returns in this bull market but that’s a longer story.  Share Buybacks are likely to end for all but the very largest mega-cap companies.  Earnings and real GDP growth are going to have to start justifying these valuations or prices will fall.

Last One

Is this is the top of the corporate credit cycle?  Shaded areas represent recessions.  We’re probably close, give or take a few months or quarters.

That’s it for today.  Needless to say, we’re staying flexible with our holdings and assumptions about the future, ready to de-risk our portfolios if need be and watching all of these lines in the sand very carefully.  We’ve been glad to be your partner in wealth accumulation over the last several years as our greatest value now angles back toward wealth preservation.  Create Wealth/ Defend It as our motto states.

Remember – Your investing life is way to short to waste your time (years) recovering from a huge loss.

Stay tuned.

Sam Jones

PREDICTABLE MARKET PATTERN SO FAR

Last Friday, we finished our market update with the following statement.

If you’re looking for markers, it would be likely that the S&P 500 would rebound back up to 2730 from here, almost 6{1de7caaf0b891e8de3ff5bef940389bb3ad66cfa642e6e11bdb96925e6e15654} higher, and then we’d see another round of selling back to the current levels. Current levels mean the lows established by the overnight futures price action on February 5th, which was 2529 on the S&P 500.

Today, the S&P 500 closed right at 2729. Rarely are we THAT accurate. So things are moving predictably in terms of how a normal correction unfolds including the recent rebound. Let’s take a second to review current conditions and set some expectations looking forward.

Our Net Exposure Model is Still Negative

Regular readers know that we adjust our Net Exposure to the markets based on a weight of evidence model using a range of +19 to -19. This happens inside each investment strategy. The model factors in sentiment, technical trends, market participation, momentum, seasonality, valuations and several other factors. These factors are weighted according to their importance in dictating the future direction of the stock market. It’s not perfect but it does keep our emotions out of the mix and forces us to just do what we’re told. The process of determining our final holdings also includes Selection Criteria as well as Position Size Criteria. The whole machine is well defined and time tested since the inception of our firm back in the mid 90’s. We have a neat little graphic posted on our site now if you want to get a feel for how it works

https://allseasonfunds.com/our-services/our-investment-process

On February 2nd, our model moved dramatically from a +8 to a -3, a negative reading and our first in while. On Monday of this week, the model got worse moving down to a -6 which was to be expected considering the carnage of last week. Now, prices have rebounded but only up to the breakdown point. Most of our momentum indicators are back to neutral and sentiment has marginally recovered but not a lot. Seasonality is still negative, valuations are still unattractive and market participation is still not very robust. Even if tomorrow were another up day in the benchmark indices, our model would likely remain negative all things considered (just guessing). At this point, our rules allow us to hold, sell or upgrade positions without dramatically changing our net exposure to the market. We did a little bit of all today. Positions that were hit hard in the recent selling and have lagged on this rebound were reduced or eliminated today. Proceeds were either placed in cash or used to add to positions that have held up well and seen renewed buying enthusiasm. We’re sticking with winners, cutting our losers but maintaining our net exposure to the markets for now (30-40{1de7caaf0b891e8de3ff5bef940389bb3ad66cfa642e6e11bdb96925e6e15654} cash). Looking forward, we could easily see selling pressure again, perhaps starting near the close tomorrow and extending into next week. The downside risk is the intraday lows of February 8th (2529 on the S&P 500), which is a long way down and would be very uncomfortable. As a general investing best practices rule, it usually pays to wait for a retest of recent lows before adding new money to any portfolio. After all, the recent lows could be just the first leg down so let’s be patient and work hard to eliminate all assumptions about the future.

What You Can Expect

I’ve never really articulated this before but let me try. As corrections and market volatility return to the financial markets, ultimately giving way to the next significant bear market, you can expect your portfolio to begin moving less and less in sync with the major market indexes. Obviously, if conditions are not favorable and our Net Exposure model is pushing us out of the market to cash, your portfolio return stream will gradually smooth out and begin to march to its own beat. This whole process can take several weeks and months.

For several years now, our Tactical Equity and Blended Asset strategies have been moving very closely with the markets, rising and falling on the same days and weeks within a largely favorable uptrend. If conditions don’t improve, you can expect that to change as our strategies become less and less correlated to the daily ups and downs. I realize, when we have big moves in the market in either direction, the impulse is to compare your account to some benchmark index of your choice. We ask those inaudible questions to ourselves, “The index was up X, how did my account do?” With 30-40{1de7caaf0b891e8de3ff5bef940389bb3ad66cfa642e6e11bdb96925e6e15654} cash now, you can expect that your portfolio will move about 30-40{1de7caaf0b891e8de3ff5bef940389bb3ad66cfa642e6e11bdb96925e6e15654} less than most indexes, in both directions. Also, remember that every one of our clients owns more than just stock in their strategies. We have bonds, commodities, internationals, hedges, specialty funds and income positions across your whole portfolio making comparisons to just one index (like the Dow) pretty irrelevant.

Why Do We Do What We Do?

I’m going to finish with a bit of philosophy as to why we remain focused on risk management as a core theme in the management of our client assets. The history if how this became a focus is too long for this update but involves a deep sense of cultural history in our family of planning for the future by managing or eliminating potential life risks (think insurance). But practically, I’ll give you something really rich to latch onto.

We offer risk-managed investment strategies as a focal point to our wealth management efforts because…..

LIFE IS SHORT

            No really, that’s the reason. Investors typically have about 20-25 years of actual time investing in the financial markets will any real money. I would guess that average period is actually getting shorter as I see people can’t really afford to stick much away into investments (aka savings) until they are approaching their peak earning years. I also see a lot of people tapping their investment accounts in their 50’s for this or that – much earlier than previous generations.

Anyway, let’s say we have 20 years of productive time to make our investment wealth grow. Now, we know that there are long, long, long cycles where the markets just don’t produce much. The recent history of the S&P 500 tells that story well. From March of 2000 to April of 2013, the S&P 500 made exactly zero {1de7caaf0b891e8de3ff5bef940389bb3ad66cfa642e6e11bdb96925e6e15654} return. Now if you happened to start your investing career in March of 2000, after 13 years of no gains including not one, but two bear markets of -50{1de7caaf0b891e8de3ff5bef940389bb3ad66cfa642e6e11bdb96925e6e15654} each, you might be frustrated.

From our perspective, no one has enough investing time to waste losing 30-40 or 50{1de7caaf0b891e8de3ff5bef940389bb3ad66cfa642e6e11bdb96925e6e15654} in anything and then waiting years just to recover back to even. And of course, very few are ever able to hold through real bear markets. Instead, they sell at the lows, wait years to get back in and may never recover in their lifetimes!

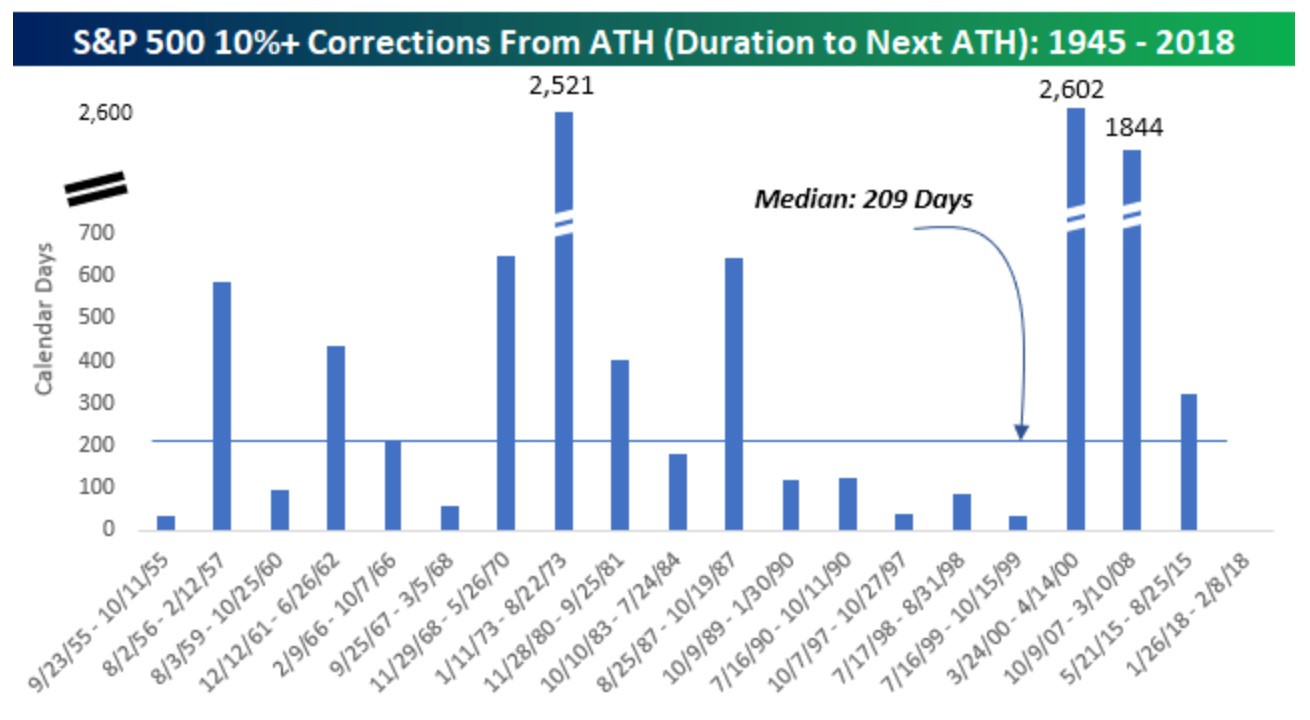
Here’s the best chart I saw all week. It was posted by Bespoke and it speaks to the actual time needed to break even following the first 10{1de7caaf0b891e8de3ff5bef940389bb3ad66cfa642e6e11bdb96925e6e15654} loss from all time market highs. Of course, not all 10{1de7caaf0b891e8de3ff5bef940389bb3ad66cfa642e6e11bdb96925e6e15654} corrections stop at 10{1de7caaf0b891e8de3ff5bef940389bb3ad66cfa642e6e11bdb96925e6e15654} right? The data here doesn’t even capture the losses that started from points below All-Time Highs, which is much worse but you get the point. 2,602 days just to break even?

In our shop, with our disciplined downside controls, we don’t experience the big losses associated with bear markets and thus you don’t have to WASTE YOUR SHORT LIFE recovering from losses.

That’s why we do what we do.  Call us if you need help.

Cheers

Sam Jones

WHAT IS THE RECENT MARKET DECLINE TELLING US ABOUT THE FUTURE?

Most investors tend to pay way too much attention to price changes in the major stock benchmark averages.  Often times, I get a funny look when people ask me where the Dow closed today and I can’t tell them.

But I thought you managed money?

I do, but what does the level of the Dow Index have to do with anything?

We like to look into the character of every market advance and decline for clues about what we might expect looking forward.  There’s a lot more relevant information under the hood of index price action.  Let’s take a look.

Investors Own What They Don’t Understand

Bitcoin is an easy target and I won’t beat that dead horse.  Bitcoin was trading as high as $19,800 and recently moved below $6000 in just a few short weeks.  I will take this moment to say – I told you so.  Maybe it will go up, maybe it will go to zero but the fact remains that hundreds of Billions of dollars in wealth is being erased at an alarming rate.  Bitcoin owners still don’t know what it is but most now understand that is causes great wealth destruction.

The same goes for investment products like leveraged ETFs tied to derivative markets.  XIV is a symbol that is worth looking at on www.stockcharts.com

This is an ETF that shorts market volatility.  It is now gone and in liquidation following a small print line in the prospectus that allows the fund to simply close following a loss of 50% or more without any obligation to investors.  Investors who have no business owning these products of mass destruction just lost everything, well 95% as of this am in about 26 hours.  What can you tell me about XIV Mr. Investor?  Silence.

The market is not kind to investors who chase “stuff” just because it appears to be going up fast.

What does this tell us about the future?

Investors will be far more gun shy about gambling and speculating from here on out.  In fact, this type of event tends to push investors to the other end of the spectrum where they will find the likes of Johnson and Johnson or a dividend payer suddenly VERY attractive.  Watch the Value and Defensive side of the market for relative strength in the weeks and months to come.

Risk Versus Volatility

As we define in our “Explicit Investing Creed” on our website, www.allseasonfunds.com ,

RISK (DEFN.)

  • The probability of unrecoverable or semi-permanent loss of capital, not to be confused with variable degrees of periodic volatility.

Let’s talk about that in the context of the recent decline in global stock prices.  Today we have an obvious spike in volatility, meaning big price moves down in a short period of time.  This one looks like the type we saw in 2011 and again in mid-2015, which I would describe as mini-crashes seemingly out of thin air from recent all-time highs.  These are the tough ones because everyone tends to have a lot of money on the table after years of steady and predictable price advances. So volatility is now with us as we feel the effects of the first “drawdown” in almost a complete year.  Drawdowns are market words for declines in your portfolio balances associated with market losses.

While I hear a lot of whistling past the graveyard in the current commentary, I also hear a lot of fear in the system.  I hear investors assuming that “RISK’ has entered the picture and a bear market is upon us.  I hear comments like, “This is 2008 all over again” or “Here it comes, I knew it” or “This is going to be worse than anything we’ve ever seen”.  Clearly, investors are assuming that they will experience an unrecoverable or semi-permanent loss of capital from here.  But so far, we don’t have enough actual evidence to suggest that we are seeing anything other than volatility.  Am I whistling too?  Not yet.

With that said, Volatility always shows up before Risk so we have to respect the recent break of the trend in market prices. I can say with high confidence that the days of record low volatility in the markets are over perhaps for a long time (years?).   Volatility can and should be managed with some portfolio changes, while “Risk” is to be strictly avoided with a maximum defensive posture.  As regular readers know we went into February with almost 20% cash.  Now that number is 30-40% depending on the strategy.  That is not maximum cash or max defensive positioning, but rather an appropriate reaction to some obvious new volatility in play.  The weight of evidence is in sync with our allocations.

Computers Are Making Decisions

This is not a statement about computers taking over but rather an honest understanding that much of what we see in price action today is the result of quant and algorithmic trading programs hitting the sell button simultaneously.  Don’t blame the computer, it’s just doing what you told it to do right?  But the effect is that prices no longer roll up and roll down, they spike up and spike down as trading programs move mountains of investor dollars all at once.  This is a bad thing because it creates a great deal of chaos when things are already a bit uncomfortable for us simple humans.  In fact, the program driven selling probably has the effect of driving other more subjective traders to sell as well in a negative feedback loop.

Looking forward, we should expect more of the same.  Program trading is not going away for as long as it remains unregulated and as long as it holds a timing edge over the guy who is still working for a living and doesn’t have time to day trade on 5-minute charts.  So if program trading is with us, we need to really manage our money differently.  We can’t assume that our all stock portfolio will offer us a smooth ride forever if the program trading systems are going to “Bitcoin” (let’s make it a verb) on the other side.  Simply put, investors have got to become more mature about their portfolios.  Specifically, we’ve got to get back to portfolio construction and asset allocation owning a group of non-correlated holdings through all types of markets.  Today, everyone is still on one side of the boat – ALL STOCK.  Our clients at All Season Financial understand that we’re pretty strict about maintaining their allocations to our “Tactical Equity”, “Blended Asset” and “High Income” strategies.  In every review we show our clients what their Prescribed allocation is compared to their mix as well as their deviation from that prescription.  Our clients understand that the magic of consistent returns over time is about maintaining the mix of non-correlated strategies while making adjustments to exposure over time.  We don’t assume that we’ll beat the program trading systems to the exit door on a daily basis, because we don’t have to.

Stocks and Bonds Carving Out a Short Term Bottom Together

Many are still looking for that elusive reasoning behind the stock market’s decline.  They are erroneously blaming the increase in interest rates at present.  Interest rates are not high enough to be a problem for stocks from any perspective so that’s not right.  But the interesting fact to note here is that bonds are moving in sync with stocks.  They are moving together in price for the first time since late 1999.  The good news is that we might find an attractive BUY in bonds for the first time in a while just as stocks are also carving out the first good looking BUY in a long time.   From a timing perspective, today and the massive reversal to the upside on a Friday close should set up the first technical low.  Bonds are also looking like they want to bottom.  We are not likely to buy either asset class with our heavy cash position until we see a rebound of some reasonable magnitude followed by another retest of these very same low levels, most likely in mid-March.  It’s a good rule of investing to never buy the first low.  Always wait for some sort of retest to confirm that the floor is solid.

If you’re looking for markers, it would be likely that the S&P 500 would rebound back up to 2730 from here, almost 6% higher, and then we’d see another round of selling back to the current levels.  Current levels mean the lows established by the overnight futures price action on February 5th, which was 2529 on the S&P 500.  Today, at the very worst moment of the day the S&P 500 reached down to…. Wait for it… 2529!

Bang, that’s probably going to be a short-term bottom.  Cross our fingers.

That’s it for today – have a peaceful weekend and don’t think about the markets.

Cheers,

Sam Jones

JUST WHAT YOU NEED TO KNOW RIGHT NOW

Last week was a hard down week for global stocks.  You’re anxious.  Here’s what you need to understand right now.

Just the Facts

  • The US economy is in great shape with no recession in sight within 7-9 months – discussed last week.
  • Earnings thus far are coming in stronger than even recently raised analyst expectations (Top line and bottom line)
  • Earnings guidance is strongly higher for the third quarter in a row
  • Inflation is starting to build in the economy.  Inflation is good for stocks from these levels.
  • This feels like a train wreck only because we have not seen any price corrections of any magnitude in over 300 days (a record).  Normal market conditions see 7-8 corrections of 3% every year on average and 2-3 corrections of 10% or more every year on average.
  • Price declines in the short term (next 2-3 weeks) are not likely done yet.  We are expecting approximately a total 6-7% market decline before we see another good buying opportunity.
  • Stocks should continue to trend higher into the spring and early summer.    This looks like a technical correction within a longer-term uptrend.  Buy the dips but be patient and wait for selling to end.
  • There will be a short-term bounce in prices this week but we are likely to see lower lows before this intermediate term correction is done.
  • We have been adjusting our market exposure and raising cash since mid-January.  We are sitting on 24-41% cash across all strategies.  The Income models are 60% in cash.  That’s the right amount of exposure for current market conditions.
  • Financial markets will move strongly in both directions without your understanding why.  Stop looking for reasons because once you think you have found the answer, the market will defy your newfound logic.  Follow the trends.
  • The trend in stocks is UP!
  • If you are not a current client of ASFA, lost in the storm, nervous and have no idea what to do with your investments right now, please read the “Light House Project” offer in this update.  We’re here to help you.

…..You’re Welcome

Your “just keepin’ it real” Investment Advisor

Sam Jones

WHERE ARE WE? A CURRENT READ ON THE BUSINESS CYCLE

After listening briefly to some of the State of the Union address, I found myself wanting to do a little check up on where we are in the market cycles. Trump told us that this is just the beginning of the good times for stocks, jobs, and the US economy. Well… asset class, sector leadership and the credit markets have a different “spin” if you’re willing to look at reality. Here’s where we are and what you can expect next from stocks, bonds, and commodities (inflation sensitives).

Stage IV

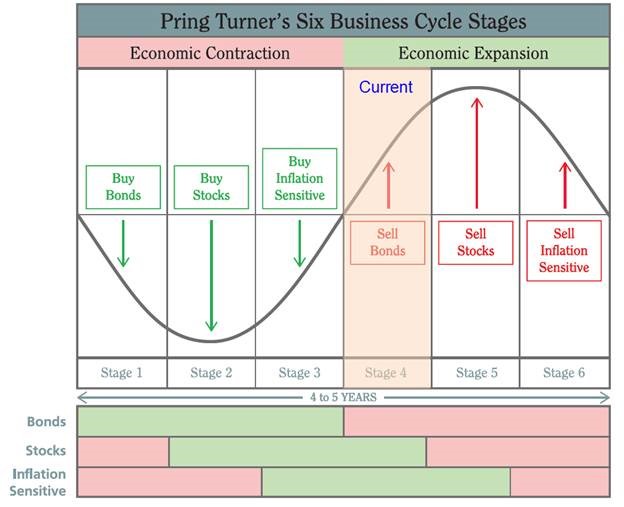
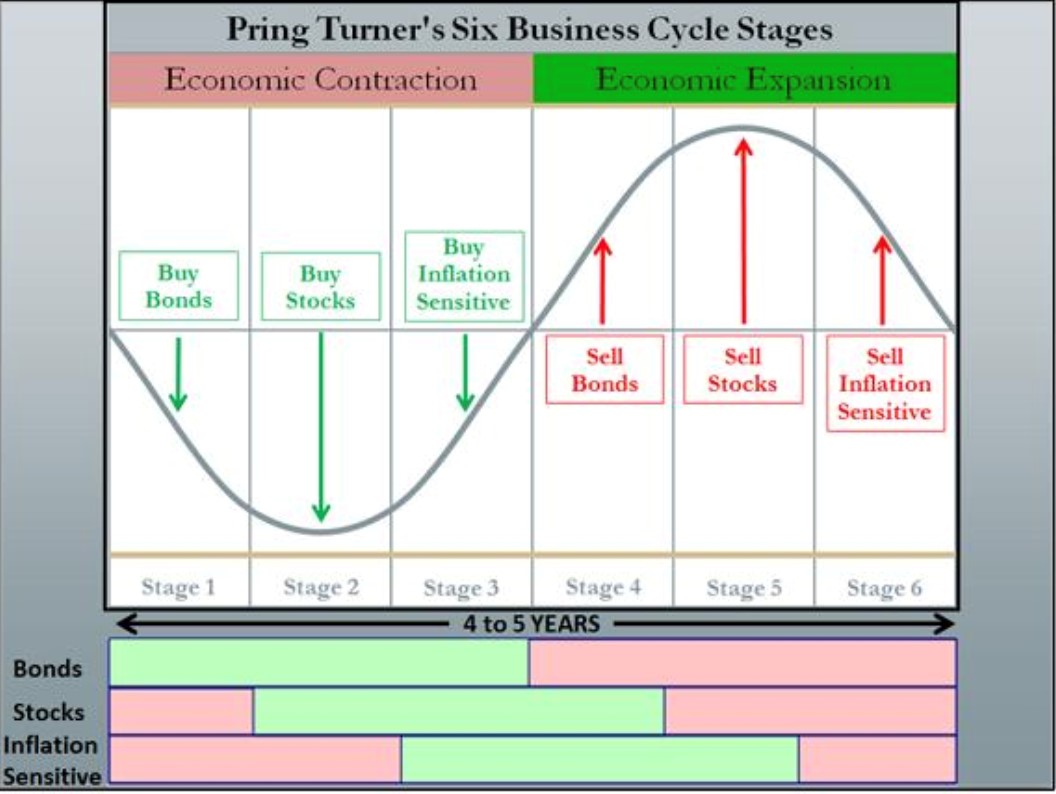
There is almost no doubt, that we are now in Stage IV of the Business Cycle, as defined by the great cycle guru, Martin Pring. Take a quick look at the chart below.


If I had to pinpoint our current position, it would be on the right-hand side of the column marked “Current”. What evidence do we have to support that position? Well, first we can do a simple return comparison among the three major investment food groups- Stocks, Bonds, and Commodities. The most notable moment in recent history when we can point to a day when asset class performance turned, was February 11th of 2016, almost exactly two years ago. As a side note, the week of February 10th happens to be a cycle turning point that goes way back in time marking either tops or bottoms in stocks. I have no idea why that date has this effect but the data is pretty solid. You might glance at the calendar (wink). On February 11th of 2016, we witnessed something important. Bonds put in an interim high in price and in the very same week, stocks and commodities put in a final low after a very long and painful period of high volatility and price declines through most of 2015. But the cycle continued to evolve! On July 7th, 2016 there was another shift of sorts in which bonds put in a final peak and really started to sell off, locking in a longer-term period of rising interest rates in sync with the Federal Reserve raising the Federal Funds rate. Finally, on June 22nd, commodities and inflation hedges really began to get traction and are now OUTPERFORMING stocks for the first time in a long, long time.


Let’s add a little data and color coding to support this discussion. The performance numbers below are shown from the various dates described above through yesterday.

One could give credit to Trump and his election for the sudden change in the market conditions favoring stocks and commodities over bonds. The timing of his election and subsequent asset class performance differences is just too exact for it not to have been the catalyst.  It’s pretty safe to say that somewhere in late 2016, the business cycle shifted strongly into Stage IV.

So the good news is that we still have Stage V and Stage VI of the cycle left before we might expect to recognize and register an actual economic recession. The bad news for investors is that Stage V and Stage VI are very painful for most as stocks enter bear markets and the investors experience the worst period of wealth destruction (those without a risk management system). Commodities can be a safe haven but most investors don’t own commodities in any volume.  Bonds eventually find a low in late Stage VI as investor look for safety and then the cycle starts over at Stage I.

Yield Curve Still Flattish But Not Inverted

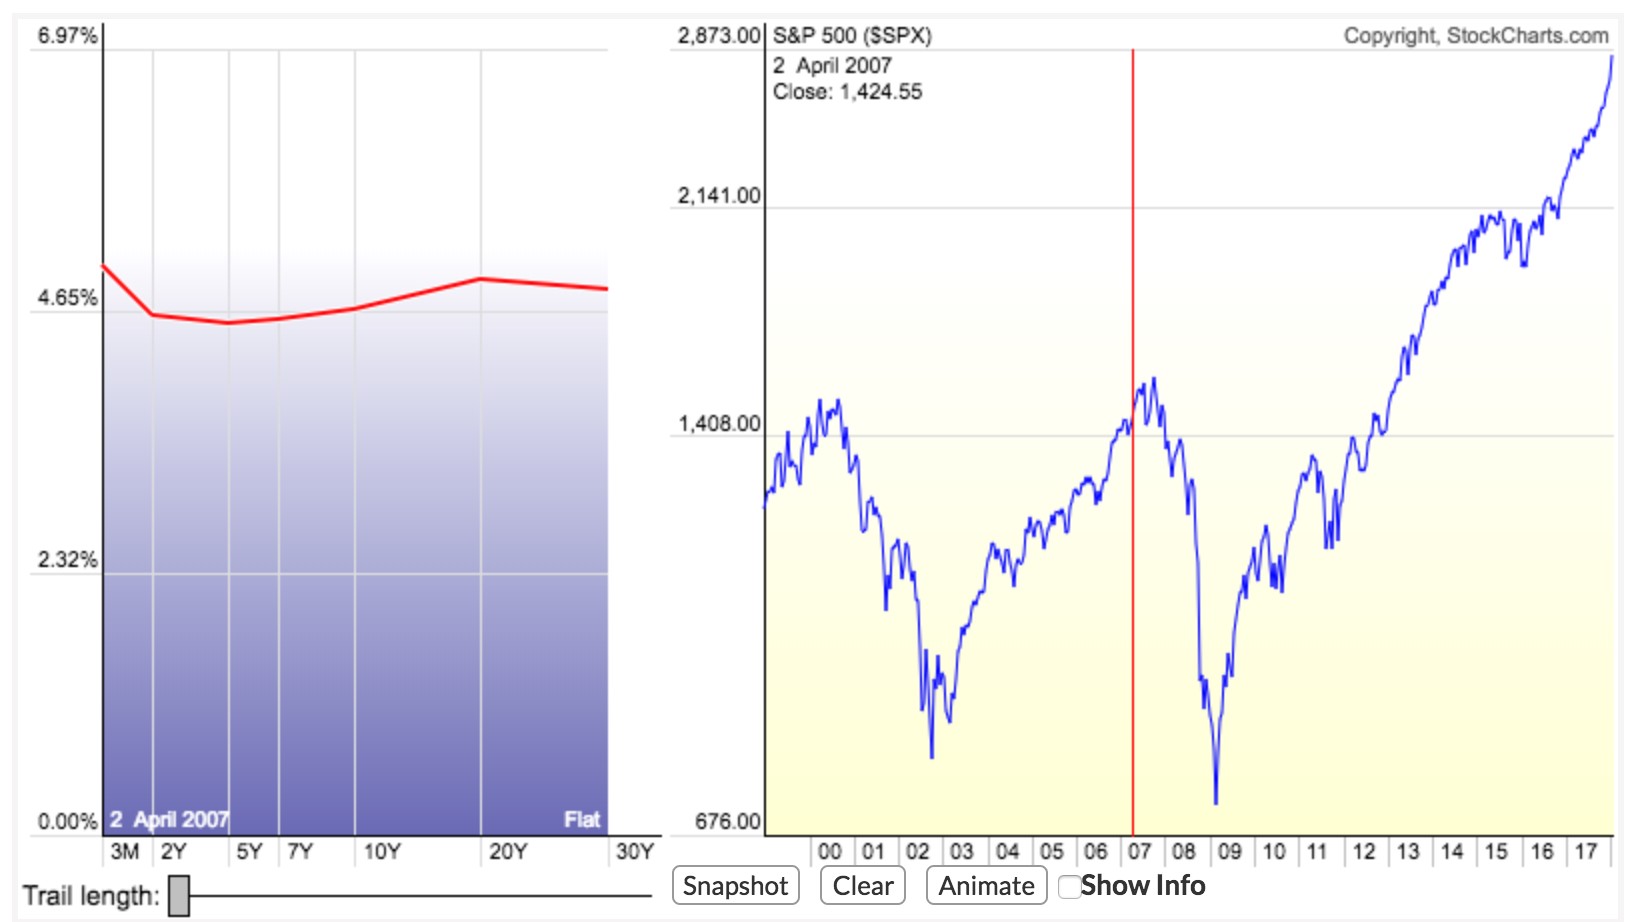
One of my favorite tools to look at the yield curve is this interactive, animated time lapse function on Stock Charts.com called the dynamic yield curve.

Try it out    http://www.stockcharts.com/freecharts/yieldcurve.php

Put your cursor just to the left of the market peaks in 2000 and again in 2007 and watch what happens to the yield curve (a line showing US interest rates across various maturities from 3 months to 30 years). What you’ll notice if you do it right is that when the 2-year note rate exceeds the 10-year note rate (inverted), we typically see a top in stocks within a quarter or two.  If you bring the bar forward to recent history, you’ll see that we’re not there yet. But at the current rate of change in the different maturities and the Fed on tap to raise rates in both March and June, it would seem likely that we might see an inversion in the summertime or the early Fall. Remember, the business cycle says to expect stocks to top NEXT and the economy should head toward contraction so this is all very consistent with what the markets are telling us, loud and clear. Practically that means we should be on the watch for a meaningful market top followed by a recession. This is not the message I heard in the State of the Union.

The Easy Money is Behind Us

This week, we finally saw a little crack in the parabolic price appreciation seen in the global stock markets. Volatility is on the rise, but the first signs of selling pressure rarely mark the final peak. It simply says to all that the easy money is behind us and we need to be tolerant of more frequent and larger down days. Even the most notable market crashes and disasters in history did not manifest from thin air. There are often months and months of deterioration in a number of variables and market internal indicators before real and lasting price damage begins. This is not the top. But this is the beginning of a period of higher volatility. With that said, the markets are way off of any sort of trending averages which we might use as typical sell triggers. We have taken some profits across the board in our portfolios, raising cash to nearly 20{1de7caaf0b891e8de3ff5bef940389bb3ad66cfa642e6e11bdb96925e6e15654}. Our Reasoning is that prices will likely retrace back to the longer-term price trend from here. Those levels are solidly 5-7{1de7caaf0b891e8de3ff5bef940389bb3ad66cfa642e6e11bdb96925e6e15654} below the recent highs, which would mean erasing all of the gains YTD, just to get back to an intermediate-term trend and moving averages. We’d like to keep some of our recent gains and have found through experience that a healthy return early in the year is something to protect. No doubt, we’ll look to make some new buys and add back market exposure in the near future but we want to let things move off of the extremely overbought condition first.

That’s if for now, stay tuned.

Sam Jones

LESSONS FROM HISTORY

Adding to our “melt-up” commentary from the last update, this is an appropriate time to look back at the financial history books. Remember, those who fail to heed the lessons (warnings) of the past, are likely to repeat them. For this update, we’ll look at the market’s reaction to previous tax cuts under various presidents as well as periods of extreme bullish sentiment and finish with a lesson on fallout from protectionism.

History of Tax Cuts

Regular readers may recall my painful walk through an economics lesson on tax reform and whether or not it would be good for the economy. That update is HERE. In short, the type of tax reform that did finally pass Congress was the bad type, the type that just gives some quick rocket fuel to stock prices and corporate earnings. Many in the financial media are talking up how tax reform will boost the economy without offering much logic other than pointing to the stock market which admittedly is now pricing in about 13{1de7caaf0b891e8de3ff5bef940389bb3ad66cfa642e6e11bdb96925e6e15654} earnings growth in the likes of the S&P 500. That might be the case. But will the tax reform act truly give a boost to the economy, to Main street and the welfare of our general population? I’m going to stick to my guns and say no, not in the end. I won’t reiterate why because I already challenged your attention span with the previous update. But I will give you a real-time example of what I’m talking about.

Did you hear what Walmart decided to do in response to the tax reform? Or at least using that as the excuse?

Here’s the story – https://www.nbcnews.com/business/business-news/taxes-lower-employment-higher-walmart-announces-raises-bonuses-n836801

They announced that they are going to raise the starting wages to $11/hour and give “some” workers one-time bonuses that could be “as high as” $1000. Babysitters make $12/ hour now mind you. The promises and announcement were vague with a total package cost of approximately $700 Million give or take a $100 Million. And then quietly, they also announced that they were closing 63 Sam’s Club Retail stores. We know that Walmart will save a net $2 Billion in taxes with the tax reform and I’ll bet their earnings do quite well net of unprofitable store closures even factoring in the increase in wages. So, in the end, are Walmart/ Sam’s Club employees better off? Absolutely, if you aren’t among the many hundreds who just lost their jobs. This example is nearly perfect in showing how tax reform will be good for earnings and ultimately bad for main street. Now back to the history books.

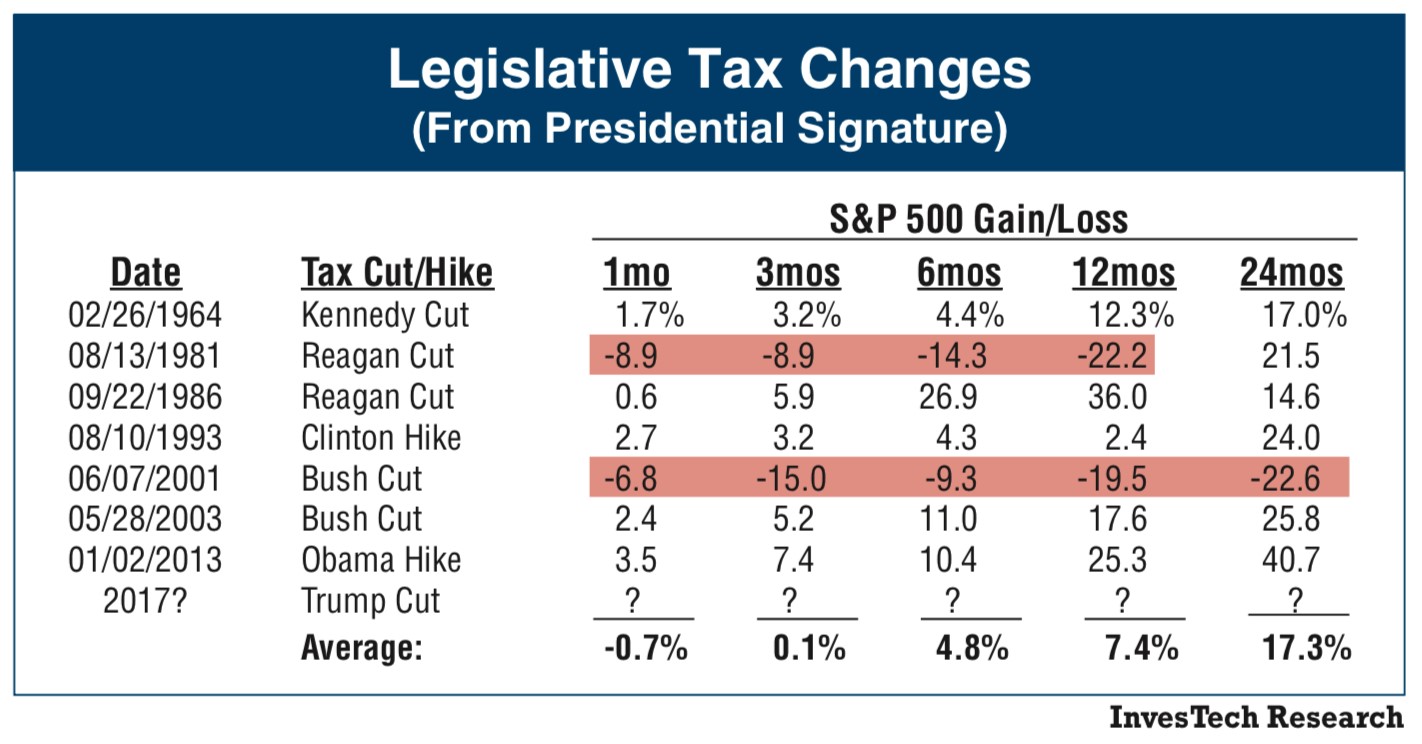
Investech did a great research project on the financial market’s reaction to past tax reform, both increases and decreases in Federal tax rates under different presidents. Honestly, we shouldn’t draw a straight line of causality between tax policy and the markets because it’s much more complex than that.

But the important thing to note is this. Tax cuts, especially in the first term of a new Republican president, have in fact yielded negative results in nearly all periods following the passage of the act. Those periods are highlighted in Red above. Not shown in the data is the October crash in 1987 of -22{1de7caaf0b891e8de3ff5bef940389bb3ad66cfa642e6e11bdb96925e6e15654} which is just outside the 12-month mark of Reagan’s second tax cut. From a pure market perspective, as counterintuitive as it seems, tax HIKES have been better for stocks in the months and years that follow. Logically, the markets ultimately follow the state of the economy by way of earnings. So, while today’s short-term thrust in earnings is showing up in stock prices, we’re not likely to see a commensurate thrust in the US economy. Wealth inequality will be wider than ever in the next 12-24 months. Heed the lessons of the past and set expectation appropriately as we test the theory behind tax reform again.

Lessons from Bullish Extremes in Sentiment

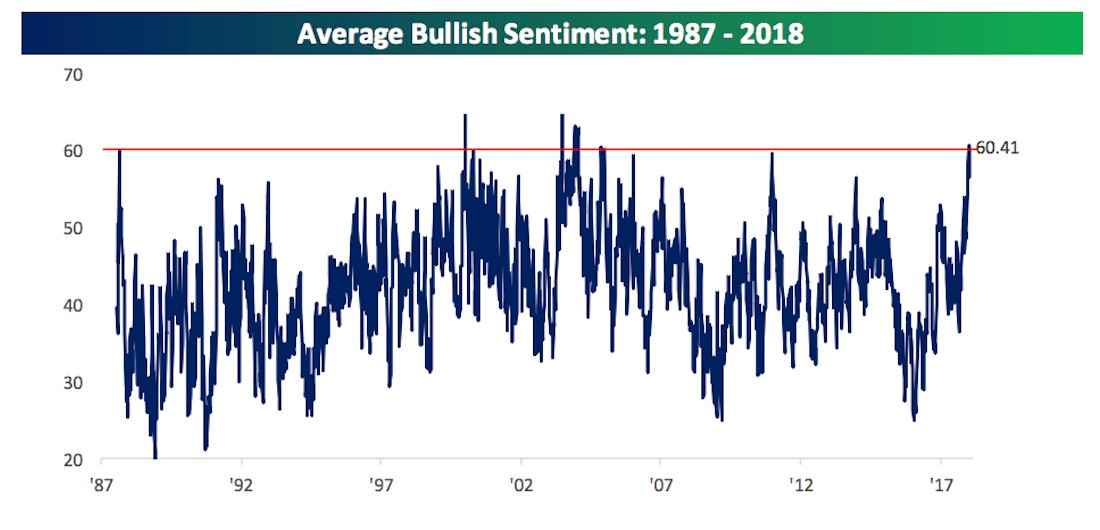
Sentiment among investors is really a blunt indicator. Regularly, the bullish and bearish figures don’t offer us much of a useful tool in helping direct our net exposure or any other portfolio decisions. That is until they hit notable extremes on either side. I’ve said many times, that we’ll give this bull market the benefit of the doubt until everyone becomes convinced that prices are going higher. Then we’ll start to get nervous, raise stops and prepare for the next serious decline. In the last two weeks, according to Bespoke Research, we have seen the Average Bullish Sentiment spike to an extreme reading over 60{1de7caaf0b891e8de3ff5bef940389bb3ad66cfa642e6e11bdb96925e6e15654}. Here’s the chart dating back to the late 80’s.

There have been only three other times in history when the average of all sentiment surveys hit this very high level.

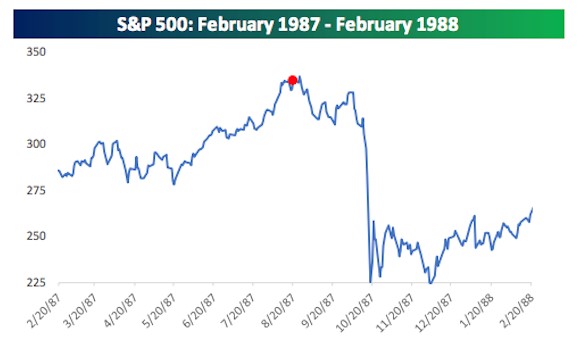
The first was in the month prior to the 1987 crash, marked with the red dot. We don’t want to think about that as a possibility but it happened.

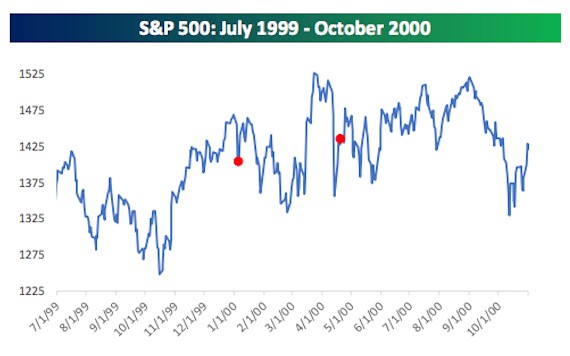
The second was July of 1999 during the most notable melt up in the history of the stock market which I wrote about last week.

The bull market ended seven months later in March of 2000 leading to a 24-month bear market of -48{1de7caaf0b891e8de3ff5bef940389bb3ad66cfa642e6e11bdb96925e6e15654}. Here’s what that looks like.

The third set of bullish extremes was seen coming out of the 2003 bear market lows strangely and stock prices pushed higher for several more years! This situation was different in my mind. I was there, managing money and I remember a great feeling of relief (bullishness) that developed as investors realized that the worst bear market in modern history, was over. So, the extreme in bullishness during this time didn’t really match up with the other more dangerous type of bullishness that appears AFTER nearly 8 years of rising prices. Euphoria is not relief and the former is more of a technical warning shot than the latter.

And here we are today… making history.

Lessons on Protectionism

Trump is all about America First. From the economic perspective, we see this as an entire package of protectionism. Of course, this is a hotly debated topic covering everything from our participation in the UN, to our relationship with trading partners, efforts to encourage US manufacturing and consumption while building walls and barriers to interaction with the virtually the rest of the world including immigration issues and labor force legitimacy. It’s a big hot mess. The history of American protectionism dates all the way back to the late 1700s with Hamilton driving the first public efforts. There have been other presidents and champions of protectionism especially during cycles of low wages in the US. The common lesson we should learn and understand from previous episodes is the constant of inflation. Inflation is a tax on every citizens’ basic costs of living. Economics students understand the principle of Most Favored Nation which argues that any country who can supply goods or resources to the rest of the world for the lowest cost or efficiency should do so through free trade, effectively providing a constant competitive landscape that keeps costs of living low for all. Protectionism essentially puts an end to that global efficiency by erecting walls, adding tariffs to imports, forcing low-cost labor out of the country. Protectionism has always lead to high inflation and subsequently a lower standard of living for the working class in our country. That is the lesson from the history books.

Last night Trump imposed a 30{1de7caaf0b891e8de3ff5bef940389bb3ad66cfa642e6e11bdb96925e6e15654} tariff on all imports of solar panels from Asia, mostly China. I haven’t read the story yet but I think there is also a new tariff on specific imports of durable goods like washing machines (from LG) and even technology (from Samsung). I need to confirm that. Wow! Get ready for inflation as tariff wars begin for the first time in several decades. As a lifelong student of economics, I can’t say strongly enough how troubling this is. People don’t understand the effect of policy changes like these until they are deep underwater with rising costs of basic necessities and bewildered at how they got there. As a country that imports everything, we can’t magically move to a system of self – sufficient sourcing without an enormous amount of pricing pain first. History will be a brutal teacher again I’m afraid.

Wrapping it up, these lessons from history are warnings, clearly. Furthermore, they are happening simultaneously driven largely by the current administration. Stock investors are cheering, we’re all making money and that’s great. But we don’t see any of this as sustainable, quite the opposite. Timing is everything now. Needless to say, we’re tightening up our stops on individual positions and the market as a whole. We are also selling just about anything that is underperforming, weak of over-valued to cash. This is as hard as it gets as a manager of investment dollars. We need to stay in the game of a parabolic rise in stock prices while staying true to our risk management discipline.

Stay tuned as conditions are changing very rapidly now.

Regards,

Sam Jones

THE LIGHTHOUSE PROJECT

Is your portfolio prepared for a storm? What risk management triggers do you have in place? What variables are you monitoring to ensure your exposure is targeted and maintained properly? These are the types of questions we are looking to answer when stress testing a portfolio and tailoring strategies for success in the future.

Three things we can do to help:

  • Stress-test your portfolio
  • Optimize tax efficiency
  • Minimize exposure when markets begin to sour

We understand that there are a lot of DIY investors out there, and that is exactly why we are launching this Lighthouse Project. We want to reach those who are genuinely interested in protecting gains from the second-longest bull market in history. (Eight and a half years without a 20{1de7caaf0b891e8de3ff5bef940389bb3ad66cfa642e6e11bdb96925e6e15654} drop in the S&P!) We are not claiming to know when we will see The Bear, or The Top, just that there are ways to adjust exposure and allocation as markets age and change to provide for downside protection. We rarely but wisely use shorts, we rotate sectors, we focus on value and we manage tax consequences.

The Lighthouse Project is a call to our readers to introduce us to new readers online. I know that copying and pasting a link into your digital feed is sometimes nerve-wracking. We sincerely believe that you will be doing a favor to those who follow your lead by making the introduction.

Our technology and experience allow us to assist DIY investors in finding weaknesses, unbalanced allocations, tax inefficiencies and more. We want to offer this free consultation as the market continues to rise. It is in everyone’s best interest to be well informed and we feel we are qualified to be providing this valuable insight.

Please stay tuned to Lighthouse Project announcements, we will specifically design these for sharing online. We hope to introduce individual investors to our system of risk management, stress-tested portfolios, and native tax efficiency so as to provide robust protection before The Bear eats someone’s lunch.

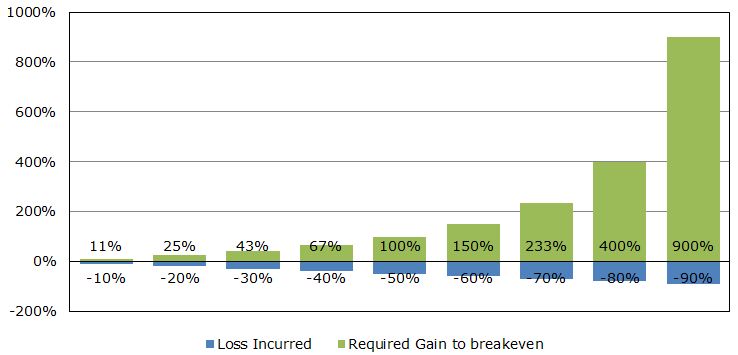
Let’s do our best to avoid situations that lie further to the right on the “breakeven post-loss” graph.

Thank you for being a Red Sky Report Subscriber and for sharing our insights.

Alex Osmond CFP®

MELT UP AND THE BEST INVESTMENT FOR 2018

I really hate click bait and I apologize for that title. But it’s time to pay attention again. Trends in the financial markets are really accelerating so this is the time to open our minds and let things happen as they are without applying assumptions or perceptions about the future. A “melt up” in stock prices has been in place since last September despite just making the headlines now.  I’ll finish with a refined amendment to Jonathan Clements’ smart piece in the Humble Dollar, “Best Investment 2018” written on 12/30/2017. Settle in.

What is a Melt Up?

For those who weren’t investing or conscious or born yet, the late 90’s was a time when the US stock market experienced a wild Melt Up. The move began in early October 1998 and ran near vertically into mid-March 2000. Let’s call it 18 months.

During that short time the S&P 500 gained 50{1de7caaf0b891e8de3ff5bef940389bb3ad66cfa642e6e11bdb96925e6e15654}, the Nasdaq Composite gained 222{1de7caaf0b891e8de3ff5bef940389bb3ad66cfa642e6e11bdb96925e6e15654}. Even our own risk managed Worldwide Sectors strategy made almost 90{1de7caaf0b891e8de3ff5bef940389bb3ad66cfa642e6e11bdb96925e6e15654}. Yes, that happened and it appears to be happening again now, roughly 17 years later. This move began in September by my estimation. That was the time when the markets could have buckled but instead shot higher and have been moving vertically higher in a near lockout environment for anxious “me too” investors. Melt Ups happen when there is a shift in mass psychology that is finally more accepting of a positive outcome given all the broadcast bullishness. It’s a time when investors, market gurus and those with a seemingly permanent bearish bias, just simply capitulate to the obvious trends that have been in place for many months, even years. In fact, capitulation buying only shows up after years and years of rising prices and disbelief. There’s a reason they say that a Bull market climbs a wall of worry. That is, until that sense of worry disappears. That is where we are today.  No worry, just pure unbridled optimism about the future of stocks, the market and our economy. Of course, this is the hallmark, the very calling card, of the end of the bull market – give or take 12 months! So yes, a melt up is and has been in the works now since the fall. We have been all in as they say with less than 5{1de7caaf0b891e8de3ff5bef940389bb3ad66cfa642e6e11bdb96925e6e15654} cash in all but our bond models and making some very handsome gains.

Stocks Are Shiny Objects Again

How high can this go? I have no idea, no one does. The students of past bubbles know that it can go much higher than you think, much, much higher. On the way into work today, I heard three brokerage firms raise their year-end price targets for the S&P 500 to somewhere in the high 3000’s. That’s nearly 35{1de7caaf0b891e8de3ff5bef940389bb3ad66cfa642e6e11bdb96925e6e15654} higher than today. If our starting point for the current melt up was, in fact, September, we’ve already seen a gain of 15{1de7caaf0b891e8de3ff5bef940389bb3ad66cfa642e6e11bdb96925e6e15654}. Adding 35{1de7caaf0b891e8de3ff5bef940389bb3ad66cfa642e6e11bdb96925e6e15654} to the current gain would ironically put us right on track with the last 18 months of the bull market into 2000 when the S&P 500 added a clean 50{1de7caaf0b891e8de3ff5bef940389bb3ad66cfa642e6e11bdb96925e6e15654}. I don’t expect that outcome this time but it’s interesting to see the patterns match up. Human behavior is the only constant in the financial markets as we’re really just monkeys that like shiny objects.

How Does A Melt Up End?

Badly… Always

Selling pressure among institutional money managers rises with prices in every market. But in a melt up, the actual selling is put on hold as they, (like us), recognize the powerful potential of a melt up market. They literally ignore their short-term sell signals as they should and it becomes a pure game of chicken. You can imagine what happens when it finally turns and it becomes a death match to see who can take profits the fastest. The market top comes out of thin air with no reason whatsoever. Statistically, once the top is in, we see at least one month early in the decline that exceeds -20{1de7caaf0b891e8de3ff5bef940389bb3ad66cfa642e6e11bdb96925e6e15654}.

Ben Carlson of a Wealth of Common Sense did an excellent podcast yesterday talking a lot about the glory and gore of “melt ups” in the past. It’s a good one.

http://awealthofcommonsense.com/2018/01/animal-spirits-episode-12-the-melt-up/

How To Play It?

Well, this is a tricky answer because a lot depends on who you are, your temperament and your investment strategy.  I’ll sidestep and avoid a really detailed answer but offer this. We’re in a global stock market environment that is accelerating to the upside.  Gains are accumulating at eye-popping rates on a weekly basis. Finding new entry points into this type of market is nearly impossible so my best advice is: don’t try. Hold what you have and I hope you have a lot on the table as we do given the clear evidence since last fall. Put your politics and your assumptions away and just pay attention to leadership. If any of your positions turn down and break trend while the markets are moving wildly higher, sell them to cash and leave it there. Gradually you’ll find yourself with a heavier cash position as prices rise and some of your positions do not. That’s a good thing but it takes a lot of discipline not to reallocate and chase something that has already run.

I would also continue to focus on value. There is a lot of value in the market today. If you must buy anything, look at the banks, energy, airlines, small cap value, mid cap value, materials, industrials, oversold consumer stocks and healthcare. Tech is everyone’s favorite and I don’t love it anymore, but again, hold what you’ve got because it’s all ripping higher.

Finally, I would make sure that your risk management system is well oiled and working properly. If you don’t have a risk management system that identifies when selling pressure shows up and prices have topped, you need one. That’s what we do, so feel free to call us as well. Our Lighthouse Project is an excellent option for those who are feeling exposed. See the commentary from Alex Osmond, CFP in this update on the Lighthouse Project. I stand by my fearless forecast of the year. We will see at least one decline of at least 12-15{1de7caaf0b891e8de3ff5bef940389bb3ad66cfa642e6e11bdb96925e6e15654} in the next 12 months (hint it won’t stop at -15{1de7caaf0b891e8de3ff5bef940389bb3ad66cfa642e6e11bdb96925e6e15654}).

The Best Investment of 2018 – Amendment to Jonathan Clements’ piece.

First, take a look at Mr. Clements awesome advice at the end of last year.

http://www.humbledollar.com/2017/12/best-investment-2018/

The basic advice is pretty simple. Jonathan recommends paying off your mortgage as one of the best “investments” one can make in 2018. The concept is that the new tax rules are going to make mortgage interest less attractive for most as they won’t use that expense as a deduction anymore, choosing instead to take the higher standard deduction.  Therefore, we should increase our net income after taxes by paying down, or paying off our mortgages and increase our income after the standard deduction. For many, that might be a good investment if we are looking at higher income as the objective. But from our perspective, every financial choice is one of relativity. And from that perspective, paying down your mortgage doesn’t make much sense relative to other investment options, current rates of return outside of certain situations. So I’m going to take Jonathan’s advice and amend it to show you where it does make sense.

Don’t sell stocks to pay down your mortgage. This much is obvious to me even if I factor in the risks of a bubble market, melt up and massively overvalued stocks. If one does stocks well, one can make a pretty conservative 7{1de7caaf0b891e8de3ff5bef940389bb3ad66cfa642e6e11bdb96925e6e15654} over time and that’s a lot higher number than the rate on your mortgage (say 3.5{1de7caaf0b891e8de3ff5bef940389bb3ad66cfa642e6e11bdb96925e6e15654} on average). Furthermore, if stocks do crack and head lower, you can always sell them. Housing isn’t so liquid as many discovered between 2007 and 2012. Paying down a mortgage is the same as adding money to your house bucket and that money is pretty solidly illiquid thereafter.  Of course, real estate can fall and just as hard as stocks. We all know that now right?

What about cash? If we have cash sitting idle in the bank earning nothing and our mortgages still cost 3.5{1de7caaf0b891e8de3ff5bef940389bb3ad66cfa642e6e11bdb96925e6e15654} / year, wouldn’t that make sense? Well, I could argue that a person who is in their working years with a healthy job, a decent savings and investing plan for discretionary income should continue to regularly add to more productive investments, like stocks or even income producing securities that pay more than your interest rate on the mortgage. There are many things paying higher than 3.5{1de7caaf0b891e8de3ff5bef940389bb3ad66cfa642e6e11bdb96925e6e15654} including many dividend paying stocks! Now if you have a huge crushing mortgage with interest expenses annually close to $24,000 and a giant unproductive bank account of cash, you could certainly reduce your mortgage.

But here’s the real sweet spot for those wanting to entertain Jonathan’s advice. If you are retired, with no replacement income and have either cash or unproductive bond holdings, it probably makes sense to pay down your mortgage as you can afford to do so. You are past the time in your life where you are adding regularly to your investment accounts so cash just tends to sit for long periods of time in unproductive bank products. Your bond holdings are dead money from a return perspective for the next 4-5 years at least. And you should be constantly looking for ways to reduce your cost of living. In these situations, paying down your mortgage could be one of the best, zero-risk, investments you can make.

For the rest of us working stiffs, we’ll look back on these days with rates sitting at 3-4{1de7caaf0b891e8de3ff5bef940389bb3ad66cfa642e6e11bdb96925e6e15654} and wonder why we didn’t take on the biggest loans of our lives.

That’s all the insight I have for today. Enjoy the melt up!

Cheers

Sam Jones

SPECIAL UPDATE FOR 529 COLLEGE PLAN SAVERS

We have waited and waited all year long for a market discount to arrive offering us an opportunity to engage our long-standing 529 Investor program.  But alas, 2017 literally set the record for low volatility effectively blocking out any opportunity to add cash to our 529 plans at a market discount.  So with only a few days remaining, here’s the best advice I can offer.

Get Your Contributions Done Anyway – To Cash

For those who are unaware of our 529 investor protocol, let’s take a second to review the typical plan.  The basics of 529 college savings plans are that they are very limited both in terms of investment options as well as limits on the number of transactions allowed annually (only 2 per calendar year!).  Effectively every 529 college plan out there wants us to put money into a passive index fund and just leave it alone.  That’s fine under most market conditions, but as risk managers, we think there are a few ways to game the system.  After all, we might make our annual contribution right at the top of a long-term price peak and watch our balance and recent investment, immediately shrink.  While that’s always a possibility, we can improve our odds by doing one simple thing.

We can be disciplined about buying market discounts.

Of course, in rare years like 2017, there are no discounts (ie market pullbacks).

But for all other market years, we typically see at least one if not two pullbacks of 10% each.  For 2018, we’re going to see at least one and it should be larger than 10%.

So here’s the recommended plan for our 2017 College Investment.

Given that we still have a few business days left, we’re going to:

  • Change our “Future Contributions” allocations from whatever investment you have chosen, say an “Aggressive” allocation to 100% cash.  This does not mean change your “Existing Funds” allocation to 100% cash but rather just direct your future contributions to cash.  We are going to use one of our two annual transactions to make this change if you don’t already direct your contributions to cash.  Got it?
  • Make your contribution for 2017 – up to $14,000 per parent per child.  Here’s the best site for all the details, rules and restriction on the amounts you can gift each year to 529 Plans.

https://www.savingforcollege.com/articles/how-much-can-you-contribute-to-a-529-plan-in-2017

Contributions to 529 plans are deductible against state income taxes so let’s not pass up on the opportunity to cut our tax bill and put money away for our kid’s education at the same time.  Let er rip.

  • Wait for a reasonable pullback in the market to change your “Existing Fund” Allocations to a fully invested portfolio.  Remember, after making your contribution to cash now, you won’t be fully invested right?  Once again, you will be using one of your two available transactions to make this change.
  • Follow this Red Sky Report regularly looking for instructions to make the change described in #3.  These instructions will happen after the market has completed a correction and the risk of loss is much lower.  We can also use this discount in 2018 as our opportunity to make our 2018 contributions!  We call these instructions “Calling All Cars”.  Stay on the lookout for these notices.
  • Bonus Advanced 529 Investor Action Item – If you still have both of your two annual transactions left for 2017.  Use one to change the “Future Contributions” to cash as described in #1.  Use the other to change your allocation of “Existing Funds” such that you have at least 10%, preferably 15%, of total portfolio assets invested in Emerging Markets.  Be careful not to choose an option that will direct your “future contributions” to this new allocation in the process.  This is an option for those who actually put together their own portfolios of individual funds rather than choosing one of the present risk buckets, like “Aggressive” or “Growth”, or any of the Age-Based Solutions.

This recommendation and advice is based solely on market risks and opportunities today and does not take into account any individual investors’ situation including the ages of your children, proximity to college, etc.  If you have specific questions about your situation, we would be happy to offer individual advice which may be different than everything you just read.

Now, go to your plan website and get er done before the year expires. Tick Tock.

For those of you that have not yet opened a 529 Plan, but are considering doing so, please review the important 529 Plan Information Guide below.

Sincerely,

Sam Jones

_________________________________________________________________

CollegeInvest 529 Plan Guide

Eligibility: Anyone can establish a 529 Plan in Colorado but would only qualify for an income tax deduction if they are a CO taxpayer.

Tax Benefits: CollegeInvest Savings Plans allow Colorado residents to deduct every dollar you contribute to your account from your Colorado state income taxes in the calendar year you make the contribution.

Earnings on your account can grow federal and Colorado state tax-deferred.

Withdrawals for qualified higher education expenses are also exempt from federal and Colorado state taxes.

Annual Limit for Gift Tax Exclusion: $14,000 single/$28,000 married couple per beneficiary in a single year without federal gift tax consequences.

Maximum Lifetime Contributions:  Colorado maximum lifetime contributions for a 529 Plan is $400,000. The aggregate balance of all accounts for the same beneficiary under all Colorado 529 Plans cannot exceed this limit.

Management of the CO 529 Plans: Colorado has 4 different plans as follows:

CollegeInvest Direct Portfolio – Managed by Vanguard

https://www.collegeinvest.org/our-savings-plans/direct-portfolio

Scholars Choice 529 Savings Plan – Managed by Legg Mason

https://www.collegeinvest.org/our-savings-plans/scholars-choice

Smart Choice 529 Savings Plan – Managed by FirstBank

https://www.collegeinvest.org/our-savings-plans/smart-choice

Stable Value Plus 529 Savings Plan – Managed by Metlife

https://www.collegeinvest.org/our-savings-plans/stable-value-plus

Using the 529 Plan: The beneficiary can use the funds in the 529 Plan at any eligible higher education institution; private or public college or university, in state or out of state, trade or graduate school, in the nation and many abroad.

CLIENT DRIVEN Q AND A

Client Driven Q and A (Continued)

Of course, any conversation these days with clients can’t finish without discussing the BIG question;  What’s going to happen next year?

I’ll take a stab at it as my one and only 2018 Investment Forecast.

Reversion

Admittedly, market returns in 2017 came in about 5{1de7caaf0b891e8de3ff5bef940389bb3ad66cfa642e6e11bdb96925e6e15654} higher than even the upper end of our range of possibilities offered in January of last year.  Things change during the year making forecasting generally a foolish, grandstanding venture.  I don’t know why we even do it as we’re strictly trend followers by nature.  Forecasting is inherently predictive, quite the opposite of trend following.  Anyway, things are pretty stretched to say the least across multiple asset classes, which presents a clear moment for us to identify obvious risks and opportunities.  When any of these plays out is anyone’s guess, but they will happen eventually.  So this Investment Forecast will be a bit different.  I’m not going to talk about S&P 500 price targets or timing of market peaks and troughs.  Instead, I’m going to focus on a simple theme of reversion and let the markets work out the details of when all of this will happen.  It might even happen in 2018!

When we speak of reversion in financial market terms, we’re generally talking about a thing moving in a reverse course back to some form of normal place from an extreme place.  Now a thing can be a security like a stock, an asset class, an industry sector or even a country-specific index.  A thing can also be a behavior, specifically among the market players.  And finally a thing can be a policy stance from a central bank.  Let’s open our minds and look for “Things” that are stretched far to one extreme and likely to revert back to a more normal level.

Bonds are Ready to Revert

I’ve said this many times in the last several years but the potential for wealth destruction in bonds of all sorts with only a few exceptions is likely to be larger than any other asset class.  I am talking about a historic moment for the economic textbooks, which will look back at 2017 as perhaps the last chance to sell bonds before losses became real and almost unimaginable according to modern era standards.  European bonds are the worst offering of them all and I cannot fathom how the ECB will get out of trouble gracefully.  The ECB is the only buyer of European bonds left in the world.  I’m going to say the odds of a sovereign credit market default in Europe are probably one the highest in history now.  High yield Euro bonds were coming to market at negative yields a few weeks ago.  Practically, that means that we investors should PAY an annual yield for the right to own a very low-grade bond issued by a company with zero principal protection and a high degree of default risk.    Wow, write that down because it won’t ever happen again in your lifetime.  Even after five rates hikes by the Federal Reserve here in the states, our bond market isn’t much more attractive.  Bond interest rates bottomed in 2012 across all maturities and all bond grades.  Prices have generally been falling now, although not precipitously, for almost five years.

Investors can handle mild losses over a long time.  But they can’t handle large losses over any period of time.  We have not seen the latter situation yet when selling begins to intensify, leading to more selling, and eventually panic.  I am expecting bond prices to fall and accelerate into a long term down trend reversing nearly 30 years of rising prices.  We should expect interest rates to continue rising also at an accelerating pace, driving inflation higher also for the first time in nearly two decades.

Shrewd investors with experience in these situations (none under the age of 50) know how and where to make money in these types of environments.  I’ll provide a short list for you as I just turned 50 and qualify to speak to these things 🙂

Cash – with a reasonable amount of your investment portfolio

Banks – love higher lending rates

Hard assets – base metals, energy, select commodity groups

Inflation Protected Bonds – the only man alive in the bond pit

Domestic, small and mid cap stocks with attractive valuations

Emerging Market stocks held in local currencies

Commodities are Ready to Revert

As bonds are beginning to really break down on a longer basis, the All Season Investor (wink) will turn his gaze to commodities as the next asset class likely to run higher from a business cycle standpoint.  That is where we are right now.

Let me give you a few stats

If we drop a measuring pole on July 7th of 2008, we see the following results in the three major food groups

The S&P 500                                                       + 113.94{1de7caaf0b891e8de3ff5bef940389bb3ad66cfa642e6e11bdb96925e6e15654}

30 year Treasury Bonds                                 +  80.47{1de7caaf0b891e8de3ff5bef940389bb3ad66cfa642e6e11bdb96925e6e15654}

Commodities Tracking Index                       –  64.22 {1de7caaf0b891e8de3ff5bef940389bb3ad66cfa642e6e11bdb96925e6e15654}

Ok now, if we are smart investors we try to buy low and sell high.  I would buy commodities, slowly deliberately and consistently while selling bonds aggressively and without hesitation expecting both asset classes to revert back simultaneously to less stretched positions in the coming years.  Today, we continue to accumulate positions in energy, some metals, and even a few commodity index funds.  We own almost no bonds.  Clients can follow along if you care to as we make this dynamic change in our (your) holdings.  In the chart below, the Green line is the 30 year US Treasury bond and the Red line is the basic Commodity Tracking Index.  The gap between these two will close, somehow, in the years to come but again timing is everything.  If the economy slips into recession, the gap will widen.  Today, there are virtually no signs of recession on the horizon.

US Stocks Will Revert

I do see some sort of reversion in the primary benchmark stock indices, especially in the US.  Any way you turn it from a timing perspective, or valuations, or the sudden appearance of bubbles in things like Crypto currencies, or sentiment, or percent ownership of US stocks, or historically low cash levels in portfolios, we are getting close to a tougher cycle for stocks.

As of today, consensus investor expectations for 2018 are for a relatively smooth 10-11{1de7caaf0b891e8de3ff5bef940389bb3ad66cfa642e6e11bdb96925e6e15654} gain in any of the US benchmark stock indices.  From a statistical valuation basis, we might see a 4{1de7caaf0b891e8de3ff5bef940389bb3ad66cfa642e6e11bdb96925e6e15654} gain if conditions remain stable but with a downside risk of 25-37{1de7caaf0b891e8de3ff5bef940389bb3ad66cfa642e6e11bdb96925e6e15654} .   The sharp analyst will recognize that the current risk to reward ratio is no longer favorable.  That doesn’t mean you can’t make money or are doomed to lose but rather, the odds of another big year of double-digit gains are just pretty darn small.  Right now, investors are only looking up, earnings are healthy,  price gains have been even stronger, and we just got the long awaited tax reform.   That’s a lot of perceived good stuff that is now in the rear view mirror.  Focus on what’s next and be open to a different outcome than what is being suggested.

Investor Attitudes Will Revert

Today and for much of the last five years, investors have done well.  As time has moved on with ever higher prices, the perception out there is that passive indexing with zero cost ETFs if about as good as it gets in terms of costs and returns year over year.  The DIY investor is feeling empowered by their success, many of whom are not old enough to have even seen or experienced an actual multi-month decline in stocks of any magnitude.  Some investing veterans have even forgotten what it feels like and are sitting on portfolios of 80-90{1de7caaf0b891e8de3ff5bef940389bb3ad66cfa642e6e11bdb96925e6e15654} concentrated stock indexes.  Our own conservative community foundation where I sit on the board, feels “very comfortable” with a 75{1de7caaf0b891e8de3ff5bef940389bb3ad66cfa642e6e11bdb96925e6e15654} allocation to stock index funds.  All of this makes me very uncomfortable.

Meanwhile, risk managers are grinding through this cycle of understanding and accepting the situation for what it is.  We work hard to capture as much of the market’s upside as we can without compromising the standards and process behind our risk management systems.  As a group, if we can make 70{1de7caaf0b891e8de3ff5bef940389bb3ad66cfa642e6e11bdb96925e6e15654} of the gains generated by the benchmark stock indices in these cycles, that’s a huge victory.  Risk managers never draw a lot of attention when perceptions of easy returns with passive indexes are so dominant.  The seas are calm and sailing is easy.  But as any sailors knows, conditions change and we will enter a period of high seas with some destructive capacity.  There are cycles to everything.

During these times, our client money will follow our Net Exposure model which mandates moving us largely to safety, early in the downtrend. Meanwhile, attitudes among the masses, gradually shift from greed to doubt to concern and ultimately to many sleepless nights as values continue to fall lower and lower without much cause.  In our experience, investors avoid admitting error or really start selling in earnest until they are down 15{1de7caaf0b891e8de3ff5bef940389bb3ad66cfa642e6e11bdb96925e6e15654} from any recent highs, usually more.  Selling begets more selling and attitudes turn deeply negative on stocks and the future.  This whole process takes nearly two years on average.  It’s brutal.

The Lighthouse Project

With that said, we are going to finish 2017 by initiating the “Lighthouse Project”. This project involves any of our Red Sky Report readers and our clients who have friends or family that you care about.

Here’s the project

If you know of someone who is an investor in indexes and leaning on things like diversification to mitigate risk, please make them aware that we are now turning on the light in the Lighthouse.  When conditions become less productive and clear sailing gives way to darkness with no land in site, we want to be your Lighthouse, bringing you safely to harbor and out of harms way.  Diversification does very little to limit losses in a bear market.  When it goes, everything goes and this time bonds may be leading the way down.   Besides, most investor portfolios aren’t even diversified.  I see them every day.

There is no obligation to do business with us but let us provide you with a free stress test of your portfolio, against rising rates, against a falling stock market or rising inflation.  All of these things will happen and few have any concept of how this might impact their portfolios.  We can plug your holdings into our Hidden Levers software and run many different scenarios based on actual price action in the past to determine future outcomes.  Let us shine some light on the unknown risks in your passive portfolio.

               Pass this offer on to someone who can use the help and get it done before objectivity leaves the scene.   Going into 2018 with no risk management system in place is just reckless in my opinion.  

Click – The light is now ON!

I hope everyone has a fantastic holiday with friends and family.  Enjoy it all!

Cheers

Sam Jones

WILL TAX REFORM BE GOOD FOR THE ECONOMY?

By clicking through to the story, you agree to a short but painful lesson in economics and a surprising answer to the question!

Tax Reform – What We Know

A huge thanks to our wealth management CPA partner, Dustin Nelson for his helpful presentation on the current tax reform act at our full house Solution Series event last Thursday. Dustin provided the current plans as they stand from both the House and Senate as well as tried to distill a lot of unknown tax law in high probability action items. It was a huge task but he handled it well. The presentation slides can be viewed HERE if you are willing to spend the time…I’d say it is worth your time.

I don’t want to get into the weeds of the tax reform act itself given all the unknowns but there is a clear orientation to where the changes are directed so I’d like to speak to that. Specifically, tax reform is being sold to the American public as a good thing for our economy, for jobs, for income, etc. Now prepare for an economics lesson. I actually had to dig up my old macro econ textbooks to clarify this in my mind.

Let’s start with the basic assertion that tax cuts should stimulate economic growth or the growth in our Gross Domestic Product (GDP). GDP is effectively a measure of our country’s Output as the summation (combined sum) of Labor (L) and Capital (K). Now for the brain damage.

Here’s the equation for Economic Growth

Growth of Output (O) = Growth of Capital (K) + Growth of Labor (L)

K is used as a symbol for a very specific type of capital. It stands for investments in research and development, job training, infrastructure, facilities, and things like robotics and automation hardware. By this measure, our investment in K, as a country just hit an 11 year low. We have not largely invested in K in years for quite a few reasons, which I won’t go into now. Instead, companies are choosing to sit on great gobs of cash and the Velocity of Money is also sitting at all-time lows. Trillions of dollars’ worth of cash is sitting idle in our country today.  The key point to remember is that we need to see growth in K in order to see a meaningful change in Output (or GDP).

K is not to be confused with another type of capital, which in the econ world is signified by the small letter – c. “c” represents the type of capital that most in our country would call financial capital. These are things like company earnings, profits, and bank deposits. If you notice there is not a “c” in the Output equation.  Now if we asked 10 people on the street what I meant by Capital, 10 of them would answer “Investments like stocks and bonds!” They would be right but in the context of measuring Output or economic growth, they would be

The only type of Capital that matters with regards to real economic growth is the K type.

Now let’s shift to Labor (L)

The growth of Labor (L) = growth of the Labor pool itself + Labor productivity.

The most recent stats I have seen suggest that the labor pool is only growing by a value of 0.70{1de7caaf0b891e8de3ff5bef940389bb3ad66cfa642e6e11bdb96925e6e15654} and labor productivity is pegged at a value of 1.2{1de7caaf0b891e8de3ff5bef940389bb3ad66cfa642e6e11bdb96925e6e15654}. combining these with simple math we see that the Growth of Labor = roughly 1.9{1de7caaf0b891e8de3ff5bef940389bb3ad66cfa642e6e11bdb96925e6e15654}.  These are both very low numbers and a function of retiring baby boomers, a relatively large number of potential labor that have fallen out of the workforce and relatively low worker productivity. Now, back to our original equation. Let’s plug in the value of L.

Growth of Output = Growth of K + 1.9{1de7caaf0b891e8de3ff5bef940389bb3ad66cfa642e6e11bdb96925e6e15654} (Growth of L)

Now for more than a decade, our Output as a country (GDP) has been stuck at a growth rate of 2{1de7caaf0b891e8de3ff5bef940389bb3ad66cfa642e6e11bdb96925e6e15654}. That stands to reason since K is basically 0 and our Labor contribution is 1.9{1de7caaf0b891e8de3ff5bef940389bb3ad66cfa642e6e11bdb96925e6e15654}. To be fair, the last two quarters of GDP have come in right at 3{1de7caaf0b891e8de3ff5bef940389bb3ad66cfa642e6e11bdb96925e6e15654} so maybe we’re starting to see a little pickup K? We can only hope.

Let’s bring it back to the question of whether or not the current tax reform act will stimulate economic growth. Spoiler alert – It will not.

Why?

Because, the entire essence of all the changes in the tax reform act are not oriented toward increases in K, which we desperately need, but little c. Cutting corporate taxes from 35{1de7caaf0b891e8de3ff5bef940389bb3ad66cfa642e6e11bdb96925e6e15654} to 20{1de7caaf0b891e8de3ff5bef940389bb3ad66cfa642e6e11bdb96925e6e15654} will increase profits and cash. There will be some benefit to select groups who might see some increase in their net take-home pay at the end of a year. This again is cash. Cash might be spent giving a little pump to consumption and earnings but again, we’re still talking about little c, not BIG K.

Summary statement; If the Tax reform act goes into place, we are only likely to see a modest pump to stock prices with little to no change in actual economic activity or growth. The question I am wrestling with now is how much of this benefit has already been pulled forward into the gains we have already seen in 2017. Some for sure.

Let me wrap this up with a final bit of news. There is a provision in the new tax code that offers some incentives for companies to invest in K in the form of expensing and accelerated depreciation. That again is good for the company bottom line as they can say build a factory and expense most of it in the first year cutting their net income and their tax burden. Again, good for little c and maybe good for K. It really depends on how many companies are ready to invest in K. So far, almost none.

But here’s some sad truth. Companies today are making investments in automation and robotics that are essentially replacing workers. This is happening across multiple industries at an alarming rate. Workers are being replaced by software as a service, automation, efficiency to the degree that we have an entire middle class wondering what just happened to their careers? Here’s a graphic example.

You can figure out what happened here right? Employees in Oil and Gas drilling are being replaced with automation as rigs are coming back online since mid-2016. So, the next time someone tells you that renewable energy is hurting American workers in Oil and Gas, you can correct them. The Oil and Gas industry is hurting American workers in the Oil and Gas industry all by itself.

Back to the Point

The new form of investment in K, as it’s happening now, is, unfortunately, a huge unemployer by way of investments in automation and robotics replacing people. If we think about the equation for economic growth, you begin to see the big picture. If K goes up (increases in investment in automation and efficiency technology), then necessarily, some portion of Labor (L) will likely fall. In other words, for any increase in K, we could easily see an increase in unemployment. We’re obviously a bit stuck.

All in, tax reform is highly unlikely to turn the needle of our country’s economic growth beyond a little wealth effect from a rising stock market. But then again, stocks only rise sustainably when economic growth is rising.

I’m hoping this helps make sense of what’s really happening with the current tax reform act as it stands today. It’s all about pumping the stock market so you-know-who can get a little credit.

Will someone please forward this to the White House?

Best of luck to us all.

Sam Jones

BEST GUESS ON TAX REFORM

Welcome back from the Thanksgiving holiday. It’s always a favorite and I hope everyone had a chance to get a little goofy with friends and family, as life is just a bit too serious these days. This is a big week for the widely anticipated legislation on “sweeping” tax reform. The ball is in the Senate’s court. Here’s how I see things shaking out as well as three scenarios for a reaction from the US stock market.

Change Is Good

I look at politics and the trail of policies, laws, orders, standards, etc as a pendulum. Clearly, under Obama, the pendulum swung way left over a period of 8 years with significantly higher taxes for high-income earners and major wealth redistribution programs like the Affordable Care Act (ACA). Don’t hate me for calling that out. We swung wide with an expansion of social safety nets and entitlement programs aimed at supporting the growing number in our country who truly needed help. Obama was also a bridge builder with our foreign partners. You may or may not like all of the agreements made with our trading partners, but we made a lot of them right? If I were to package all of Obama’s efforts, most of them were really about closing the wealth inequality gap in our country. Was it successful? Probably not if one were to really measure wealth inequality in 2008 and then again in 2016. The needle didn’t really move much, which speaks more to the realities of where power and influence still lie in our country.

Thus far after more than a year in office, Trump has had zero legislative wins. His attempt to Repeal and Replace the ACA was rejected by Congress, twice. Looking back, we can only put our finger on a storm of executive orders, several of which have been rejected by the supreme courts as unconstitutional. Honestly, I would love for the Senate to find some way to amend the House proposal on tax reform so we can see some change in our tax system. I would hope that the “broadest sweeping tax reform we have seen in nearly three decades” would beneficially touch all income earners and businesses in a lasting and meaningful way. After all, taxes are a financial headwind to everyone, especially those who tend to spend most of what they make.

So, while there is plenty of reason for our leaders to get together on an equitable solution to tax reform, I don’t see it going smoothly.

Expect No Agreement Anytime Soon

Ask yourself this question. Why would Congress suddenly find common ground on taxes, especially the current House proposal? There is so little in the proposal that could be considered neutral or Senate friendly, I just can’t imagine the Senate will roll over and accept the current proposal, or even a minority part of it. Several key Republicans in the Senate have been suggesting as much all week. With high confidence, I will say that upon return from the holiday break, Congress will not find common ground on the current tax reform proposal this week. Maybe by year end in a highly modified form but probably not until 2018 if at all. Don’t forget, Congress never settled on a budget either, nor DACA, nor the debt ceiling or anything really. All issues were kicked down the road with a December 8th deadline. In fact, I’ll wager that we see another government shutdown before Christmas.

Corporate Tax Cuts Will Not Increase Wages

Just as Obama’s entire tenure in the White House was aimed at supporting lower-income families, those without healthcare, the elderly, etc. Trump’s Administration is just the opposite. He is working hard to swing the pendulum fast and hard in the opposite direction. He is about supporting big business, business owners and generally the owners of investment assets. It should be no surprise that the House bill on tax reform has very little substance that would benefit middle and low-income households. If you look under the hood of the House approved tax reform bill, you will find proposals to permanently cut taxes for corporations and businesses, including pass-through type businesses like S corps and LLCs. You will also find small offsetting changes to the tax code that will mildly impact households who do not own businesses or tend to be simple wage earners. However, these are temporary changes with expiration dates. We hear about the estimates that most wage-earning households will see up to a net $2000/ year change in their take-home income. Now match this up against the proposed benefit to big corporations who can potentially pocket net benefits measured in hundreds of millions.

Tax cuts for corporations and businesses are being sold on the basis of Reagan era trickle down theory; if business does well, then business will raise wages and the economy will expand. Well, it didn’t happen with Reagan and it won’t happen now. Why? Because corporations are already sitting on a record $1.7 Trillion in cash. Free cash flow is also healthy, as are earnings. Look at the stock market! Corporations have been actively using some of their huge treasure chests to affect share buybacks, increase dividends to shareholders and acquire other companies. Does this sound like a segment of our country that is suffering under the heavy weight of high taxes? Not at all, in fact, their effective tax rate is not 35% but in the mid 20% range which happens to be very competitive with global standards. And, lowering corporate taxes will not trickle down into higher wages given the current situation.

Why not?

If corporations felt compelled to raise wages in order to attract or retain talent in the last three years of near full employment in our country, they certainly have had the cash to do so. Cutting taxes for these same cash-rich corporations will NOT compel them to raise wages. That’s ridiculous. What is really happening is that whenever there is any scent of rising wages or falling profits, employees are quickly outsourced or replaced by software, automation or the internet. Our working class knows too well that their jobs are disappearing or becoming obsolete (coal, manufacturing, grocery, retail, etc). Make no mistake; wage pressure (up) in our country is gone for a while in most industries. Handing corporations higher net income with a lower tax rate will do nothing to help the working class in our country. Absolutely nothing. It will just add cash to the current pile of cash. Yes, earnings and corporate balance sheets can improve but Trickle Down isn’t a valid selling point.

Likewise, a wealthy person with very high income does not spend more when they experience lower taxes as Trickle Down Theory also suggests. Wealthy people spend what they want to spend always and invest the rest. They are not economically as sensitive as the rest of the country. A tax break might mean a little more investment dollars but they will not buy more than they already do naturally. Actually, sadly, the wealthy tend to be less charitable when taxes are lower. Yes, you guessed it; charitable giving is largely about cutting your tax bill in our country. Lower taxes means fewer reasons to make charitable donations. No offense to those who are genuinely and graciously giving for all the right reasons but you must know you’re in a small group.

All said the Trickle Down pitch is not one that is widely accepted in our country. So the very root of the current tax reform bill is also not very acceptable in its current form. Any deal in the Senate will have to be less dependent on this false premise.

Market Reaction – 3 Scenarios

Let’s break this into three scenarios.

1 – The first will be one in which the Senate magically approves the current House bill and the tax reform bill becomes law more or less as is.

Likelihood – 2% chance (there’s always a chance right?)

Outcome – Under this scenario, the stock market could have another reasonably good year in the range of 10-12% gains for 2018 as earnings and investment would continue to expand allowing valuations to remain somewhat constant. The Fed would be more aggressive about raising rates, however, putting a lid on the prospect of a blow out year (higher).

Winners- Stock market, corporations and the wealthy who own a lot of stock.

Losers – the 2/3rds of our country who will not see much change in their net worth or who don’t have much in the way of financial assets. Remember that the average American has less than $15,000 in retirement investment assets.

2 – The second scenario is a highly modified version of the Tax bill which gives more permanent breaks to lower income households and less of a cut to corporate taxes and businesses.

Likelihood – 60% chance

Outcome – A more muted return for the stock market in 2018 in the range of 4-5% with the lower boost to earnings, lower level of additional investment from the wealthy and a consistent headwind of the Feds raising rates gradually.

Winners – Most everyone, as the economy could grind higher, household and business balance sheets would improve slightly providing a generally favorable economic picture.

Losers – Not many!

3 – The third scenario is no deal at all as Congress remains deadlocked and fails to get the 51 votes needed in the Senate.

Likelihood – 40% chance

Outcome – LESS THAN 0% gains for US stocks in 2018. The risk of recession rises as the sharply higher costs of Healthcare and rising rates begin to cut into GDP, earnings, and consumer spending. Note – the bond market is currently forecasting this outcome as witnessed by the nearly inverted Treasury Yield curve which has a long history of occurring near the beginning of recessions.

Winners – The US government debt and the Fed who would no longer be held responsible for crushing the economy.

Losers – Just about everyone. The unemployment rate suddenly starts to rise, earnings struggle to improve on a year over year basis, corporations cut back on expansion plans and get defensive again.

Looking across all three scenarios, it’s pretty obvious that our legislators are in a very tough spot. Compromise is a career ending move politically, but no deal could easily be the catalyst for our next down cycle in the economy. Some variety of tax reform is almost critically necessary at this point to keep our economy (jobs, stocks, activity) slogging forward. Let’s hope for a deal of some sort.

These are important times in our country and the outcome of tax reform (or not) could very well shape the direction of the financial markets in the upcoming year. As always, it is not the news that matters but the market’s reaction to it. Let’s all pay attention, both hands on the wheel now.

Please join us on December 7th for our final Solution Series of the year. The topic? Tax Reform presented by Dustin Nelson our capable CPA wealth management partner! We are almost full so please RSVP if you have not already done so to secure your spot.


Hope to see you soon.

Sam Jones

ARE YOU ELIGIBLE TO INVEST IN STOCKS?

Based on valuation levels today and the true “Risk Capacity” found among investors, most households would probably not qualify to own stocks in any significant portion. This is an important update for everyone. Understanding Risk Capacity is critical to your survival as a career investor. Most don’t have a clue what that means and we are approaching another moment when it really matters.

Are You Part of the 1{1de7caaf0b891e8de3ff5bef940389bb3ad66cfa642e6e11bdb96925e6e15654} Club?

The rich are getting richer, the poor are getting poorer and the middle class is about to find out exactly how little tax reform is going to help them. Don’t be surprised in a year or two when you recognize that a system governed by billionaires tends to favor billionaires and the wealth gap in our country will become wider than we have ever seen. So what does it take to be in the 1{1de7caaf0b891e8de3ff5bef940389bb3ad66cfa642e6e11bdb96925e6e15654} club these days? According to Forbes, the top 1{1de7caaf0b891e8de3ff5bef940389bb3ad66cfa642e6e11bdb96925e6e15654} income is now 25 times the average income of the other 99{1de7caaf0b891e8de3ff5bef940389bb3ad66cfa642e6e11bdb96925e6e15654}. In some states and havens for the rich, like New Jersey, Jackson Wyoming or Stamford CT, you have to make over $1.25M/ year to qualify. What’s the point? Income is a key determinant of one’s capacity to take on risk. Now risk comes in many forms but, let’s limit this conversation to investment risk and even more specifically, the risk of owning stocks at today’s prices. I will argue that at today’s valuation levels, few beyond the true 1{1de7caaf0b891e8de3ff5bef940389bb3ad66cfa642e6e11bdb96925e6e15654} in our country, really have any business reaching for big stock allocations, owning overvalued securities or anything in between. On a purely empirical level, most investors simply don’t have the necessary Risk Capacity to own what they own today.

Risk Capacity with regards to owning stocks today is just like it sounds. It is our ability to tolerate adverse events without those events impacting our daily decisions, lifestyle, our ability to service our debt, our legacy plans for future generations, etc. Adverse events are code words for deep corrections or bear market losses in excess of 20{1de7caaf0b891e8de3ff5bef940389bb3ad66cfa642e6e11bdb96925e6e15654}, a job loss, a costly health issue or any other negative factors. Risk capacity is really about our dependence on our current investment balances for any reason. Before getting into examples, let’s touch base on current valuations. They are high, very high, and now above the levels that we saw in October of 2007, just prior to the last “Adverse Event”. Bespoke did the numbers this week looking at valuation levels across sectors. It’s hard to find anything attractive – maybe telecom?

Now let’s add another graphic to the discussion courtesy of Kitces.com. This one offers a nice matrix to help you understand how Risk Capacity and your Willingness to Take on Risk dictate a very different orientation to the market than you might expect.

Let’s get back to the 1{1de7caaf0b891e8de3ff5bef940389bb3ad66cfa642e6e11bdb96925e6e15654} as our first example. This crew has very high-risk capacity (way right on the horizontal axis), mostly by income but also as a function of net worth and general resiliency in the face of bad outcomes. The 1{1de7caaf0b891e8de3ff5bef940389bb3ad66cfa642e6e11bdb96925e6e15654} are naturally accredited investors as per the IRS and the SEC meaning they can afford to lose a great deal of investment capital without compromising their lives or the lives of others. They are able to service their debt rain or shine and they do not live hand to mouth in any way, including withdrawing any significant amount of investment capital out for living expenses. They live on a fraction of the income they earn and generally don’t touch their investments beyond adding to them regularly. Effectively they will never outlive their money so their money has a very long time horizon, like multigenerational. Note, the investor’s age has very little to do with time horizon.  The 1{1de7caaf0b891e8de3ff5bef940389bb3ad66cfa642e6e11bdb96925e6e15654} are quite savvy with personal finance and have arrived at this level of wealth through personal effort, taking prudent risks, investing, education and of course some degree of entitlement (born in the right place at the right time). Looking back at the chart above, we see that IF they are also willing to take on risk, then they qualify to run an “Aggressive” portfolio, presumably very heavy in stocks other risk assets. Note- the Aggressive portfolio option is the very smallest of all available options. You must have both a high level of risk capacity and high willingness to take risk. Practically, for the many 1{1de7caaf0b891e8de3ff5bef940389bb3ad66cfa642e6e11bdb96925e6e15654}’ers that I have served over the years, few are really willing to take on a lot of risk despite their high risk capacity. They recognize and respect what can happen in a stock-heavy portfolio and they just don’t need the brain damage given their net worth. They are more interested in consistency, a moderate return and high capital preservation (our offering). They quantifiably have a moderate tolerance for risk and therefore end up with portfolios that would correlate to the inside edge of the yellow “Moderate” arc.

Now let’s look at another example, the opposite case in fact. Let’s create an investor household who maybe youngish, who has not really experienced the harsh realities of a bear market and who is just starting their wealth accumulation. They might even have a healthy job (s) that pays their bills but doesn’t leave much in the way of savings or discretionary income. They are starting families, buying first homes, and ramping up. There is no shame in this; We all started this way. It is what it is. Our industry would say, “hey you’re young, you have a long time horizon, you should be all in, almost 100{1de7caaf0b891e8de3ff5bef940389bb3ad66cfa642e6e11bdb96925e6e15654} in aggressive stocks or concentrated stock index funds at the very least.”  But when we consider Risk Capacity for this investor, it presents a different picture. Their risk capacity is actually, quite low because they don’t have any buffer against adverse events at this stage. Or, in the event of a job loss, they regularly need to access investment accounts to cover today’s living expenses. In my experience, those who have little or no buffer against job loss or declines in investment portfolios are always the ones that tend to sell everything at the lows and be more reactive to adversity. It’s really common sense. When there are mouths to feed and you don’t have much to lose, risk capacity is actually very low. Here again, the classic Time Horizon argument is deeply flawed when behavioral economics comes into play. This household clearly has very low risk capacity until they either make more income or build up their investment portfolios.

The common error I see is that this household of new investors often thinks of themselves as highly willing to take on investment risk (high on the vertical scale). While that might be the case, their position in the horizontal scale is still firmly set to the left. Plotting these two, our second household couldn’t/shouldn’t have much more than a very conservative portfolio (ie very few stocks as a percentage of total).

But here’s the most important part of this discussion:

We must ask ourselves some basic questions about risk and opportunity when designing our portfolio. Answers based on Risk Capacity and Willingness to Take Risk are actually pretty cut and dry. One simply needs to acknowledge who they are, where they are in their financial lives and their real tolerance for adverse events. If those are honest assessments, our portfolio design should follow. But, we also have to weigh in the current conditions of the markets (stocks, bonds and commodities). When things are as overvalued as they are today, we have to know that someday, perhaps some day sooner than you think, we’re going to start seeing some “adverse events”. Today, I hear TV guys shrug and say, yeah we should expect a little more volatility in 2018.  A little more volatility?  So, if we’re trying to decide what kind of investor we really are, and we’re wrong or deceiving ourselves in some way, the markets will not be very forgiving given today’s valuations. When things are cheap, you can make allocation mistakes and still make money.

This is a critical time to be real and honest about your personal risk capacity. If you have migrated to a heavily exposed stock or stock index portfolio in the last several years following the returns, you still have time to make changes if you shouldn’t be there. We’re here to help if you need it.

Sorry for the lecture but it’s that time.

Cheers

Sam Jones

BIG NEW INVESTMENT OPPORTUNITIES

It’s going to be huge! It’s going to be really, really great. Ok, I’ll stop although I can’t imagine publically speaking like that.  Seriously speaking, in the last couple of weeks, two of our three Big Investment Opportunities have already begun to take shape offering smart investors a value-oriented place to put your money. Hint, it’s not the S&P 500. For your ease of reading, I have put our shameless suggestions in BOLD throughout this update. Please do your own homework and remember that this does not constitute personal financial advice for anyone in particular.

Japan – The Sun Also Rises

Look at this chart! Anyone who has been an investor for any period of time has to look at this and get very excited about owning a piece of Japan. We are doubled up on Japan now after taking our initial positions in March, May and June. The Nikkie has been forming a long base going all the way back to 2002 and has finally, and decisively broken into a new bull market JUST THIS WEEK. Regular readers know that one of our great long-term investment opportunities described back in September, was to overweight Internationals and Emerging Markets. We suggested that a 40{1de7caaf0b891e8de3ff5bef940389bb3ad66cfa642e6e11bdb96925e6e15654} allocation is not too much.

The Japanese economy has been in various stages of recession with sequential bear markets since 1989, almost three decades. Much had to do with cultural issues, bad leadership, an aging population, and overextension in the late 80’s. But with the new Prime Minister, Shinzo Abe, and an adoption of modern central bank policies together with an active program to devalue the Yen and support their export markets, Japan is back in gear and a great value. By the numbers, Japan is still one of the top countries in the world in terms of contribution to global GDP. In fact, on his recent visit, Trump had this to say to the Prime Minister on his way out after three days of lavish entertainment.

“The Japanese people are thriving. Your cities are vibrant and you’ve built one of the world’s most powerful economies,” Trump said at a press conference on the final day of his visit. But then the President paused before adding a personal addendum. “I don’t know if it’s as good as ours. I think not. O.K.? We’re going to try to keep it that way. And you’ll be second.”

Donald Trump to Shinzo Abe, PM.

… and you’ll be second, ok?

Who says something like that?

On the other hand, why am I surprised?

Buy Japan

Other internationals, especially Asia, and Emerging markets continue to plow higher outperforming the US markets by almost two times and coming from a much more attractive valuation base with real, unengineered economic growth.  This continues even as the US dollar has moved higher in the last several weeks giving us more confidence that international strength is not just happening on the back of a weak dollar.

Hold Big Allocations to Internationals

If you need to cut some exposure, sell US stocks.

Commodities Are Back

Commodities are an asset class and represent many things.  These include gold, silver, metals, “softs” like pork and corn, as well as oil and gas. For five years, commodities in aggregate have had a very tough time. There are commodity indices that include all groups that look like this. Ouch. But focus in on the lower right corner of this chart where you will see a clear break out from a two-year basing pattern.

We said in our Three Big Investment opportunities to be watchful for a new bull market in commodities but it might take a while to materialize and wouldn’t likely happen until oil prices looked more constructive. Well, we were wrong. Oil prices have recently surged and are now angling toward $60/ barrel while metals and other commodities continue to march higher. Now all the food groups for the commodity asset class are in gear just as inflation is coming back, just as the Fed is raising rates and just as we would expect when the economy moves into Stage 4 of the business cycle.

Buy Commodities –Commodity Index Funds or ETFs


We are now moving into Stage 4 which means, look for opportunities to sell bonds, accumulate inflation sensitive groups like commodities and hold stocks for now (although selectivity matters more).

There is one important caveat to the emergence of commodities to the scene. Stages 4 and 5 can be very short especially after a rather long bull market in stocks. This bull market is now the second longest and largest in history if one pegs the start date in March of 2009. US stock valuations are now the second highest in history. Inflation from wage growth, and now commodities, price inputs, together with four rate hikes from the Fed, (soon to be five), has a tendency to put a cap on earnings and lead us into recession.  The last strong period for commodities was, you guessed it, 2007, the year before things got upside down in real estate, our economy and global financial market. Commodity strength marks the end of bull markets, not the beginning. It is the last thing to happen in the business cycle in theory and in practice.

In early October, when the S&P 500 hit 2550, we said, “attempts to generate big gains from here would be like picking up nickels in front of a steamroller”. Thus far, since October 5th, the S&P 500 has pushed up a total of 38 points to 2590. That’s a little over 1.5{1de7caaf0b891e8de3ff5bef940389bb3ad66cfa642e6e11bdb96925e6e15654}.

Nickels…

Leave them on the road and don’t get squashed

Keep what you have but avoid the temptation to move heavily into stocks with cash or bonds until we see a significant correction – or bear market.


Today marks one year since Trump’s election victory. I have nothing good to say about what I have seen so far, so I’ll just sign off and leave it at that. 


Have a great week.

Sam Jones

THE MAGIC OF THE GAIN KEEPER STRATEGY

The Magic of the Gain Keeper Strategy

Continuing with our strategy insights theme, this update will provide a look under the hood at the unique management strategy we have developed inside our one and only variable annuity.  Results have followed the excellent design.  Enjoy.

What is a Variable Annuity?

As I drove home yesterday, I listened to one of those Ken Fisher ads on XM radio suggesting that investors stay away from all annuities.  He pegs them as evil, full of fees and false promises.  Well, first I want to thank Ken Fisher for being such an excellent source of new business for our firm over the years.  Investors love Fisher Investments when stocks are in a bull mode.  But, there is always the aftermath of gains, the yang to the yin and the great drama that tends to follow.  After investors lose 40,50, even 60{1de7caaf0b891e8de3ff5bef940389bb3ad66cfa642e6e11bdb96925e6e15654} of their portfolios, we tend to see a nice steady inflow of new clients upon realization that risk management is not part of their program.  Second, Ken is wrong about “all” annuities. They come in many shapes and sizes.  Granted, most are of the type that Ken brands as predatory. They are effectively high cost, broker-sold, commission heavy insurance products chock full of internal expenses that most don’t even know they are paying.

But, there are some good variable annuities.

We work with Jefferson National, which has such a unique offering that Nationwide just bought them earlier this year.  They describe the offering using the brand “Flat is Beautiful”.  Flat describes their cost structure, which is simply $20/ month.  That’s it.  $20/ month for virtually unlimited tax deferral.  NO surrender charges, No internal mortality expenses and No bloated mutual fund fees.  Trading is free on their platform and they have a very healthy line up of mutual funds to choose from; many of which offer real alpha opportunities for active managers like us.  Their site has quite a few neat tools to do your own calculations as well.  Just for giggles, I used their variable annuity comparison tool to compare the differences in costs between the Jefferson National Variable Annuity and AIG’s Variable Annuity, which I owned once upon a time. I entered a few inputs like a base investment of $200,000, a return of 6{1de7caaf0b891e8de3ff5bef940389bb3ad66cfa642e6e11bdb96925e6e15654}, and my Federal and state tax rates.  This was the output looking at cost savings over a 20-year period.

$80,373 in cost savings!

That is enormous considering the account balance was only $200k.

So Ken is right in the sense that most annuities are very costly but he probably hasn’t done his homework to find this diamond in the rough.

The Magic

One of the nice parts about the mutual fund options inside the Jefferson National Variable annuity is that they have a huge universe of leveraged sector, index and country funds offered by the Profunds and Rydex groups. Leverage means that we can own a fund that moves 1.25 to 2.0 times the daily movement of the corresponding index, country or sector.  A few examples, which we own today, are:

Rydex 2x Dow Jones Index Fund

Rydex 2x Japan Fund

Profunds Biotech Ultra Fund

Profunds Oil and Gas Ultra Fund

These are fast movers and can certainly cut both ways in terms of adding and subtracting from returns.  Our job is to own the leading sectors on a relative strength basis according to our well-defined Selection process. If we do our job well, we get a lot more bang for our buck, given the leverage inherent to these securities.  Sounds risky, right?  It is if it’s not done correctly.  To help mitigate volatility, we limit our total exposure to these funds to 70{1de7caaf0b891e8de3ff5bef940389bb3ad66cfa642e6e11bdb96925e6e15654} of total available assets, while 30{1de7caaf0b891e8de3ff5bef940389bb3ad66cfa642e6e11bdb96925e6e15654} is allocated to fixed income or corporate bonds (or cash).   That way, we can manage our notional value (total amount factoring in leverage) of money exposed to stock and keep it under 100{1de7caaf0b891e8de3ff5bef940389bb3ad66cfa642e6e11bdb96925e6e15654} while only using 70{1de7caaf0b891e8de3ff5bef940389bb3ad66cfa642e6e11bdb96925e6e15654} of available assets.  The other 30{1de7caaf0b891e8de3ff5bef940389bb3ad66cfa642e6e11bdb96925e6e15654} tends to make the ride a little smoother and adds a margin of return to the equation.  We also apply the same Net Exposure criteria to the Gain Keeper strategy as we do to all of our strategies,  guiding us to heavy cash positions during bear markets. Voila!  Again, the success of this program really comes down to execution and timing of investments, like all investing right?

Performance

Please make sure to click through to our Composite Performance Disclosures and make note that past performance is no guarantee of future returns.

Feel free to visit our detailed strategy page on the website for lots and lots of data

http://monthly.allseason.liquidindexes.com/report/1501

A few Highlights

Since inception, the strategy has slightly outperformed our benchmark, the MSCI All Country World Index (ACWI) net of all fees.

Total returns net of fees since inception 3/28/2008- 10/31/2017:

Gain Keeper     +71.35{1de7caaf0b891e8de3ff5bef940389bb3ad66cfa642e6e11bdb96925e6e15654}

ACWI                 +69.20{1de7caaf0b891e8de3ff5bef940389bb3ad66cfa642e6e11bdb96925e6e15654}

*Remember, that the benchmark is 100{1de7caaf0b891e8de3ff5bef940389bb3ad66cfa642e6e11bdb96925e6e15654} invested in stock all the time and has all the gains and gore that comes along with it.

More importantly, given the downside risk controls, tactical use of leverage and incorporation of the income allocation, our Gain Keeper annuity has generated those returns with only a 45{1de7caaf0b891e8de3ff5bef940389bb3ad66cfa642e6e11bdb96925e6e15654} correlation to the benchmark, and statistically clients experienced 45{1de7caaf0b891e8de3ff5bef940389bb3ad66cfa642e6e11bdb96925e6e15654} less volatility than if they had invested directly in the benchmark, based on weekly standard deviation measures.  This program offers greater downside controls, lower weekly volatility, and slightly better returns.  That is a winning strategy that is now approaching its 10 year anniversary.  YTD, the strategy is solidly in double digits again.  Remember these gains are also tax-deferred, just like an IRA.  For clients with larger taxable accounts, recent business liquidation, inheritance, or divorce proceeds, we find Gain Keeper to be an attractive option for sheltering taxable gains from tax, thus the name, “Gain Keeper”.  Contributions are not limited like an IRA or Roth but are not tax deductible either.  Most of the same rules regarding the timing of withdrawals, as you’d find in an IRA also apply to annuity contracts.  When considering the variable annuity, we encourage clients to read through the annuity brochure and contract and let us help you understand all of the details.

So that’s all the magic I have for today.

Enjoy the last days of fall, 8’ of snow in the forecast for Steamboat.

Cheers,

Sam Jones