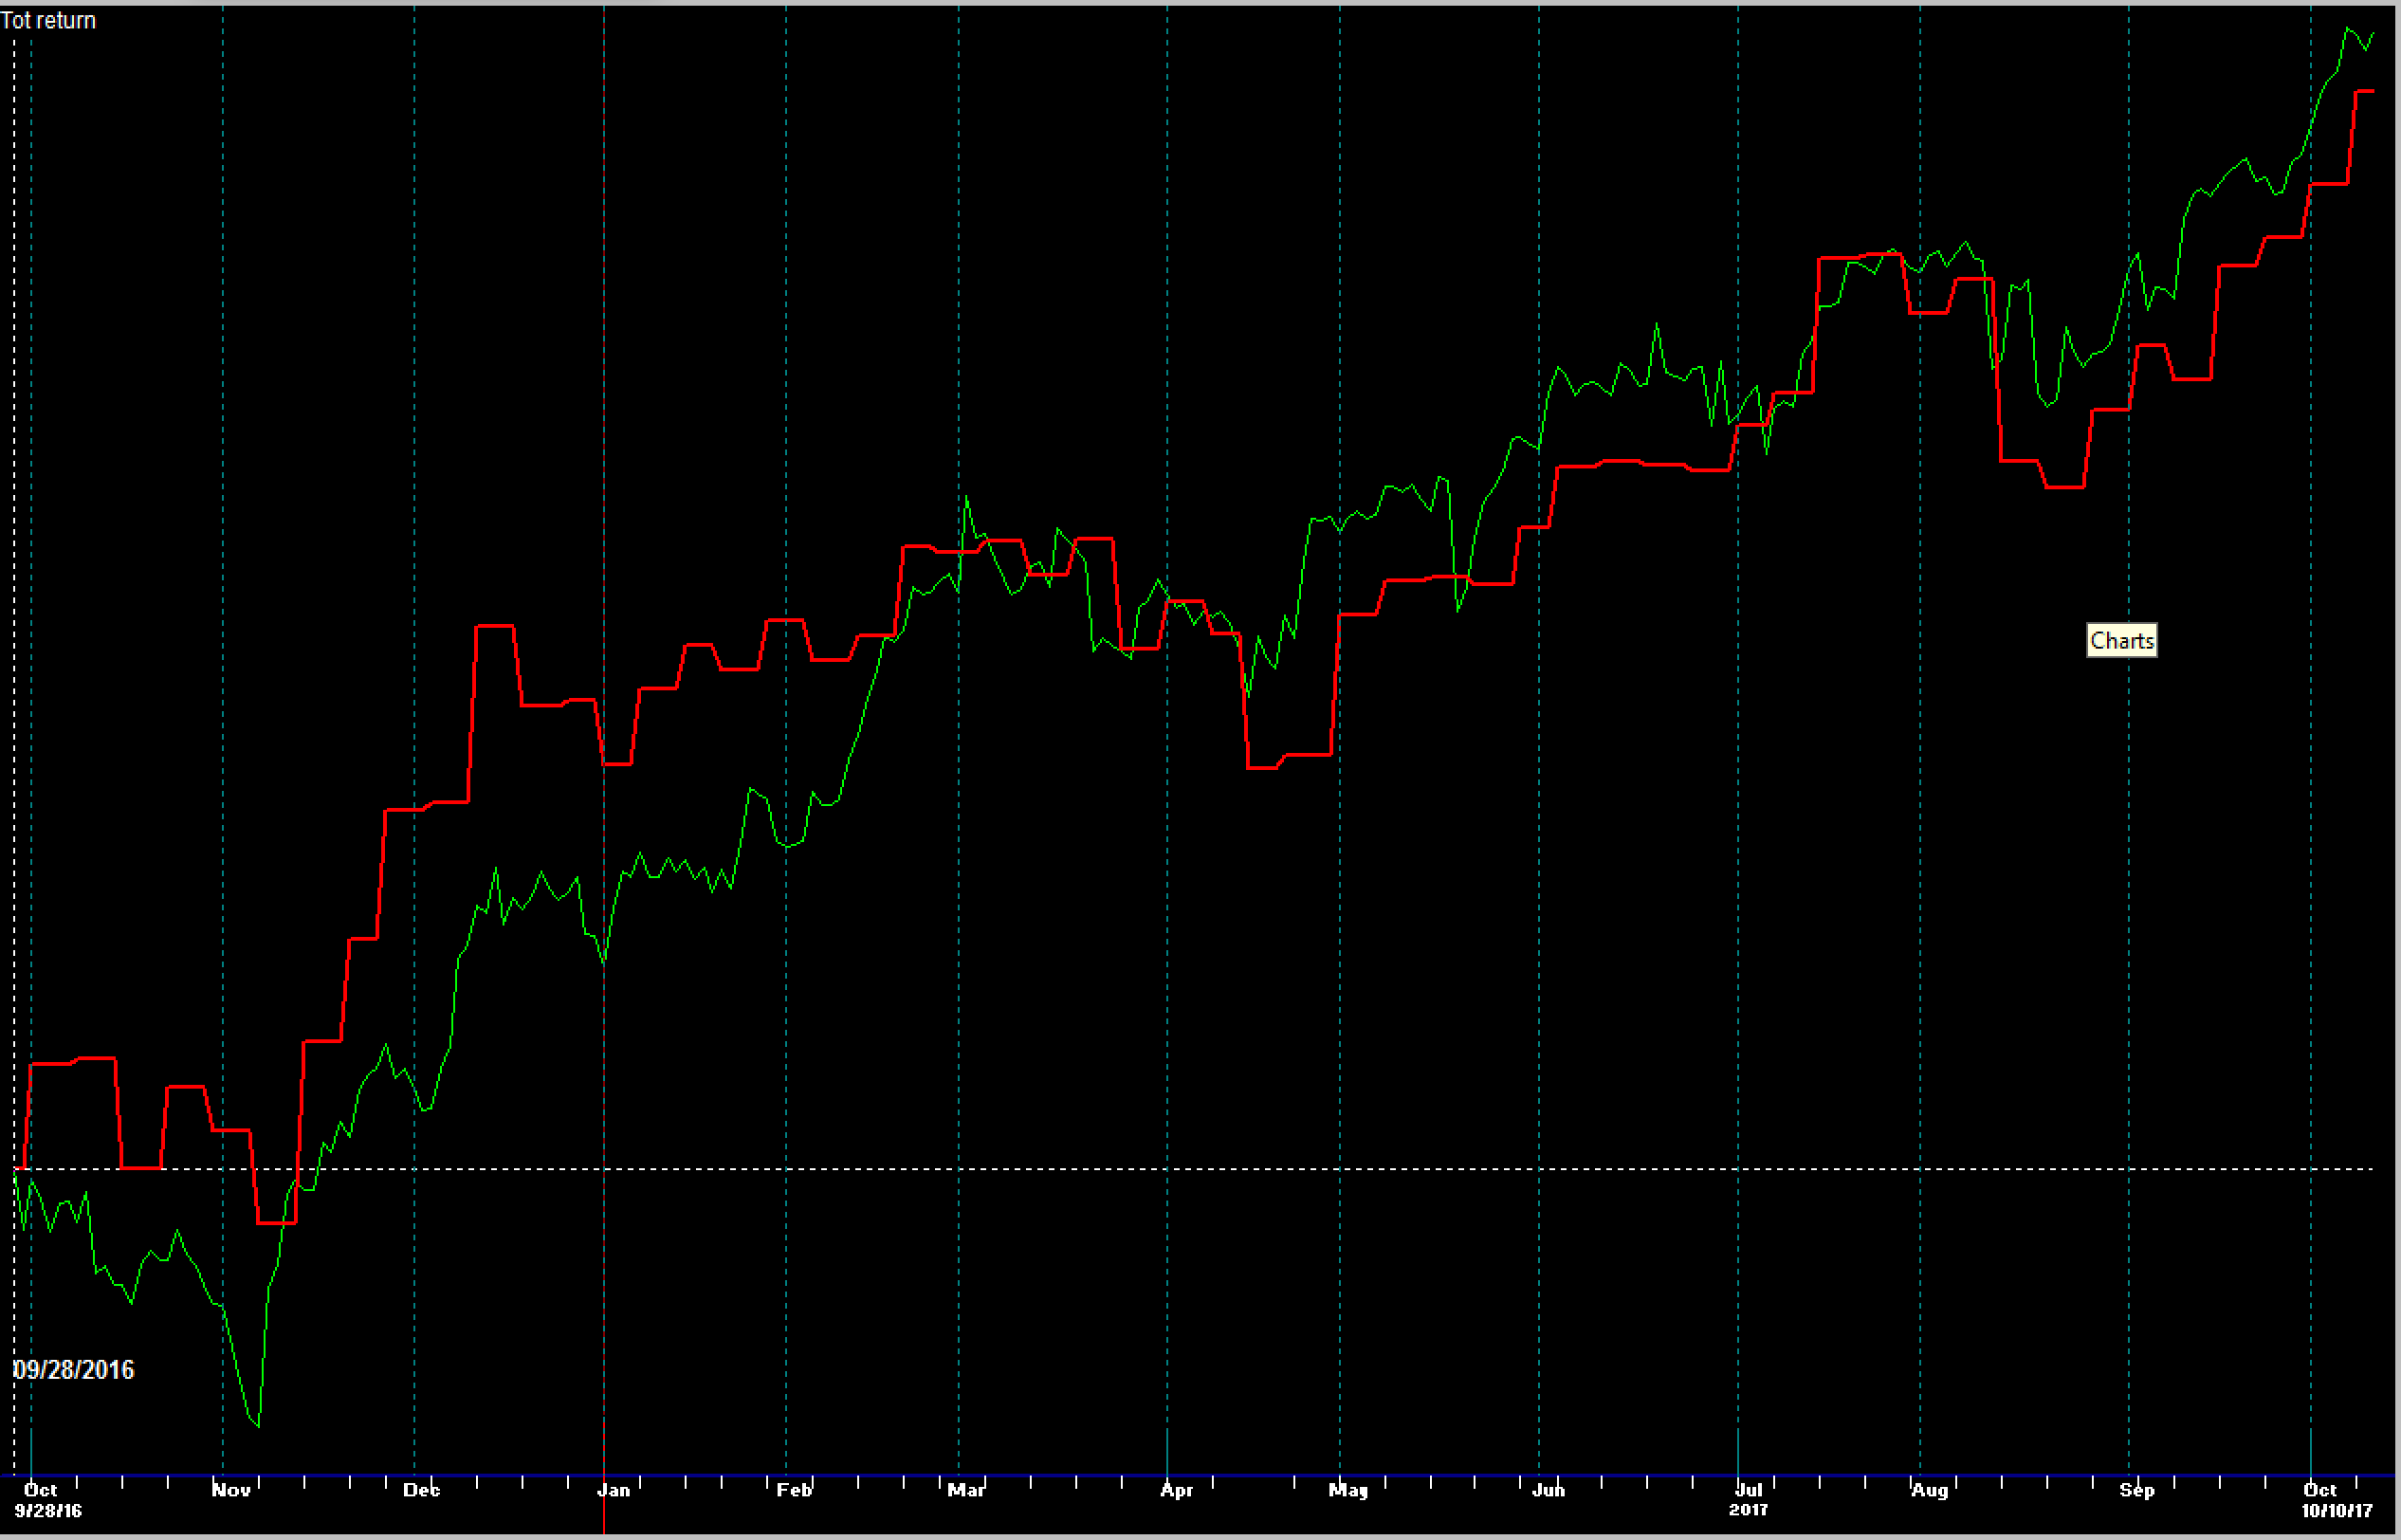
Worldwide Sectors Extreme Makeover One-Year Results
As promised, we’re staying on the theme of providing some strategy updates for current clients as we cross into the new quarter. For those in the know, our long-standing Worldwide Sectors stock strategy was redesigned at the end of September 2016. One year later, we’re very pleased with the results of the changes. Many of our current clients have an allocation to this strategy so it would be worth your time to understand why we made these changes, how the strategy works and the results of our work.
Evolution is Necessary
If you ever run into a money manager that says, “I’ve always done things one way because it always works”, you should run away. Wouldn’t it be nice if that were actually true? Students of market history know better as the markets are always changing and evolving in how they work, speed, products, information and so forth. For instance, computer trading has replaced pit traders almost entirely. Algorithm-based decision making has created quant monsters in our industry and flash crashes are the unfortunate response in prices. Exchange Traded Funds are now replacing mutual funds altogether. Portfolio construction theory is changing all the way down to High school academics – “Modern Portfolio Theory” is on the way out. There are now more indices than stocks available on the exchanges. What worked in the 90’s, doesn’t work anymore.
Many of our strategies were in operation and running in the late 90’s, including Worldwide Sectors. It performed incredibly well until the end of 2014, when the strategy began to uncomfortably lag the benchmark stock indices, even accounting for the lower risk profile. In 2016, we decided to tear apart the strategy in an effort to discover what we could do to improve our results and frankly keep better pace with strong bull markets in stocks. Here’s what we found.
The Main Problem
The main issue we discovered, early in 2016 was that the strategy was working hard to adjust our net exposure according to perceived market risks. We found that we were carrying too much cash overall through the year in a stock model where investors should be willing to tolerate more daily and weekly volatility. This was especially the case near intermediate-term lows in the market. As the speed of the markets has accelerated dramatically in moves both up and down in the last couple years, we couldn’t adjust our net exposure fast enough to provide any positive value in risk mitigation. Most of our holdings were individual stocks as well, making these changes costly and time-consuming. In the end, the performance of Worldwide Sectors started to fall behind that of any major stock index and we felt compelled to take a hard internal look. After many months of working through options, we thankfully landed on a few concrete changes to the design and execution of the model.
Start By Setting Goals
Our first task was to set a higher bar for returns but specifically for an improvement in our asymmetric returns. Practically, that means we wanted to “capture” more of the market’s upside gain without a commensurate rise in downside losses. We began tracking our quarterly upside and downside capture ratios relative to our benchmarks to create a baseline against which we could judge the outcome of our redesign. We established that we are seeking at least 75{1de7caaf0b891e8de3ff5bef940389bb3ad66cfa642e6e11bdb96925e6e15654} of the market’s upside gain while avoiding at least 50{1de7caaf0b891e8de3ff5bef940389bb3ad66cfa642e6e11bdb96925e6e15654} of the market’s downside losses. We calculate these metrics quarterly in order to reduce the amount of noise that comes from weekly or even monthly data.
Redesign Details
In order to keep more money invested when the markets were in bull market uptrends, we had to widen out our parameters a bit to let prices move more without triggering a sell signal. At the same time, we added more weight in our Net Exposure model to the basics of price trend, effectively reducing the noise that comes from more subjective indicators. We are trend followers, so let’s follow the trend! Keep it simple right?
The other main changes we made beyond our willingness to maintain a fully invested posture during bull markets, was the split between stocks and index-oriented ETFs. After careful consideration, we chose to allocate up to 70{1de7caaf0b891e8de3ff5bef940389bb3ad66cfa642e6e11bdb96925e6e15654} of assets in the Worldwide Sectors strategy to domestic “sector” investments, mostly in individual securities, paying special attention to our weightings in the three main food groups found among stocks: Cyclicals, Interest Sensitives, and Defensive relative to those found in the S&P 500. Sector stock picks are based on our longtime model of Selectivity, which chases down leadership and leans on growth companies selling at discounts (Growth at a Reasonable Price).
The remaining 30{1de7caaf0b891e8de3ff5bef940389bb3ad66cfa642e6e11bdb96925e6e15654} of assets is now dedicated to “World Stock Indices”, which can include both domestic and international indices. Admittedly, during strong bull markets, index investing in low or no cost ETFS is just hard to beat. Of course, in a bear market, everything beats a low-cost stock ETF. Timing is everything. So for this side of the strategy, we are hitching our wagon to the market, naturally reducing our tracking error and improving our “capture” ratios.
Together the two sides of the strategy now complement each other nicely between individual stocks, world stock indices and appropriate sector exposure. While the market has not challenged us on the downside literally since we made these changes, we can say that the upside results have been fantastic.
Results after 12 months
Please take a second to review our composite performance disclosure regarding the calculation of returns by following the disclosure links on our website. Given that these are unique date ranges based on our redesign from 9/28/2016, we can show only unofficial, internal results. From that date, through the end of September, the results are as follows net of all fees and expenses. Graphically, Worldwide Sectors is shown in Red and the S&P 500 is shown in Green.

Worldwide Sectors + 15.12{1de7caaf0b891e8de3ff5bef940389bb3ad66cfa642e6e11bdb96925e6e15654}
S&P 500 + 16.03{1de7caaf0b891e8de3ff5bef940389bb3ad66cfa642e6e11bdb96925e6e15654}
MSCI ACWI (All Country World Index) + 18.43{1de7caaf0b891e8de3ff5bef940389bb3ad66cfa642e6e11bdb96925e6e15654}
While we are not outperforming any one index, we are certainly keeping pace with a very strong market and doing so with statistically lower weekly volatility and lower risk exposure than any fully invested stock index. For any risk manager, that is an enormous accomplishment and we’re proud to see the fruits of our labor in upside returns. However, the next major test for this strategy will most certainly be about capturing these gains and avoiding losses so the story is not yet finished.
Next up – Gain Keeper, the surprise behind our variable annuity’s performance.
Stay tuned.
Sam Jones

