Well, here it is. The market environment has changed as our Net Exposure model indicated earlier this month. The “change” is really making it more difficult for investors on a lot of fronts, which we’ll discuss today. Also, the change requires that we adjust our approach and decision making criteria. Lots to take in.
The New Environment – The Best Days are Behind Us?
We said in the last update that this correction in the global stock markets, which now includes the US market, is different than the corrections we have seen in the last several years. We discussed the condition of the Valueline index which is now trading below it’s long term trend line and pointed to the deep dive in the “Summation Index” beyond anything we have seen since 2015.Leadership from the widely held FAANG names is also gone now. Meanwhile, the recession trades are on full blast including new strength in a few notable defensive groups (telecom, utilities, and consumer staples).Treasury bonds are starting to find support and everything cyclical like industrials, energy, materials, home builders, etc are just getting smashed every day. So all things considered, equity markets are forecasting recession ahead, or at least a dramatic slow down in global growth. Today, earnings are coming in just fine, very healthy in fact, but institutional money is hyper sensitive to “guidance” coming through those reports, many of which are focused on the negative impacts of the trade and tariff wars imposed by Trump. Revenues are also a bit soft indicating that sales are not as robust as they have been in the past. Furthermore, there are indications that rising costs from borrowing (Thank you Federal Reserve) and rising wages (employment at full capacity) are adding to expenses.So we have that tough economic MOMENT in time when earnings looking backwards are still good but critical eyes are worried that the best days are behind us. They are probably right but time will tell. Stock prices always reflect future expectations so we shouldn’t be surprised to see some rather aggressive selling if investors think the best is in fact behind us. Remember, stocks typically peak 6-9 months before the economy.
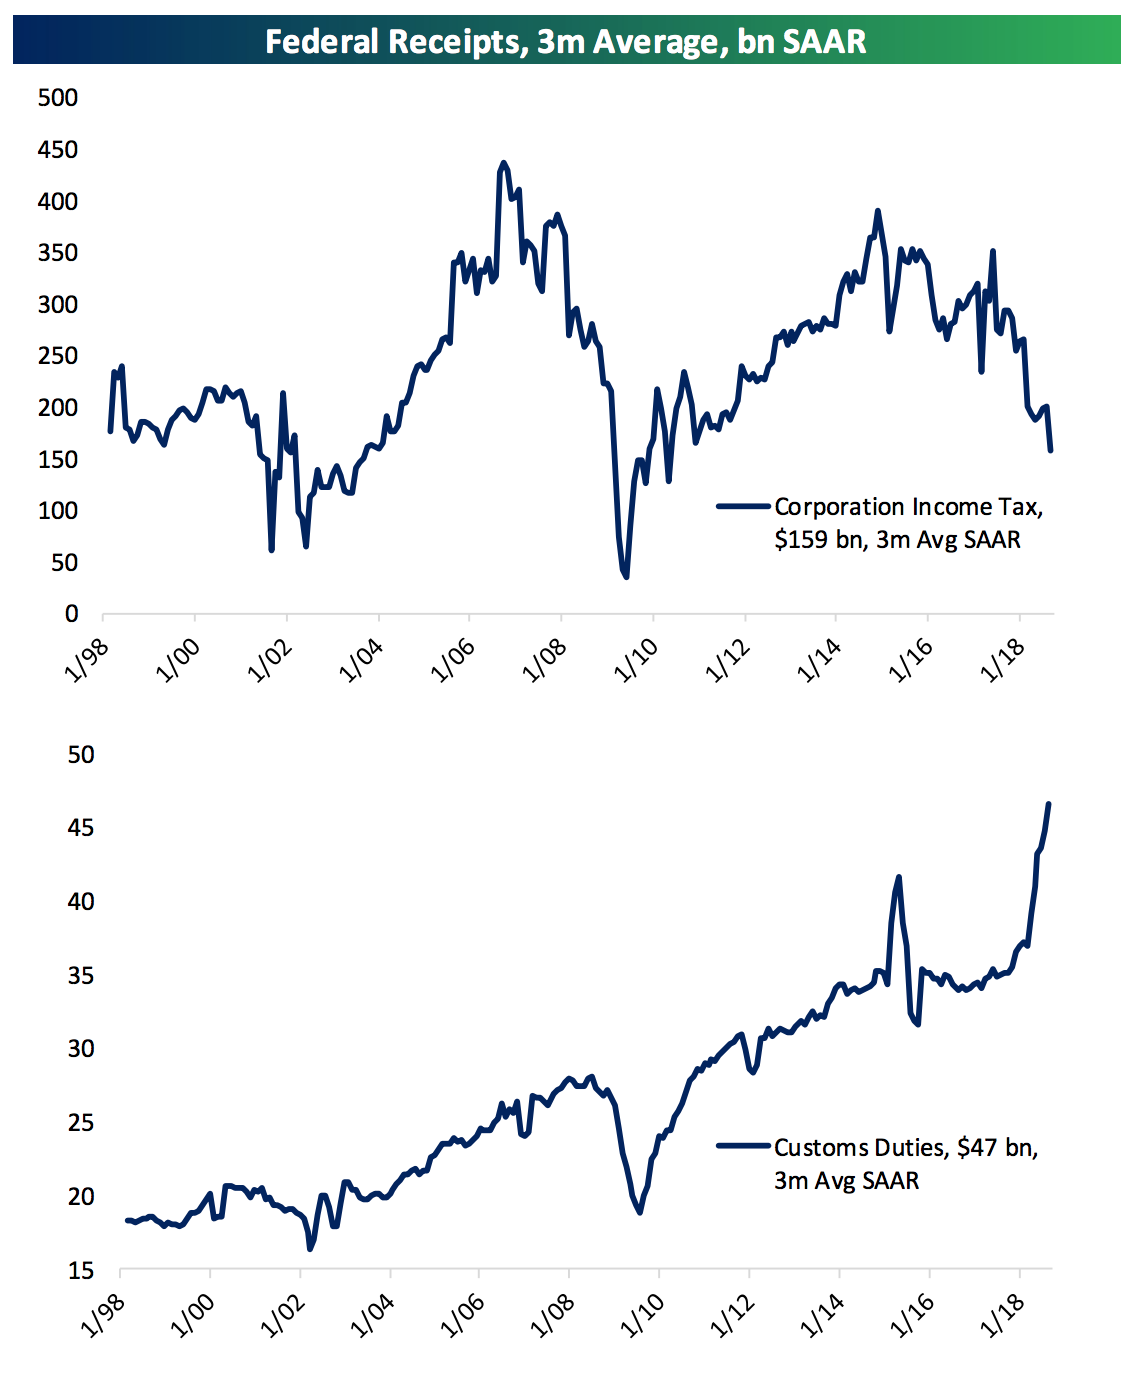
I saw this chart below from Bespoke and found it interesting.
What we’re looking at is two types of Federal receipts. The top chart is Corporate Income tax, which is now in a free fall following Trump’s Corporate tax cut. By the eye, we’re looking at a drop of nearly $200 Billion in lost tax revenue so far. The bottom chart shows the much smaller revenue coming from customs duties (aka tariffs). Again, by the eye, this is a gain of about $10 Billion since the tariff war began.What can we learn from these charts about the future?

Well we know that our deficit (Federal Debt) is exploding higher now, which is inherently inflationary and possibly one of the reasons why long terms bonds are no longer a benefit to any investor. Bonds have traditionally acted as a safety net for investors during times like these, but bonds are down dramatically and have been trending down for almost three years. We have warned many many times that investors need to wake up to the reality that long term bonds are not going to serve their primary function of mitigating losses this time. So far, those warnings are playing out. We can own short-term bonds and things like floating rate funds, or bank loans which do provide some income and ballast but that’s about it.
We also know that the additional $10 Billion in revenues coming from tariffs is being passed 100{1de7caaf0b891e8de3ff5bef940389bb3ad66cfa642e6e11bdb96925e6e15654} to the consumer in the form of higher prices and higher costs of goods sold.This too is inflationary.
So from these two simple charts, we begin to understand why the Federal Reserve is going to continue raising rates, why inflation is not going away and why corporate earnings could potentially get pinched here.
Asset Allocation Getting Tough For Investors
As indicated above, this is a tough environment for investors who have become quite complacent about potential market risk, their exposure to aggressive growth type stocks and passive stock index strategies. Most investors are not diversified at all after years of concentrating assets in things like the S&P 500 index or FAANG stocks. They don’t own much in the way of bonds, commodities or other non-correlated asset classes so they are no doubt beginning to worry here.
From our view, this is exactly the time for diversification to select commodities, playing defense by owning recessionary sectors, carrying high cash and owning short-term bonds of several varieties. More on how we are allocated specifically in a minute. The point is that long bull markets in stocks have the tendency to blind us a bit. We have been conditioned to buy dips like we saw in February. Never sell, never sit with cash, never own gold or bonds, and never own boring stuff like utilities and consumer staples. You might have heard the acronym TINA which stands for There Is No Alternative (to stocks).
TINA…. R.I.P.
Making Changes to Holdings – and our approach
These are the days when mature investors know they must adjust their holdings and methods. The trend for US stocks is now mostly negative if one simply looks at any number of broad market indices, especially outside the US and outside of large cap growth. When the trend is not our friend, we cannot simply sit by holding and hoping that the bull market will resume. We must respect the reality of what is, not what we hope will happen.We have been on the sell side of our portfolios since late September and accelerating our selling into October pushing our current cash and short-term bond positions to these levels.
Cash (including short term bonds like T-Bills and Floating Rate bonds)
Tactical Equity Strategies 35-45{1de7caaf0b891e8de3ff5bef940389bb3ad66cfa642e6e11bdb96925e6e15654}
Blended Asset Strategies 40-45{1de7caaf0b891e8de3ff5bef940389bb3ad66cfa642e6e11bdb96925e6e15654}
Income Strategies 70{1de7caaf0b891e8de3ff5bef940389bb3ad66cfa642e6e11bdb96925e6e15654}+
We also made significant changes to our remaining holdings to orient toward those recession proof sectors like consumer staples, utilities and telecom after selling out of our cyclical groups almost entirely (industrials, energy, technology, etc).You can find these defensive positions in your accounts easily by name (like Rydex Telecom, consumer staples or utilities).
This is also a time to consider closing out positions that are held at a loss for tax purposes. We have a few that fit this criteria so we plan to capture the loss at these levels, helping to lower our tax liability for the year and potentially reallocate to more productive holdings when we see reasonable set ups.
Finally, we are moving to short term trading systems where we buy oversold conditions, like now, and plan to sell those positions on a rebound knowing that the trade is likely to be short term. The goal is to offer our accounts and strategies some buoyancy even in a more protracted period of stock price declines. We are buying weakness (now) and selling strength (on a rebound). This is a zone where we should see a significant bounce as most of our short-term indicators are now deeply oversold. With that said, we have a tight stop on these short-term trades and will quickly sell if this level does not hold.
Downside Price Risk is Still Significant
Take a quick look at this last chart, which I doctored up drawing a few trend lines on the S&P 500 ETF (SPY). The long-term bull market trend is marked by the Green line dating back to the lows in 2009.I have also drawn a trend line across the recent lows since Trump was elected in dark blue.

If these lows don’t hold, the US market is likely to set course down toward the longer-term trend which is about -17{1de7caaf0b891e8de3ff5bef940389bb3ad66cfa642e6e11bdb96925e6e15654} below prices today. From the highs, that would be a 30{1de7caaf0b891e8de3ff5bef940389bb3ad66cfa642e6e11bdb96925e6e15654} decline and something worth avoiding.These are important days for investors to consider their tolerance for downside risk in the context of your age, proximity to retirement, need for regular cash and ability to recover from a loss of that magnitude. Given our high cash, orientation to defensives, and diversification away from stocks, our clients will obviously experience a different outcome as we have already seen in October.
Please stay tuned as conditions are changing rapidly.
Rest easy, you’re in good hands with risk controls firmly in place.
Sam Jones

