Wow, what a change one week can make. Conditions are changing very quickly now and this is a good time for an update on the markets and real estate considering the Housing Starts numbers reported this week. Time to wake up.
Net Exposure Analysis Says Raise Some Cash
For those who have been following our discussions regarding our investment process, you know that our first, and most important, screen is governed by our Net Exposure analysis. In simple terms, that means we take in a bunch of different variables, put them into the sausage maker and generate a weight of evidence driven recommendations for our net exposure to the markets. As of this week, the analysis suggests we start to raise our cash position. The main three ingredients to our net exposure model are sentiment (confidence, bullish and bearish surveys), fundamentals (valuations and economics) and technicals (internal indicators and price action). Regular readers know that on March 1st, 2017, the markets hit an internal high of sorts. We talked about March 1st seeing the largest inflow on record into the S&P 500 ETF (SPY). On Monday of this week, the S&P 500 made big headlines by pushing out to a very marginal new high, crossing the 2400 level by a total of 2 points. Strangely, something also happened or didn’t happen, on that marginal break out day. Not one of the 10 S&P 500 internal sectors made a new high. Normally, we would see 4-5 S&P 500 sectors confirm the move. In this case, not one. Honestly, I can’t tell you how the S&P 500 made a new high.
Other compounding evidence suggesting caution has been in play since late February including a decline in the ratio of stocks making all-time highs, weaker volume and more recently a strong drive toward optimism in the sentiment indicators. Jason Goepfert of Sentiment Trader.com is the master and he posted this list yesterday.
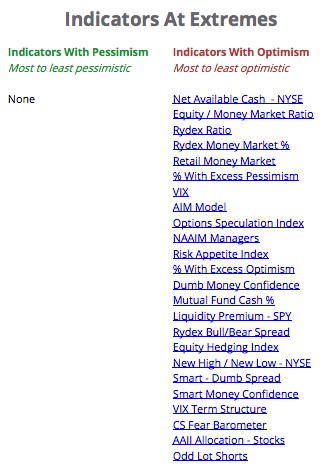

You don’t really need to understand each of the indicators above as much as recognize that all of them are piled up on the “optimistic” side of the balance sheet. When optimism hits extremes, relative to pessimism, there aren’t many places prices can go, but down.
Fundamentally, the economy is in reasonably good shape still with no signs of recession on the horizon but much of the current earnings have been priced into the financial markets. In fact, earnings have come in very strong this quarter, beating expectations by a decent margin and yet prices have gone exactly nowhere since March 1st. That’s a bit telling, adding to our weight of evidence. Furthermore, we know that valuations are still very, very high as they have been for over two years.
But here’s the most important point. The trend of the current equity and bond markets is all that really matters. We can look at all of this evidence and it can pile high suggesting the markets are going to do one thing or another. The evidence can paint a picture of a high risk or high opportunity environment for investors. Today the picture is of a higher risk environment. But in the end, we have to wait for the most important thing to happen and that is an actual break down in the price of action of the markets. This often happens last.
As I write, the S&P 500 just closed down -1.82{1de7caaf0b891e8de3ff5bef940389bb3ad66cfa642e6e11bdb96925e6e15654} indicating that the March 1st high is still the high of the year. Given the increase in the number of warnings coming over the last couple weeks and months, we have to give this new selling pressure some respect and begin to raise cash. Today, we did so in most portfolios by selling our weaker holdings or those that are pegged for upgrades while holding our leading investments for now. As conditions warrant, we’ll continue to make adjustments.
Now let’s talk about Real Estate
Housing Starts and Inventories Still Low
So here’s the conundrum that has Wall Street guessing as to what is going on in housing in the US. We’ve all heard the stories of bidding wars again in certain states. We’ve all heard that there are simply no homes to buy, that inventories are still at historically low levels and that prices will just continue higher. With that in mind, one would expect and anticipate builders to be going full tilt right now, working 24/7 just to keep up with demand. And yet, housing starts, which measure the number of new homes in the permitting phase, are not where they should be and just registered their second monthly decline! I’ll quote Bespoke and show their chart delivered today.
“Despite an eight-year recovery in the sector, current levels of starts are only now just at levels that were typical closer to the depths of prior recessions than at the peak of an expansion.”
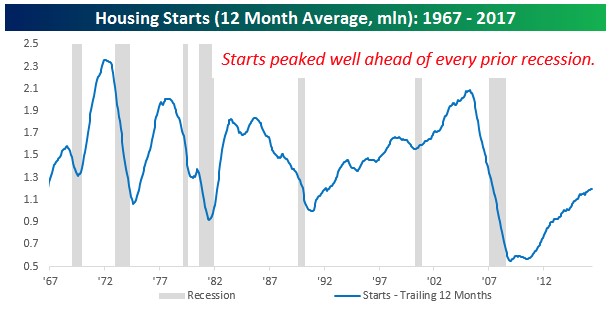

The chart above illustrates the quote. Even after a longer than normal economic recovery in the US, housing starts are still languishing behind other recovery periods in the last several decades. After factoring in increases in population since the mid-1950s, Bespoke argues that housing starts should be almost 60{1de7caaf0b891e8de3ff5bef940389bb3ad66cfa642e6e11bdb96925e6e15654} higher than reported today. The half-full perspective would say, give it time and home building will increase dramatically in the years to come and catch up to where they should be effective. Arguably, the trend is directionally up, so that perspective may play out. But for this update, I’m going to offer another explanation for why housing starts are lagging and could, in fact, be closer to a cyclical peak despite the very low inventory numbers.
Unaffordable Housing
Millennials are finally looking to buy their first homes. We said it would happen eventually but we didn’t expect them to delay those purchases by almost a decade. Unfortunately, like all buyers today, they are facing some very lofty prices in nearly every market of the country across all price ranges. Again, consensus opinion says, prices are high because there is no inventory so buyers must bid up prices to get the house, right? I don’t think it’s that simple. Consider these variables that are now aggregating together at one moment in space and time.
Land Costs are at an All-Time High
This is true for any available piece of buildable dirt. Builders need to buy an old home and scrape it to build a new one in more dense areas. Not cheap! To build a new home, your very first cost of land acquisition is at an all-time high.
Borrowing costs are rising Steadily
Believe it or not, interest rates bottomed in…. July of 2012, as did mortgage rates. We are now approaching five years of rising borrowing costs. Interest rates on a 10-year bond, which serve as the basis for mortgage costs, are up 62{1de7caaf0b891e8de3ff5bef940389bb3ad66cfa642e6e11bdb96925e6e15654} since July of 2012. Mortgages are not up quite as much but are darn close. It doesn’t feel terrible yet because today’s rates are still historically low but remember that 3{1de7caaf0b891e8de3ff5bef940389bb3ad66cfa642e6e11bdb96925e6e15654} is 50{1de7caaf0b891e8de3ff5bef940389bb3ad66cfa642e6e11bdb96925e6e15654} higher than 2{1de7caaf0b891e8de3ff5bef940389bb3ad66cfa642e6e11bdb96925e6e15654}. Buyers are facing rising monthly costs associated with a mortgage for a home that is at a historically high price.
Rising Costs of Building Materials
There is a lot of variability in the cost of materials to build a home as much depends on the quality of the home construction and the desired price point. But many materials, like concrete, copper, wiring, connectors, wood and steel are necessary to all. If you do some Google searches for building material costs, you’ll see that most bottomed in price in February of 2016 and have moved strongly higher by 20-25{1de7caaf0b891e8de3ff5bef940389bb3ad66cfa642e6e11bdb96925e6e15654} since then. I wouldn’t call it runaway inflation yet but these are some stiff price increases in just 15 months. Higher building material costs are passed on to the eventual buyer of course. But the key point here is that it costs a hell of a lot more to build a home today than it did just a few years.
Skilled and Affordable Construction Labor is Hard To Find
There are three variables coming together here. The first is that after the 2008 wipeout, many construction crews and workers had to find other work and many did not return to the industry. The second is that Trump’s adverse immigration policy is beginning to take root with fewer low-cost workers available from places like Mexico. The third is that the US economy is now at full employment (4.5{1de7caaf0b891e8de3ff5bef940389bb3ad66cfa642e6e11bdb96925e6e15654} unemployment). Everyone is already working in other industries and many are probably happy not to be out in the hot sun with a nail gun strapped to their belt. Homebuilders could raise wages as many project, but these costs would have to be pushed out to the final buyer on top of higher land costs and rising cost of materials.
Builders Don’t Make Money On Low-Cost Homes
If you sit in the builder’s seat for a minute and consider the situation, you might understand why a builder doesn’t want to build low price homes. Simply put, they make no money. Margins are razor thin when considering all of the rising costs associated with building a home (above) and the ultimate market or price points for “low price homes”. It is too expensive to build a low price home in a nutshell! So the builder hopes that they can stay in the higher end markets but those are pretty saturated now and the number of buyers in this space has really plateaued. This whole theme of swimming up stream to build a home for the super rich (only) is becoming pronounced in the custom home world. Last weekend, I heard a story of an architect who WOULD NOT work on any project less than $25 Million. Of course, I was in Aspen for the weekend, but still.
Back to the point and the alternate explanation for what’s happening. It goes like this;
Inventories of affordable homes are low, but rising building costs and higher borrowing costs are conspiring against the reality of any additional build-up in inventory. We may be approaching that gridlock moment where buyers can’t afford the current market and those who can afford it have already bought or given up on the prospects of moving. I want to point out that this is another sign of developing stagflation in our economy, like the 70’s and early 80’s. Stagnant growth and inflation is the makeup of the word, Stagflation.
The more important point to this entire discussion is the potential impact on the economy. Real estate is an enormous contributor to US growth rates, employment, consumption and aggregate GDP. We saw our first “Great Recession” in 2008 associated with a collapse of real estate (caused by, in my opinion) for instance. Today, the situation is quite different in that prices of real estate could stay high due to lack of inventory, but the number of transactions could take a serious nosedive based on lack of affordability. If I had to choose, I would choose this situation over the one in 2008, as real estate prices will likely stay steady keeping household wealth intact. But the negative impact on the economy as real estate activity begins to slow and eventually stop, could be meaningful. Take heart that these are slow moving trends indeed and at this point, there are virtually zero signs of recessions in the current system. I would suggest, however, that we all open our minds to a different outcome than the one projected by consensus opinion regarding real estate trends and subsequent growth in the US economy.
All in, this is a good time to stay focused and pay attention to what’s happening. I see a lot of complacency out there regarding the markets and real estate.
Until next time
Sam Jones
