While we’re always big fans of buying anytime there is a discount, or a reasonable looking entry point, it appears to be too early to buy this dip right here, right now— unless you fancy yourself to be a short-term trader. In fact, we might need to wait longer than normal for our next opportunity to develop. Here’s what we see that indicates this decline may prove to be more than the standard price corrections we have seen in the last two to three years.Remember, these are good days for investors, when value and opportunity are on the rise as prices come back to more attractive levels. We are going to take a few lumps, yes, but that’s part of investing. But, we also try to keep our losses recoverable and our capital intact for that all-important time when real investors make real money.
Three Year Trend is Broken
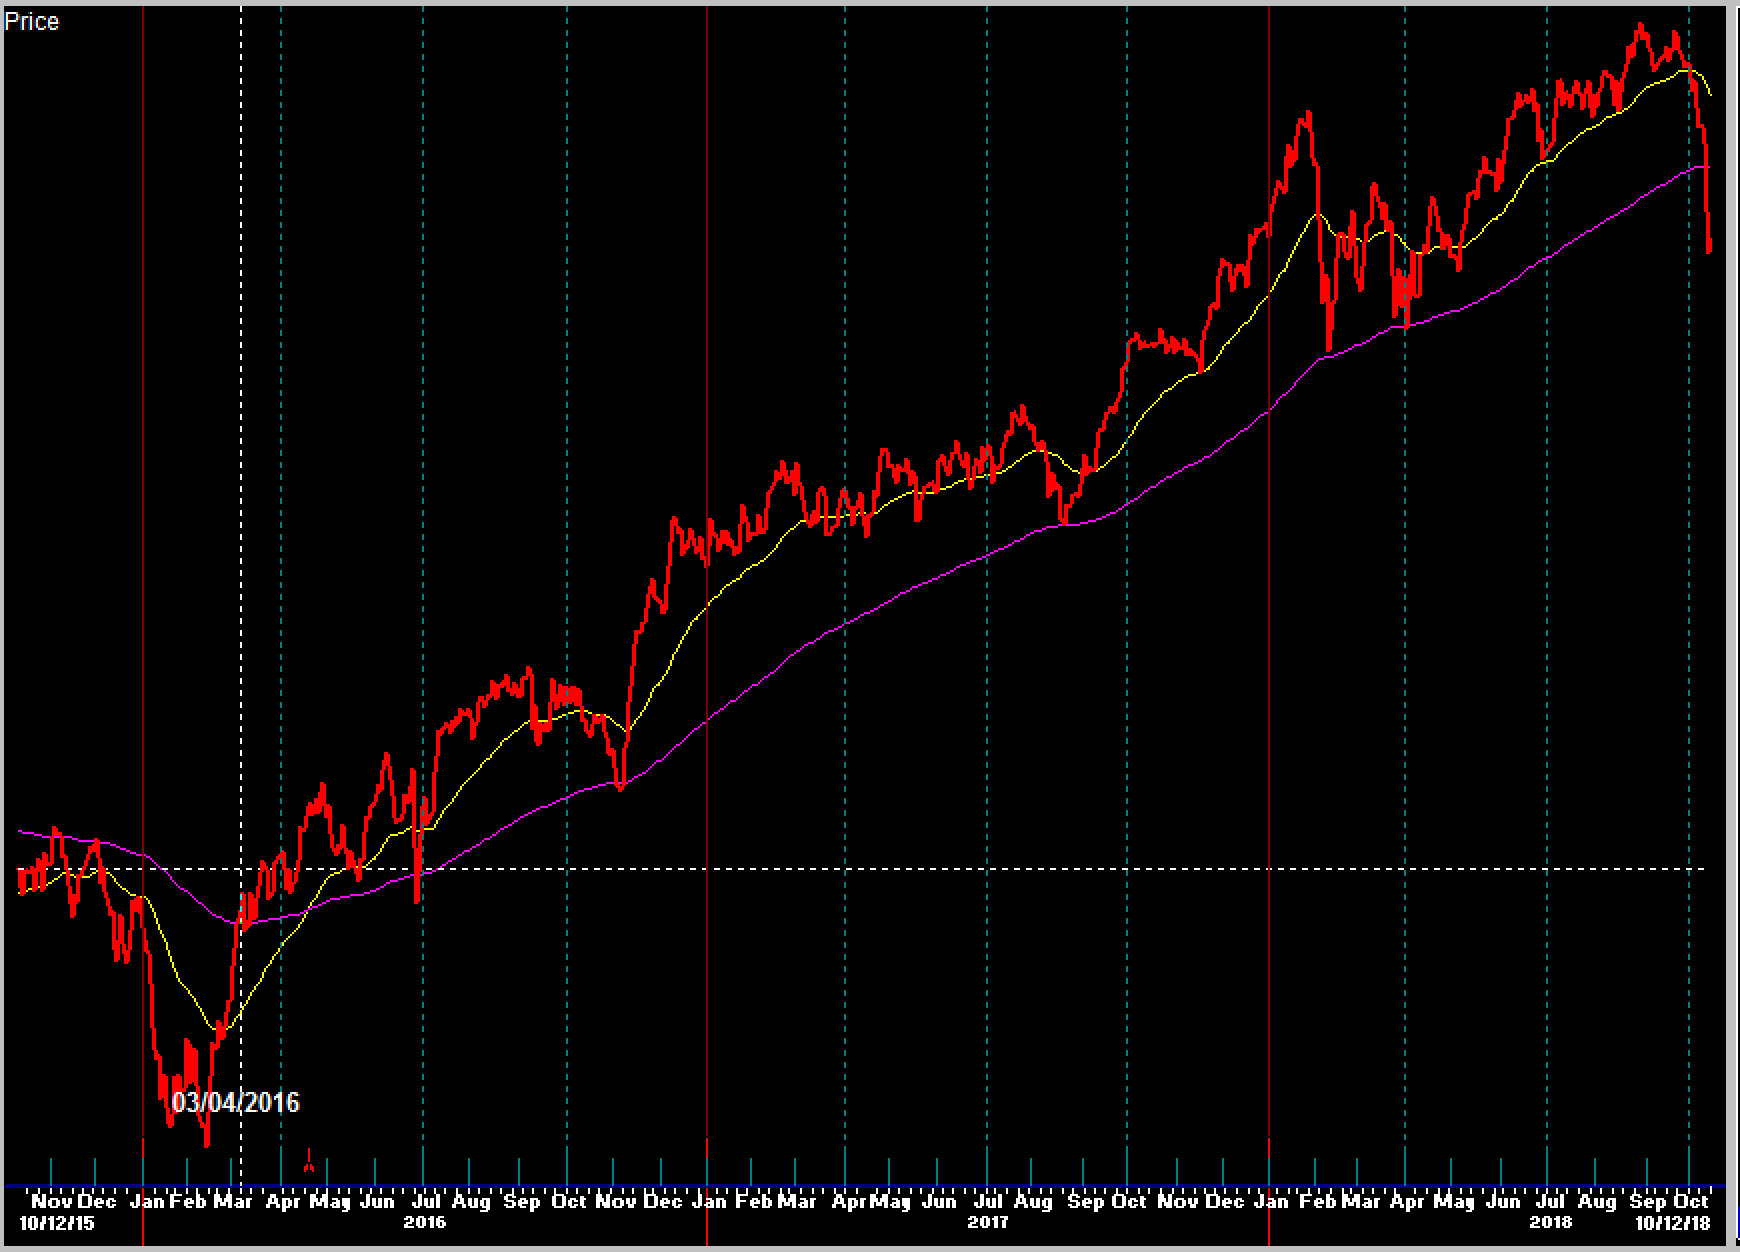
“Trend”, meaning the high level price trend of the market, is probably the most important variable for any investor to watch. But trend can be tricky. Which index defines trend? What time period should we assign as a reasonable average of price over time? The 50 day moving average? The 200 day? 39 week? Hmmm. Our choice is one that you might not have heard of. We like the Value Line Arithmetic Index shown below. To us, it represents the true nature of price trends in the US stock market. Unlike the S&P 500 or the Dow Jones Indices, which are oddly constructed with cap and price weightings, Value Line does none of that. It is more equally weighted and covers more of the “middle” of the stock market with representation to small, mid and large cap companies, as well as growth and value participants. Comparatively, you should know that more than 50{1de7caaf0b891e8de3ff5bef940389bb3ad66cfa642e6e11bdb96925e6e15654} of the S&P 500 return is now a function of what happens to Apple on any given day. Is Apple the US stock market? If you have great gobs of your net worth in something called the S&P 500 index, then your answer is yes. Good luck with that looking forward.
Anyway, a simple glance at the chart of the Value Line Index below tells a pretty clear story. The three year uptrend that began in late 2015 is now broken to the downside.The red price line has dropped below the long term price average shown in purple. Does this decline look the same as any of those in the last several years?Nope. So, we have enough technical price damage that investors should/could now consider selling strength rather than buying weakness.There is always the chance that we enter a trading range like 2015 rather than the beginning of a devastating bear market. But either way, we should not expect the same environment that we have seen in the last couple years. We need to play strong defense until price patterns become more constructive. Please reread last week’s update regarding changing your expectations. We do expect a bounce of some sort from these levels – maybe from a bit lower as the bulk of our indicators are now short term oversold.Traders may in fact choose to play a range bound market at this point. But, to be clear– the price uptrend is now broken and making money could now become much more difficult.
McClellan Summation Also Broke Down
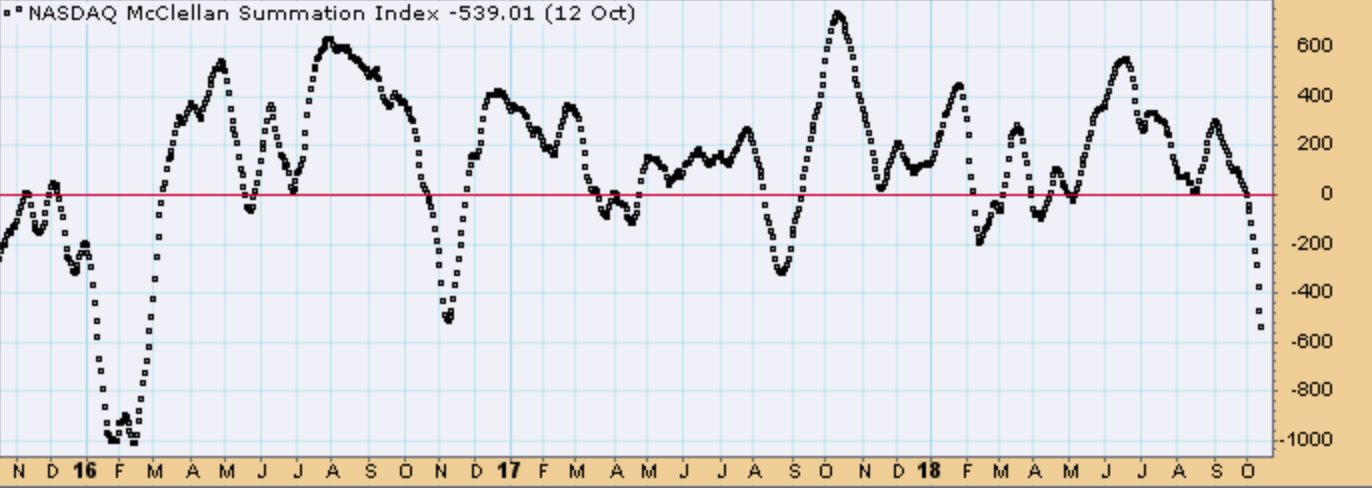
Here’s another chart of a longer term indicator we follow called the McClellan Summation Index. Like the Value Line chart above, you can see this time is different in terms of the recent change in data breaking its own uptrend of rising lows back to 2016. As a “summation” index, it takes a lot of cumulative price action across many issues to push this sucker around. We have found this indicator to be most relevant around the zero line.Obviously, we smashed through the zero line recently but also took out the lows in 2018 and 2017. This time is different.
ASFA Net Exposure Model Pushing Us to Raise Cash
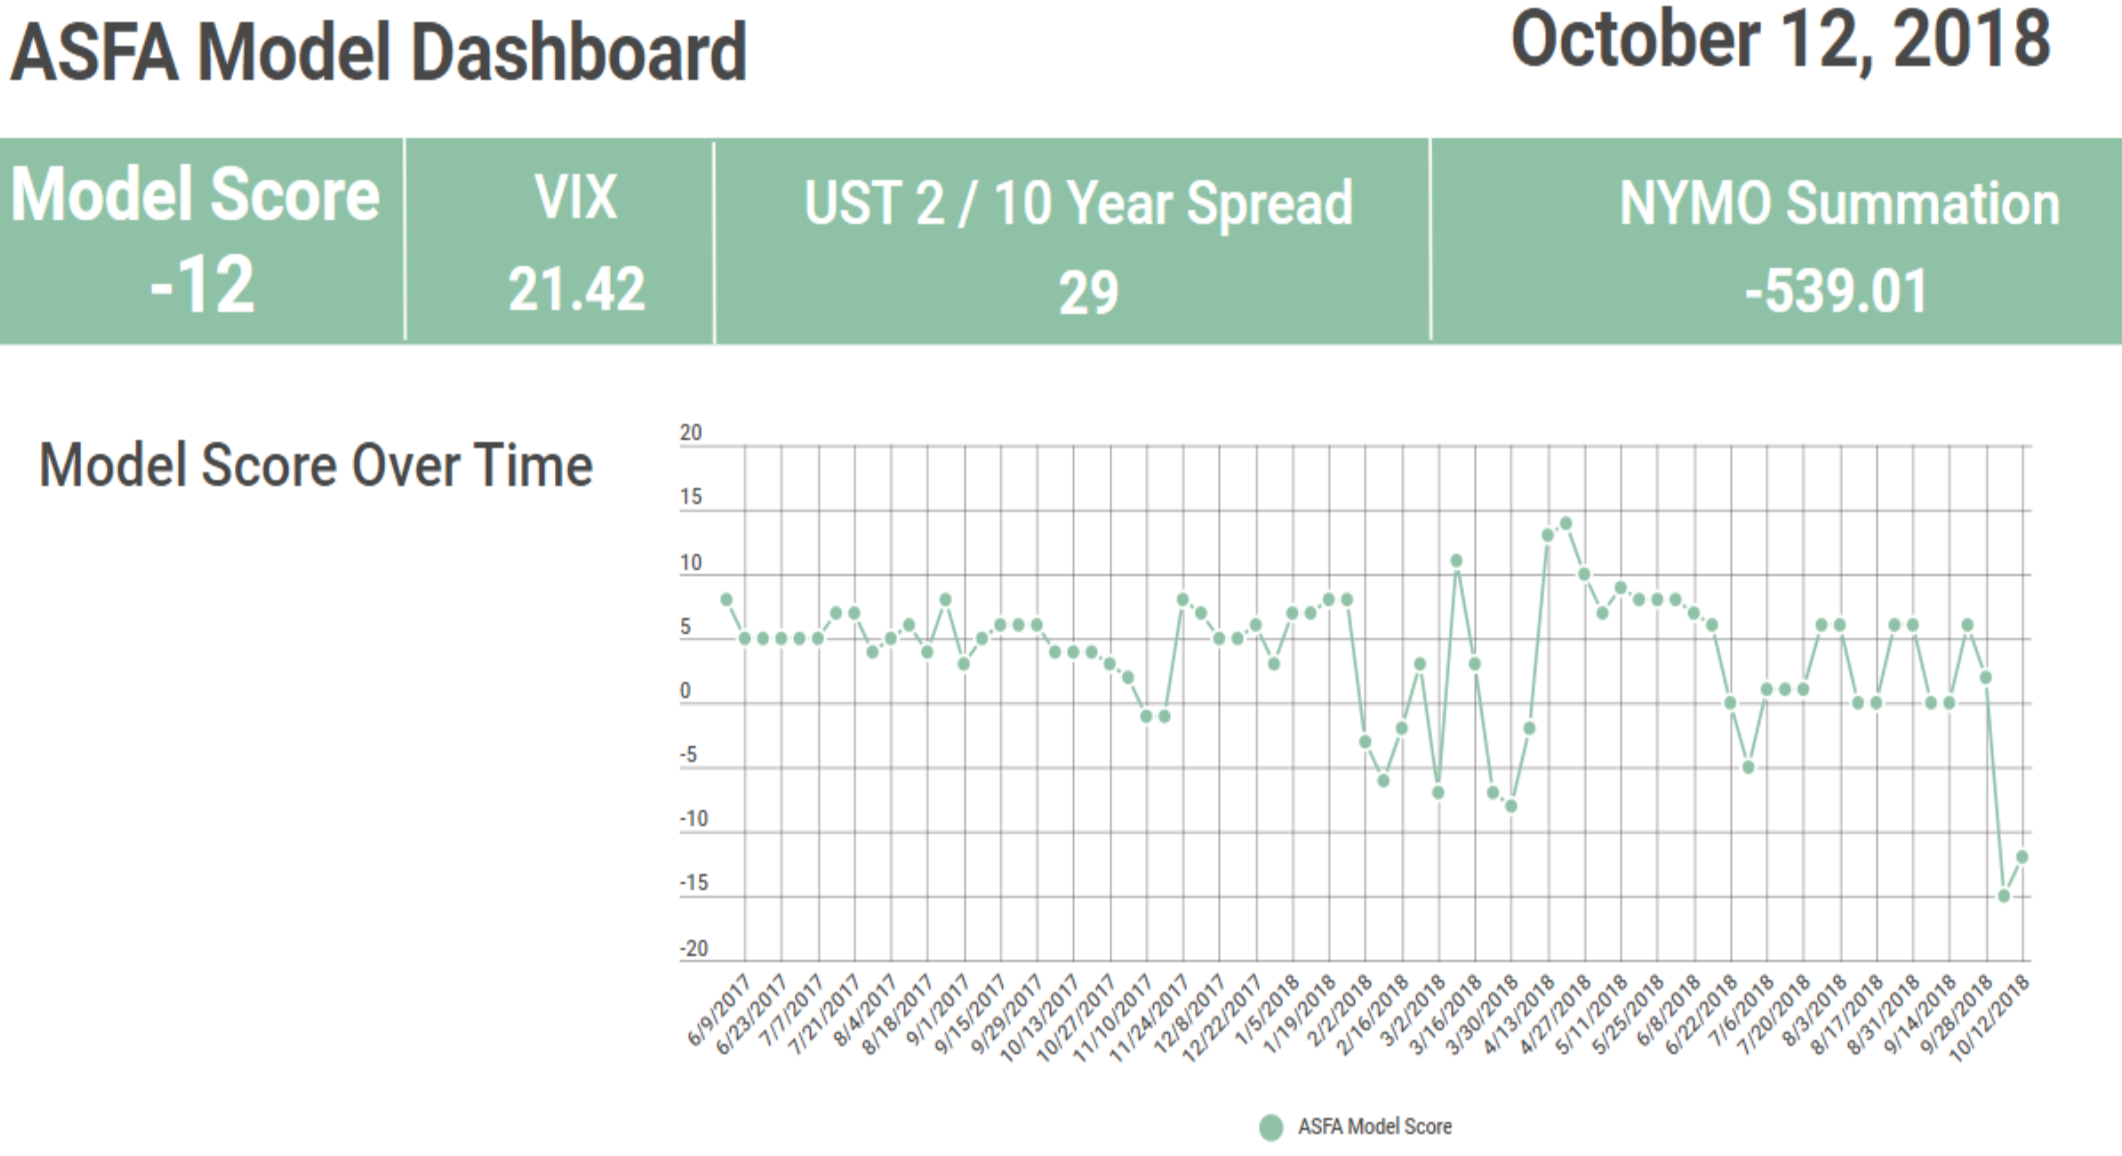
As you can see, the weighted results of all our indicators—the Value Line Index and Summation Index included– is yielding a similar picture. Something is different about this decline, and we need to respect that reality.Statistically, there is more weakness in our exposure model now (currenty -12 reading) than at any time during the January and February declines of this year.
The body of evidence leads us to believe that this correction may not be over. Prices might easily rebound a bit from here, but the entire environment for stock investors is not as friendly as it was earlier in the year. And really, it’s not hard to understand why. We are now nine months (and two rate hikes) further along in terms of the Federal Reserve monetary policy. Trump’s trade and tariff wars are having the expected results of higher prices for all US consumers (we still import everything remember). The big corporate tax cut has already been priced into the affected company stocks, while most individuals are beginning to realize they will see very little change in their tax liability net net. We also have just a few weeks left before mid term elections, where we might see a change in who has their hands on the power levers. I honestly don’t have an opinion as to the market’s reaction to any given result, but it would seem odd for an investor to really step up strongly ahead of this uncertain outcome. Against all of these negatives, we still have very few signs of a pending US recession. Earnings are strong, and we might even see GDP push higher. So, if we believe that stocks reflect the state of the economy and earnings, then we should still give this market the benefit of the doubt for an upside resolution. It may just start from a lower level or in a time frame beyond 2018. If we see signs of recession developing (increase an unemployment, inverted yield curve, drop in consumer sentiment and spending), then all bets are off, and we’ll get to max defense quickly.
That’s it for now, stay tuned, as this situation is fluid.
Regards,
Sam Jones
