We Told You So.. and We’ll Tell You What’s Next
We really try hard to tell our clients and interested readers when conditions are changing, when the markets reach a point when action is necessary and what we should do about it in terms of our investments.We’re not perfect but we do tend to hit the highs and lows closely as well as provide some reasonable forecasting.As our first post in 2019, let’s review what was said when and finish with our current view of how market trends are likely to play out in the foreseeable future.
We Told You So
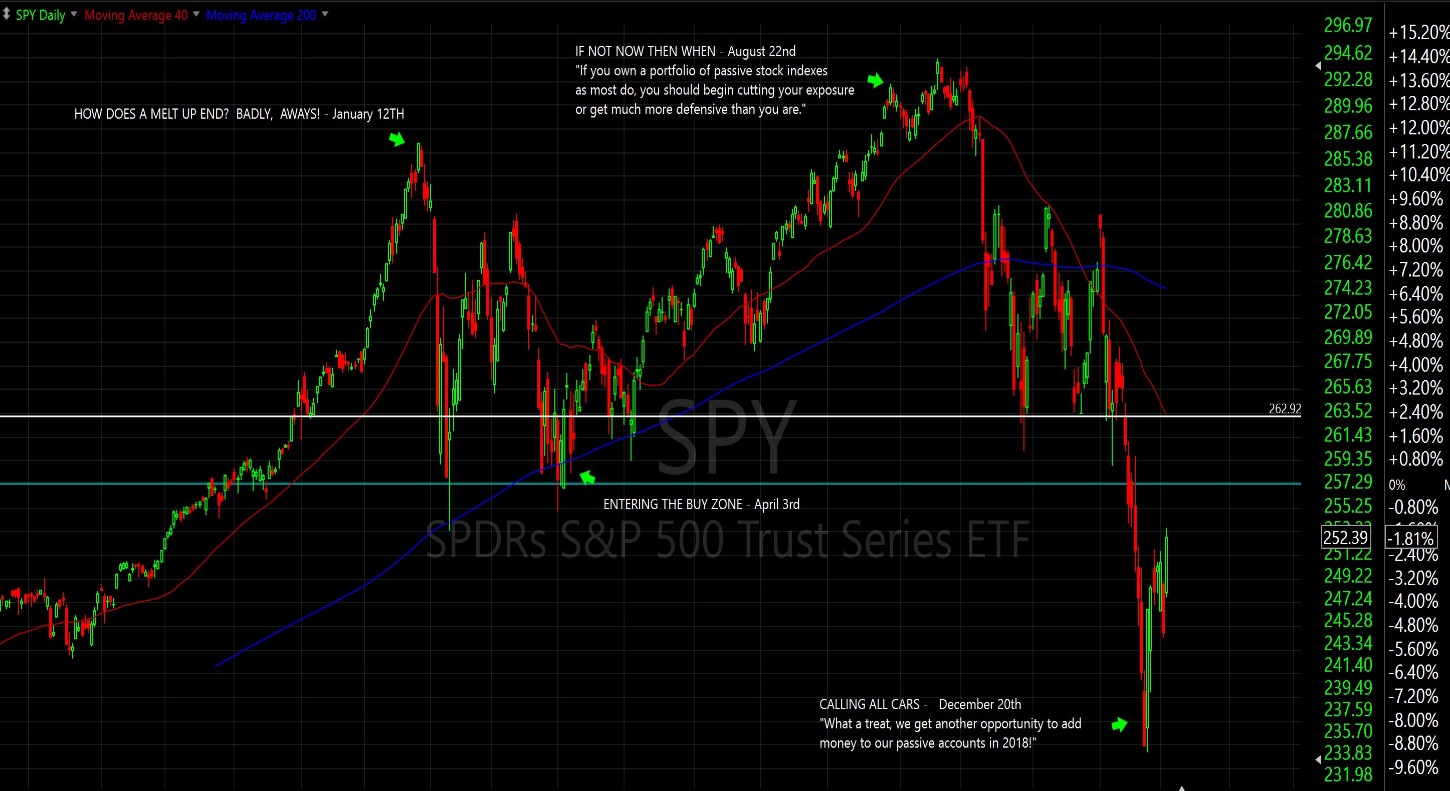
I doctored up this simple chart of the S&P 500 with notable arrows showing the date and title of specific Red Sky Reports – just like this one. In the chart above you can see, going back 12 months, that we saw the January “Melt Up” as the likely end of the long period of gains in 2017. It was.Then in April, we had a nice set up for a “Buy Zone” for a spring and summer rally. That also happened although the rally in September was so concentrated in the FAANG stocks that it was hard to make any money with a diversified portfolio.In August, we sent up the warning flag again saying, “If Not Now, Then When?”. We mapped out different investor profiles in that Red Sky Report and made suggestions for different households covering the degree to which they should raise cash.Finally, after our FIRST 20{1de7caaf0b891e8de3ff5bef940389bb3ad66cfa642e6e11bdb96925e6e15654} decline into the lows on December 26th, we issued the “Calling All Cars” mandate via the Red Sky Report suggesting that passive investors use the extreme oversold market condition to add new money to their accounts as a tax benefit in 2018.So yeah, we told you so and you’re welcome to browse through our archives for all the detail.
Investment Forecast Solution Series – January 30th
This is always a full event at our office and we will be recording it for those who want the information but can’t attend.For now, I’ll give you a few spoilers of what we see coming in the way of market patterns for 2019. Let’s lead this discussion by identifying the risks that we are in a bear market and probabilities that the US economy will be in a recession in the next 12 months.
Jim Stack of Investech Research does a great job of calling bear markets based on several of their proprietary indicators. Primarily they look at “distribution” type information and something they call the Negative Leadership Composite. Based on their work, there is an 88{1de7caaf0b891e8de3ff5bef940389bb3ad66cfa642e6e11bdb96925e6e15654} chance that we are already in a bear market that is far from over. Obviously, we’re in a bear market, right? Can we all agree on that point as it’s hard to find an index that isn’t down at least 20{1de7caaf0b891e8de3ff5bef940389bb3ad66cfa642e6e11bdb96925e6e15654} from the highs. The question is how far will prices ultimately fall? There are some long-term trend lines for the US market that correspond to roughly 2118 on the S&P 500 which would effectively erase all gains since 2015 (The Trump years not surprisingly). If the US economy goes into recession, the average losses from price highs are -43{1de7caaf0b891e8de3ff5bef940389bb3ad66cfa642e6e11bdb96925e6e15654}.Averages mean nothing however as we’ve already seen two bear markets with losses in excess of -50{1de7caaf0b891e8de3ff5bef940389bb3ad66cfa642e6e11bdb96925e6e15654} since 2000. So, the downside risks of this bear market continuing are still ultimately very serious as we might (only) be approaching the half way mark now. If we somehow avoid recession, average market losses are a little over -23{1de7caaf0b891e8de3ff5bef940389bb3ad66cfa642e6e11bdb96925e6e15654}. Statistically, that still counts as a bear market but one that we would call a “garden variety”. Again, averages and semantics mean little to us. There is plenty of risk in the system.
What are the probabilities of a US recession? Well, we’ve seen a ton of models beyond our own and most still indicate a recession is still likely near the end of 2019. The vast majority of indictors are clearly angling in that direction and we have highlighted these over the last several months. However, there is still nothing in the system that effectively locks us into a recessionary outcome. For instance, the yield curve is virtually flat now, but statistically it needs to invert for us to know that a recession is coming. While the ISM manufacturing report last week was one of the worst in modern history, the index itself needs to fall below 50 to lock in a recession.In addition, leading economic indicators, consumer confidence and employment numbers are still hanging tough. As investors, we must make decisions now based on probabilities of certain outcomes and that’s why stocks are selling off hard now – it sees a strong probability of recession in late 2019!
Finally, for those who are students of short and long-term debt cycles, you are probably keenly aware that we are now at the end of both! The end of long term debt cycles only happens every 50-60 years. The last debt cycle ended in the 30’s leading to some unsavory times for markets and the economy. These are times when massive debt is pushed around until Central banks run out of options and they are forced to do unorthodoxed things like buy their own bonds, increase balance sheets or embark on quantitative easing with outright asset purchases, etc. Ultimately, they work themselves into a corner and don’t have the fire power to combat recession with lower interest rates because they are already too low.Sound familiar? Every investor out there must consider the unwinding of this long debt cycle that is now in place as context for current decisions.
There have been 12 cycles of the Federal Reserve raising rates in a period of tight monetary policy. The current cycle began in 2015 and they just raised rates for the 9th time.Of the other 11 cycles, 9 have ended in recession, while only two yielded soft landing (non-recessionary) outcomes. So those are bad odds as well. Just sayin.
Another Rally That Fails?
On December 21st, we hit several technical oversold extremes in our own market that are of the type that develop intermediate term lows in prices. We said so and put on a few trading positions (IVE, IJR, IEMG) to give our strategies a little buoyancy. Thus far, these have worked out and the market is rallying nicely from those extreme lows. Now take a second to glance back up at the chart above. I have marked two horizontal lines which we will call the supply zone for the US stock market. This is a very serious price resistance level and the place where things really broke down in early December. Pattern wise, the path of least resistance is for the US market to move up into that supply zone before our next intermediate term top forms and the bear market reasserts itself with lower lows. For some indices like small caps, energy, commodities and others, we could see this rally continue up 7-9{1de7caaf0b891e8de3ff5bef940389bb3ad66cfa642e6e11bdb96925e6e15654}. Even after Friday’s giant bear market rally (choosing my words purposely), the S&P could move up another 3-5{1de7caaf0b891e8de3ff5bef940389bb3ad66cfa642e6e11bdb96925e6e15654} before running into the supply zone. Now, I’m going to call out this next statement by separating it from this text and making it big and bold.
THUS FAR, THERE IS NOTHING TO INDICATE THAT THIS BEAR MARKET IS OVER AND THAT A DURABLE LOW IS IN PLACE. THIS LOOKS LIKE AN EXPLOSIVE BEAR MARKET RALLY FROM AN EXTREMELY OVERSOLD MARKET CONDITION.
Clear?
Anything we put on now is a trade. Anything we buy now, will likely be sold before the snow is gone. And we’ll probably get a reasonably good opportunity to put on additional short positions near the supply zone if conditions are ripe.
Other Asset Class Opportunities
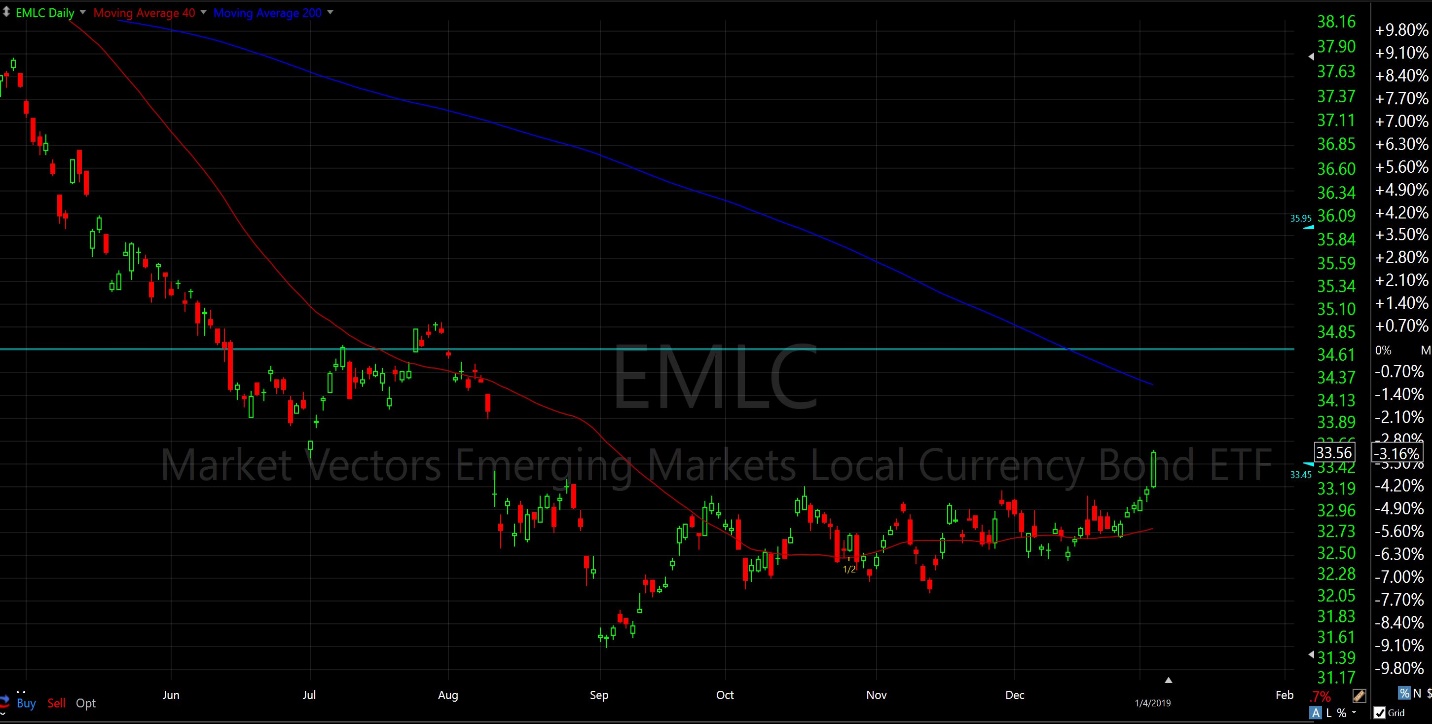
We have carried outsized positions in gold, gold miners, and short/ intermediate term Treasury bonds of all types since October and November. But now, both are overbought and need a rest. At the same time, we’re seeing more strength in Emerging market bonds, especially those trading in local currencies (Chart of the Emerging Market Bond Local Currency ETF below). Today we sold the last of our shortest-term bond funds (SHY) for a nice profit and used the proceeds to double up on our EM bond funds. We’re going to keep our intermediate term Treasury bonds until we see the eyes of the recession upon us.
While gold and precious metals still look great long term, they need a rest as well. At the same time, commodities are now attractive again as oil is showing signs of a longer-term bottom. Without selling our gold positions, we are adding to our commodity positions again.
Strangely enough, in October we made note of the fact that every asset class was falling dramatically in sync; something that rarely happens or lasts long.Well two months later, we now have bonds, stocks and commodities all moving higher together closing the circle on that yin and yang thing.
So that’s the meat of our intermediate term forecast with a little I told you so thrown in for context.
Happy New Year to everyone!
Sam Jones
