VERY Important Moment for Many Markets
I haven’t written in a while because there has been nothing new to write about. The rebound off the lows in mid-February continues. However, all except the Nasdaq 100 remain 2-3{1de7caaf0b891e8de3ff5bef940389bb3ad66cfa642e6e11bdb96925e6e15654} below the peak set on January 26th. Now we have something important to say about an approaching critical moment for many “markets”.
Notes from SIC 2018
I spent about 15 hours last week, tuning into the live streaming presentations from the latest Strategic Investment Conference 2018. Their speaker line up is made up of exceptional talent, independent thinkers and highly experienced market people who are managing serious assets. They did not get where they are because they are posers. No these guys and gals are the real deal offering me an opportunity to open my mind and just listen. After distilling my notes several times, I worked up a short list of common themes among the various presentations. Key presenters for me were, Gundlach, Rosenberg, McWilliams, Yusko, Lacy, and Dillian. Here are my distilled themes and a bunch of important charts from their presentations.
US Equities
No real conviction, but generally bearish looking forward, especially in the 2nd half of 2018. We are clearly in a late stage environment where the risk to reward ratios are flat at best. Interest rates, gold, the US dollar, US stock market, and key sectors are all approaching a critical level. Either current trends will accelerate or reverse course. Investors need to be ready to deploy a relatively UNCONVENTIONAL investment portfolio if this level proves to be a major inflection point. Several were quietly suggesting that 2018 will be a mildly negative year in the end.
Recession Risk
No signs of a recession until 2019 at this point but stocks could easily peak (top of the 9-year bull market) in 2018.
US Treasuries
No conviction but generally bearish as inflation is heating up with strong consensus among indicators. Short-term rates are becoming more relatively attractive as yields are now in their 6th year of moving up. A move above 3.22{1de7caaf0b891e8de3ff5bef940389bb3ad66cfa642e6e11bdb96925e6e15654} on the 30-year Treasury bond or above 3.00{1de7caaf0b891e8de3ff5bef940389bb3ad66cfa642e6e11bdb96925e6e15654} on the 10-year bond would likely correspond with a top in stocks and new long-term trend higher in rates. There is a consensus among the presenters that our current exploding deficits, debt to GDP combined with the late stage of the business cycle, Fed tightening on rates as well as the “wrong direction” White House policies toward protectionism and trade barriers, are a perfect storm for the End Game in the debt supercycle. Translation – be very flexible with your money, assumptions, stay liquid, and be prepared for some very high volatility in the credit and stock markets.
High Yield credit (all around) – disaster – do not touch, 3rd rail stuff. High conviction to stay away. Default rates and spreads may be turning higher right now. Typical reset period for High yield to become attractive again from these levels is about 24 months.
Sectors
Expect relative strength to continue in Materials, Industrials, Technology, Commodities, and most late-stage cycle leaders. Financials, Banks, and Tech are the drivers of the US market. Technology is the most vulnerable looking forward.
Real Estate
Low conviction either way – headwinds of rising rates on REITS and Real Estate but most do not see the type of excesses in supply/ demand that we saw in 2006/2007.
International Investing
VERY high conviction for Japan, Developing Europe, Asia and Emerging Markets. Modestly high conviction for Europe and China (except Yusko who still loves China). The dominance of these markets over the US market began in late 2016, ironically as Trump is trying to Make America Great Again. The US is losing the race to foreign countries across the board. Valuations are almost ½ that of the US for international investments and thus far a falling US dollar is only accelerating relative performance (favoring internationals). Europe is the least attractive of the bunch but still better than the US. Overweight and hold Emerging markets but need to manage currency risks to performance.
Portfolio Construction
The more forward-looking managers are de-risking their portfolios now and have high confidence that US stocks will be in a bear market within 12 months. They have been admittedly early in the past. Several spoke off the cuff to the structural risks in portfolios construction today and the mass adoption of packaged asset allocation products (things like “Target Date funds, Lifestyle funds and many of the offerings you see in 401k plans, pension plans, etc). These packaged funds rely on an inverse stock/ bond relationship that may be coming to a long-term end. Stocks and bonds won’t move in opposite directions looking forward as much as they did in the past. Personal note- we saw this happen in February (bonds and stocks both lost dramatically in sync).
Commodities are now offering a nice diversifier to portfolios for the first time in many years.
Gold is at an inflection point with the US dollar and interest rates.
That’s about it!
A Few Charts That Spoke To Me
Big thanks to Jeffery Gundlach of Double Line and David Rosenberg of Gluskin Sheff for these:
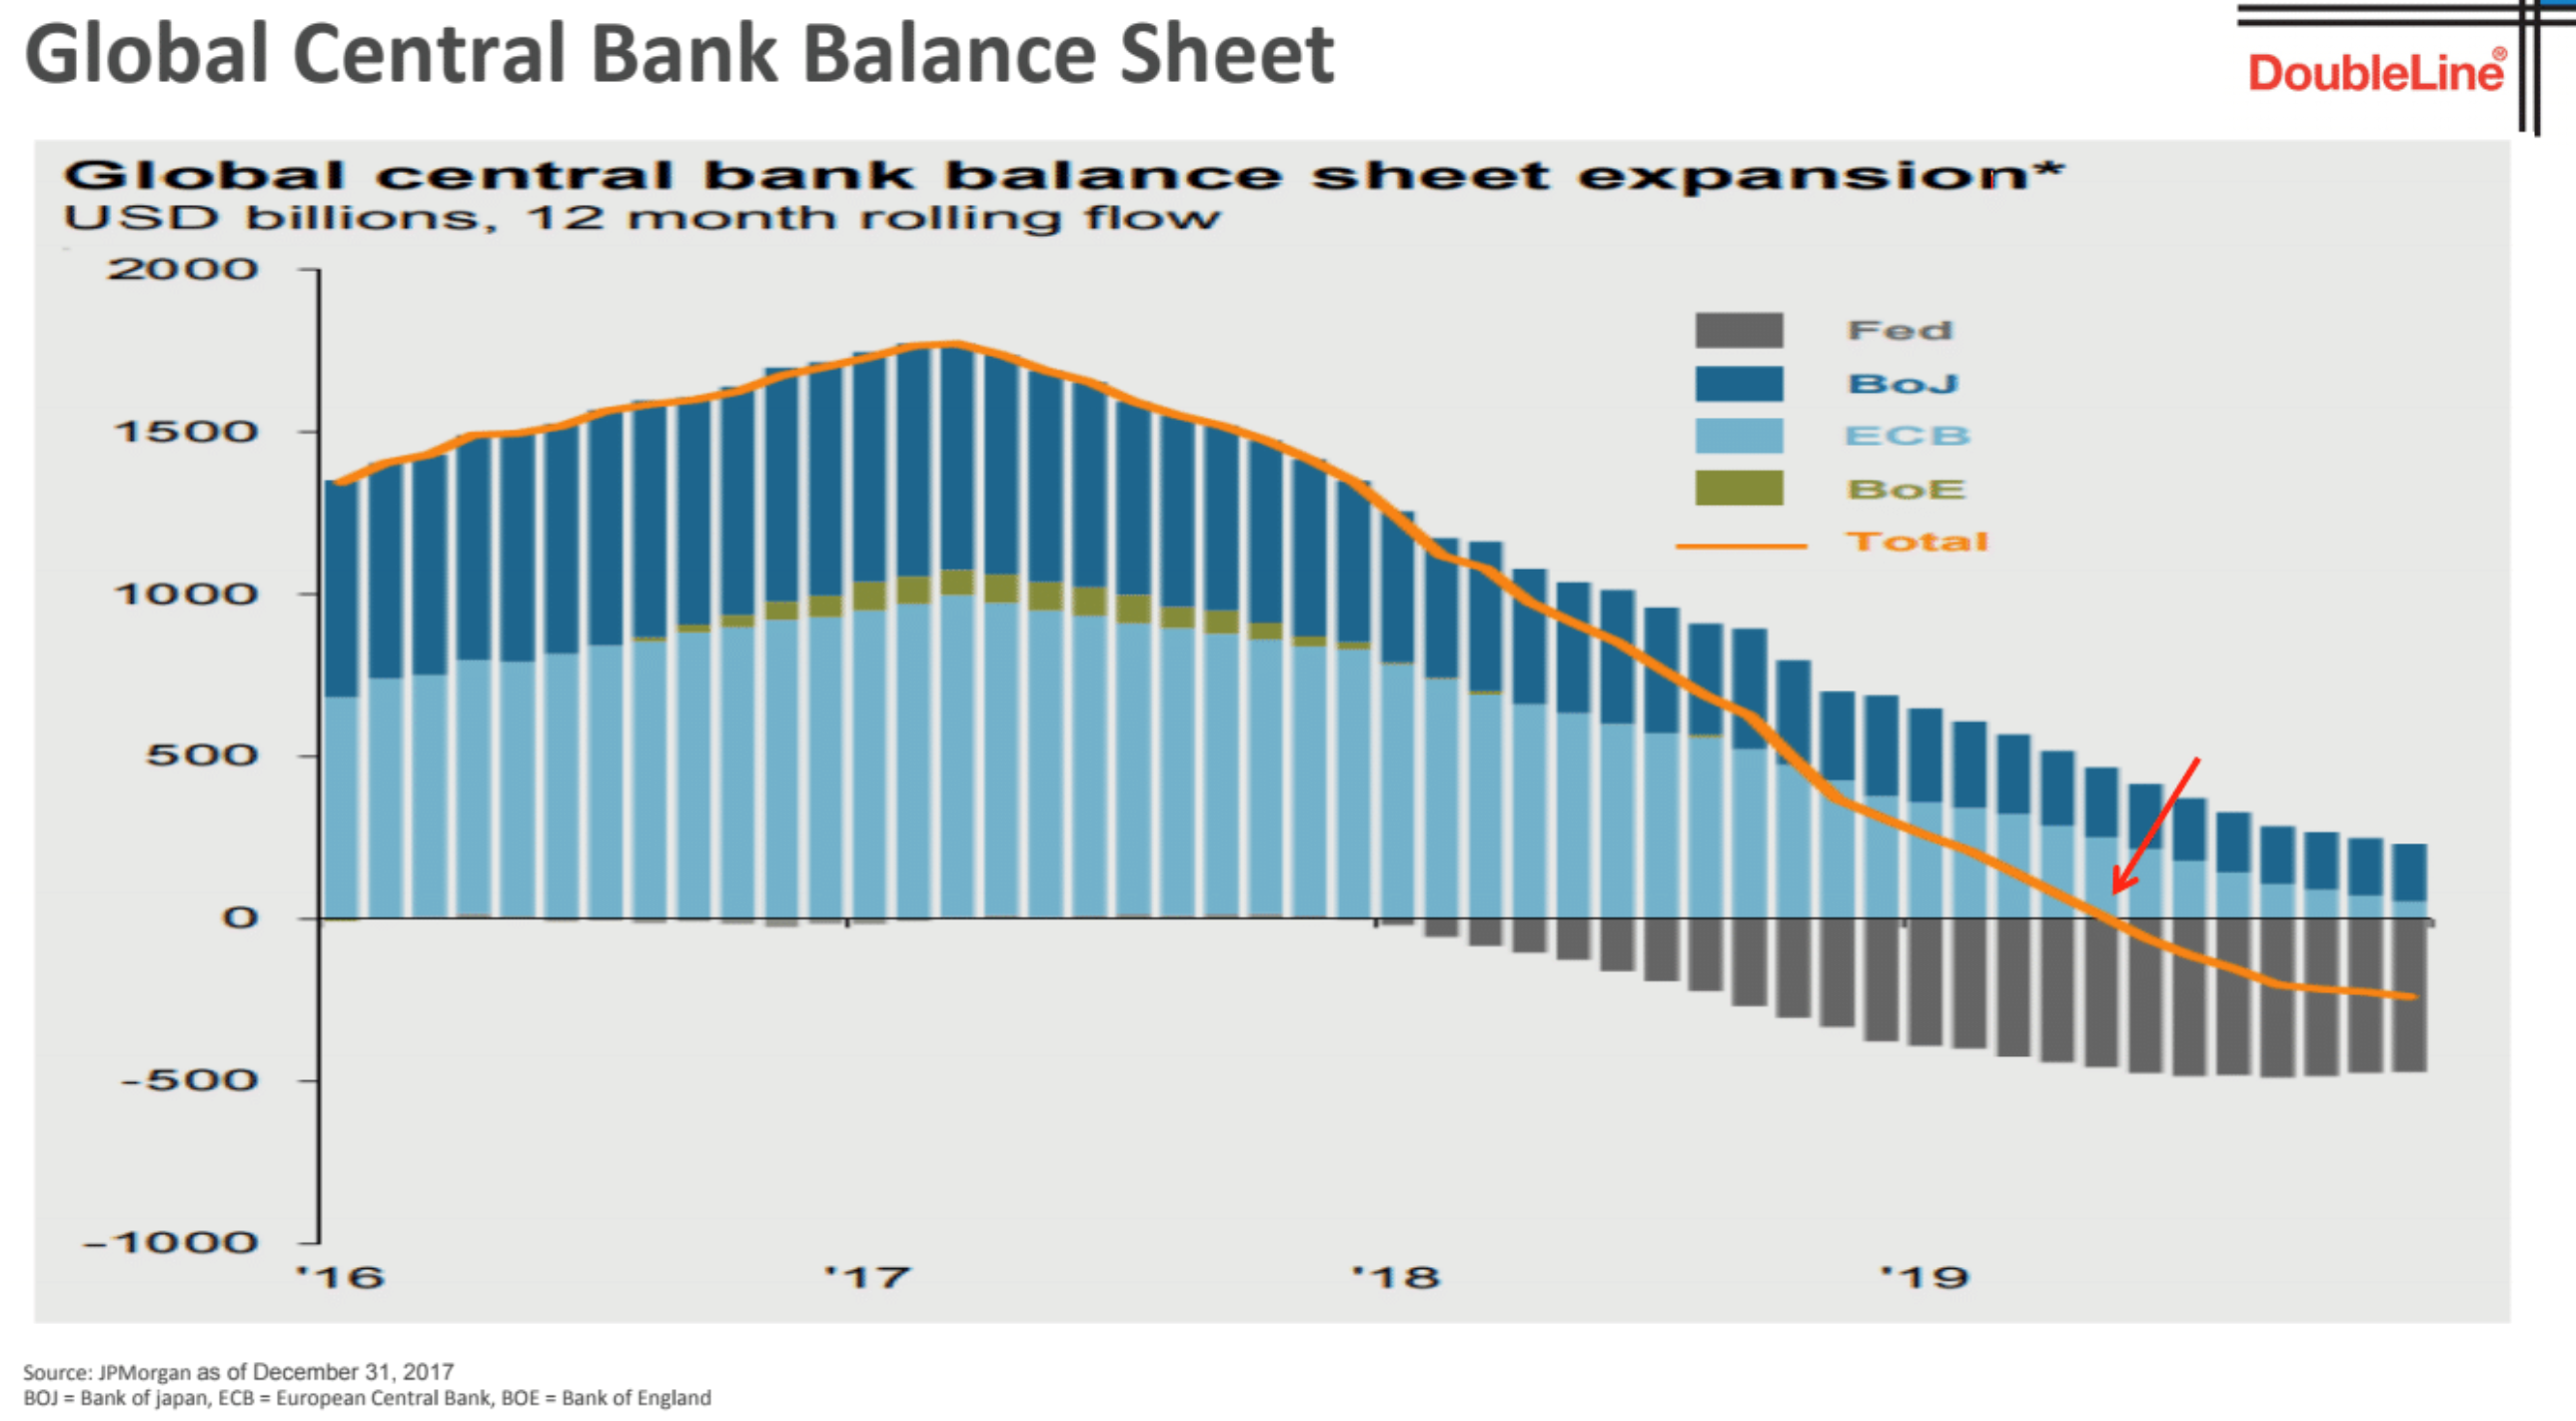
Note, equity market performance is highly correlated to central bank balance sheets. Expansion = more liquidity and stock prices rise (and visa versa). Central banks are taking away liquidity globally now. 2019 looks like very tough sledding for stocks.
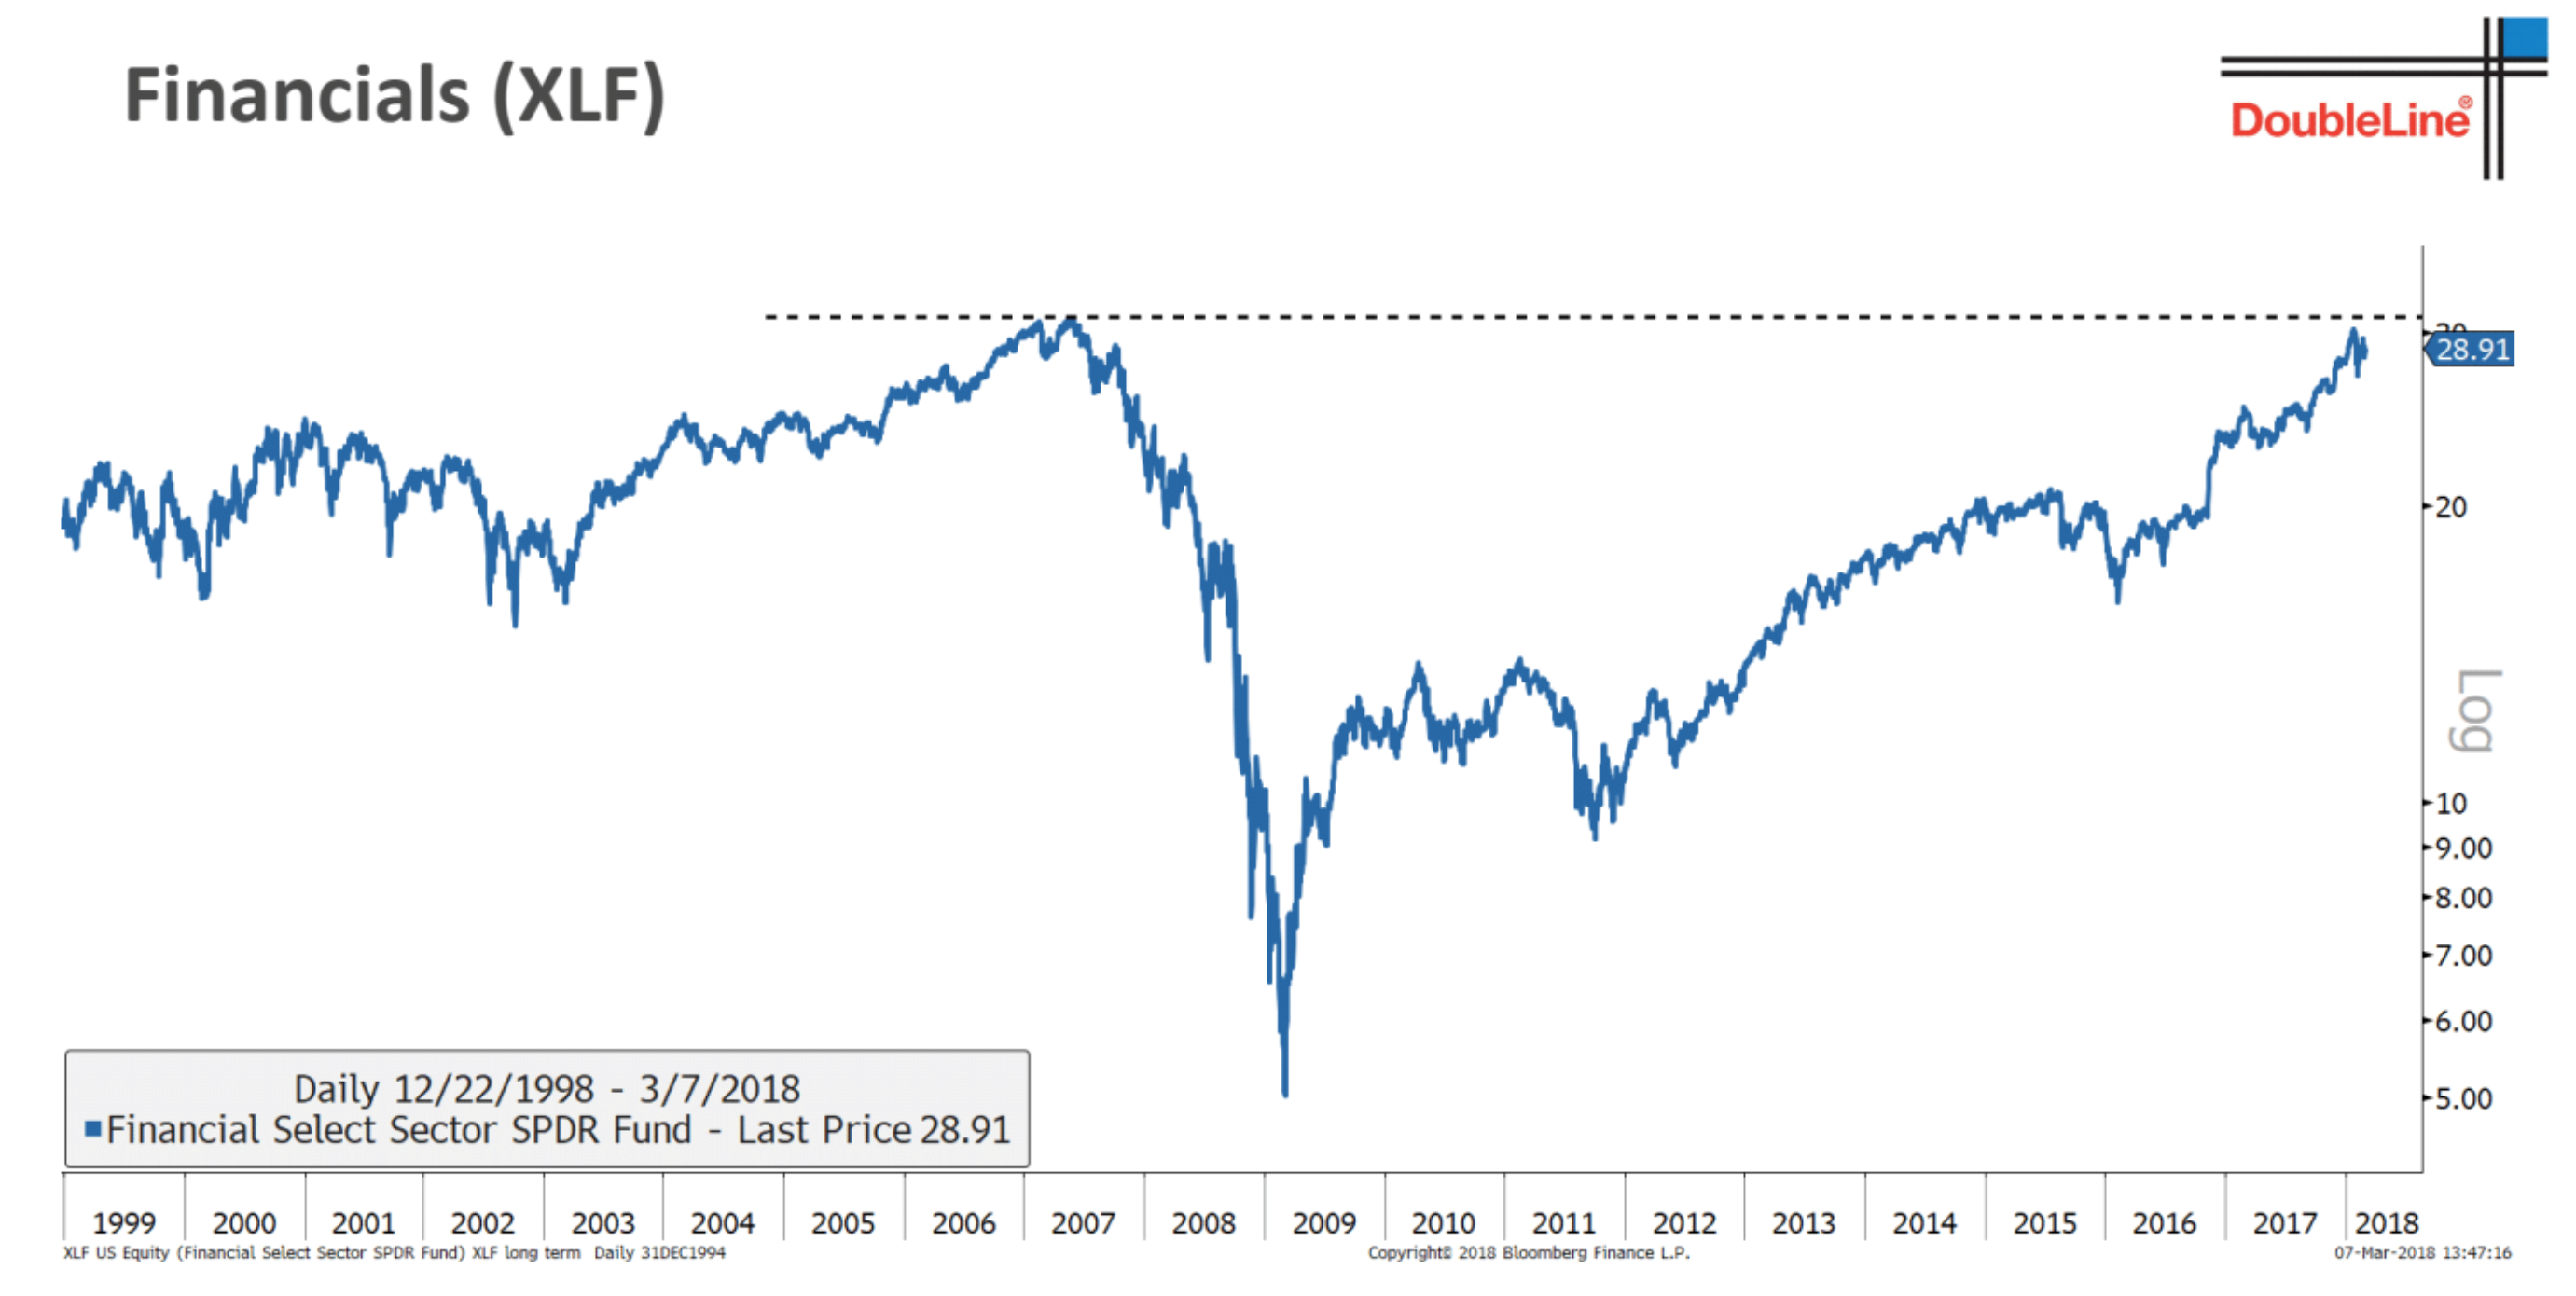
Financials are leading the markets but just now approaching a key level of resistance. Make or break moment for the markets?
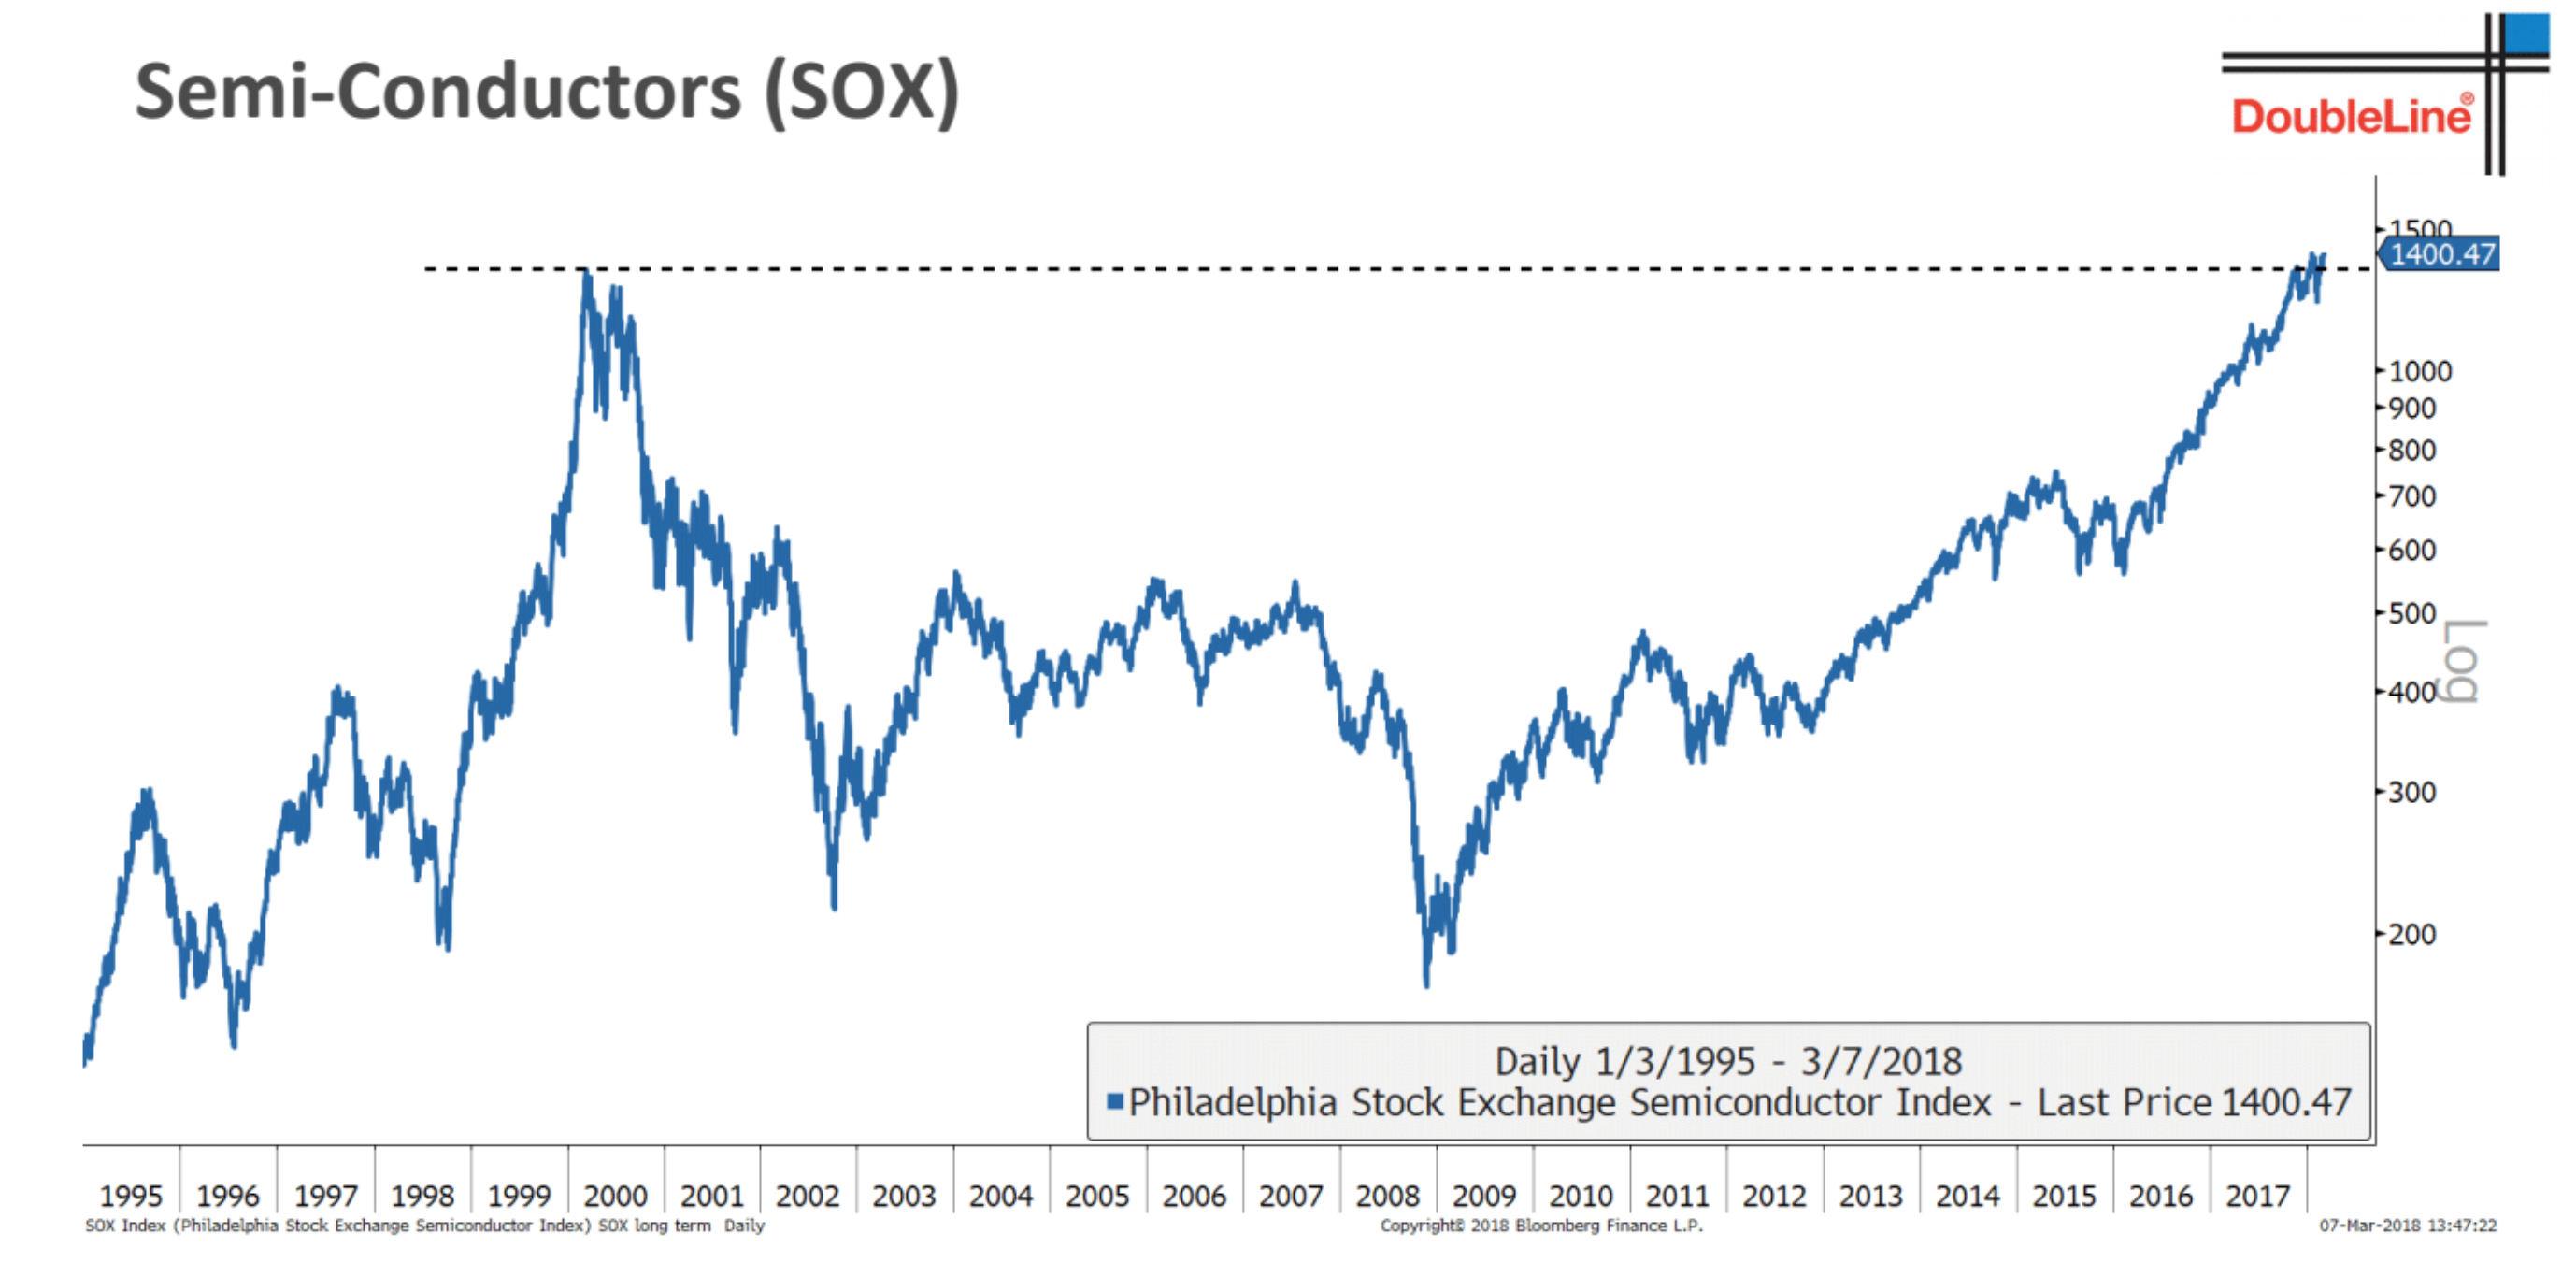 Same for Semiconductors – long-standing “market” indicator. Also approaching a critical resistance level.
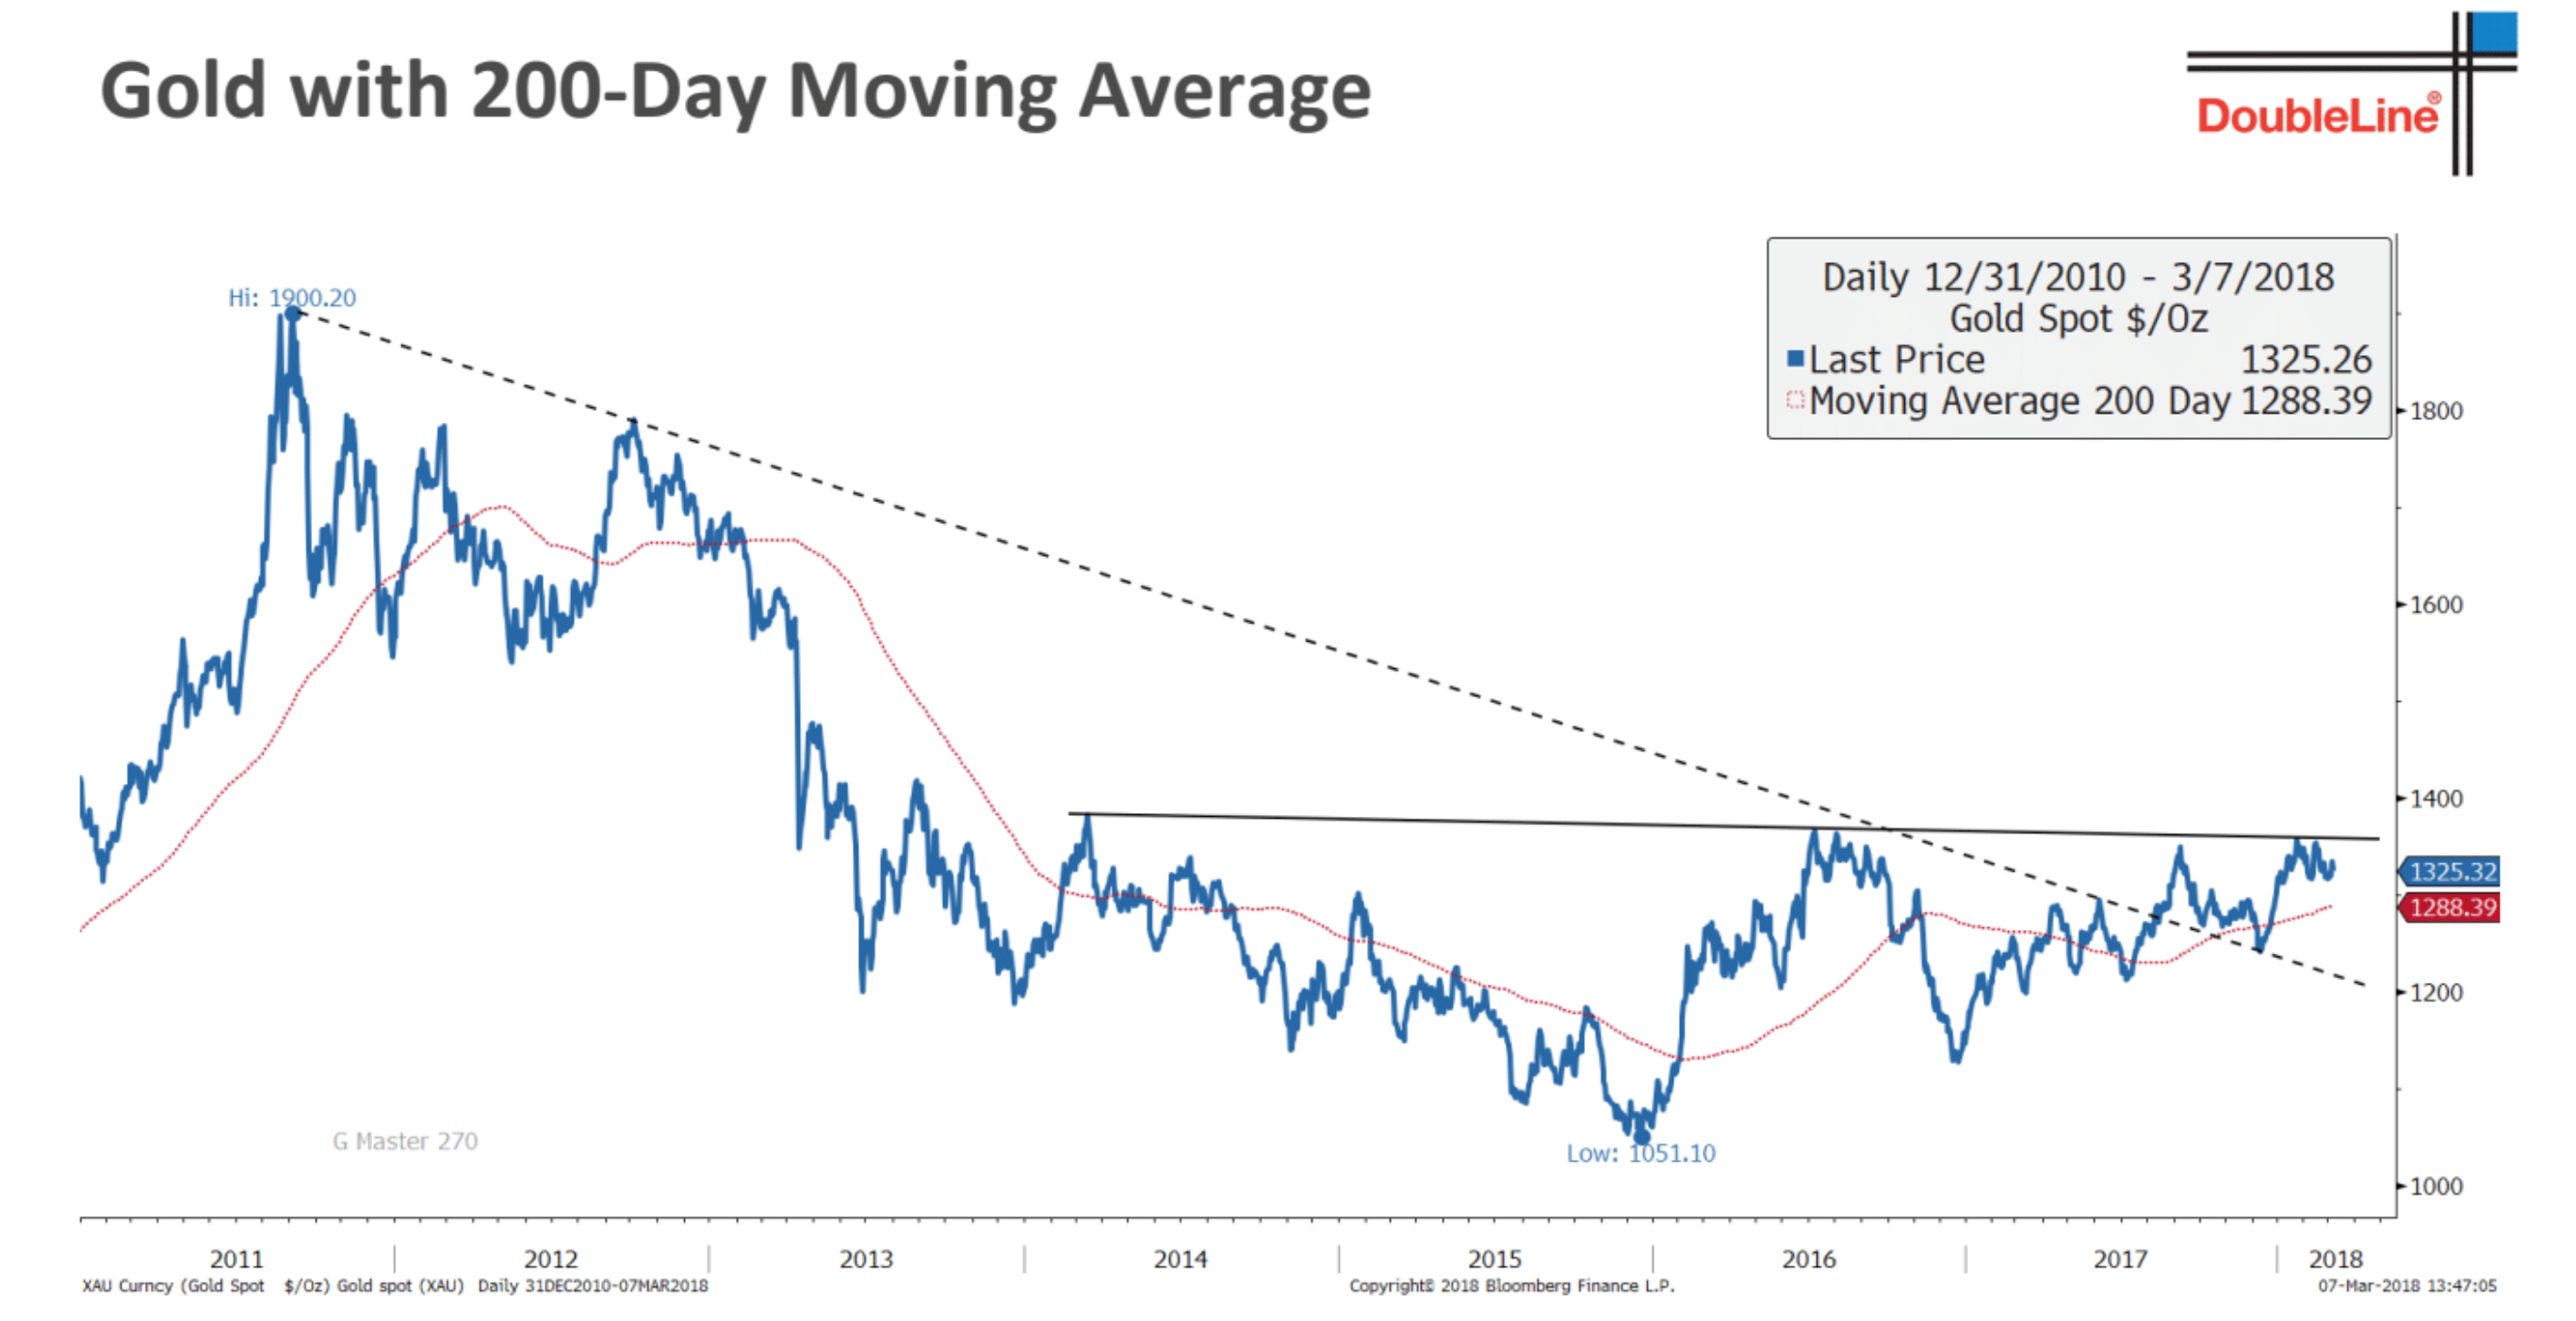
Same for Gold – At an important level. Speaks to currency, fear, and interest rate risks in the system.
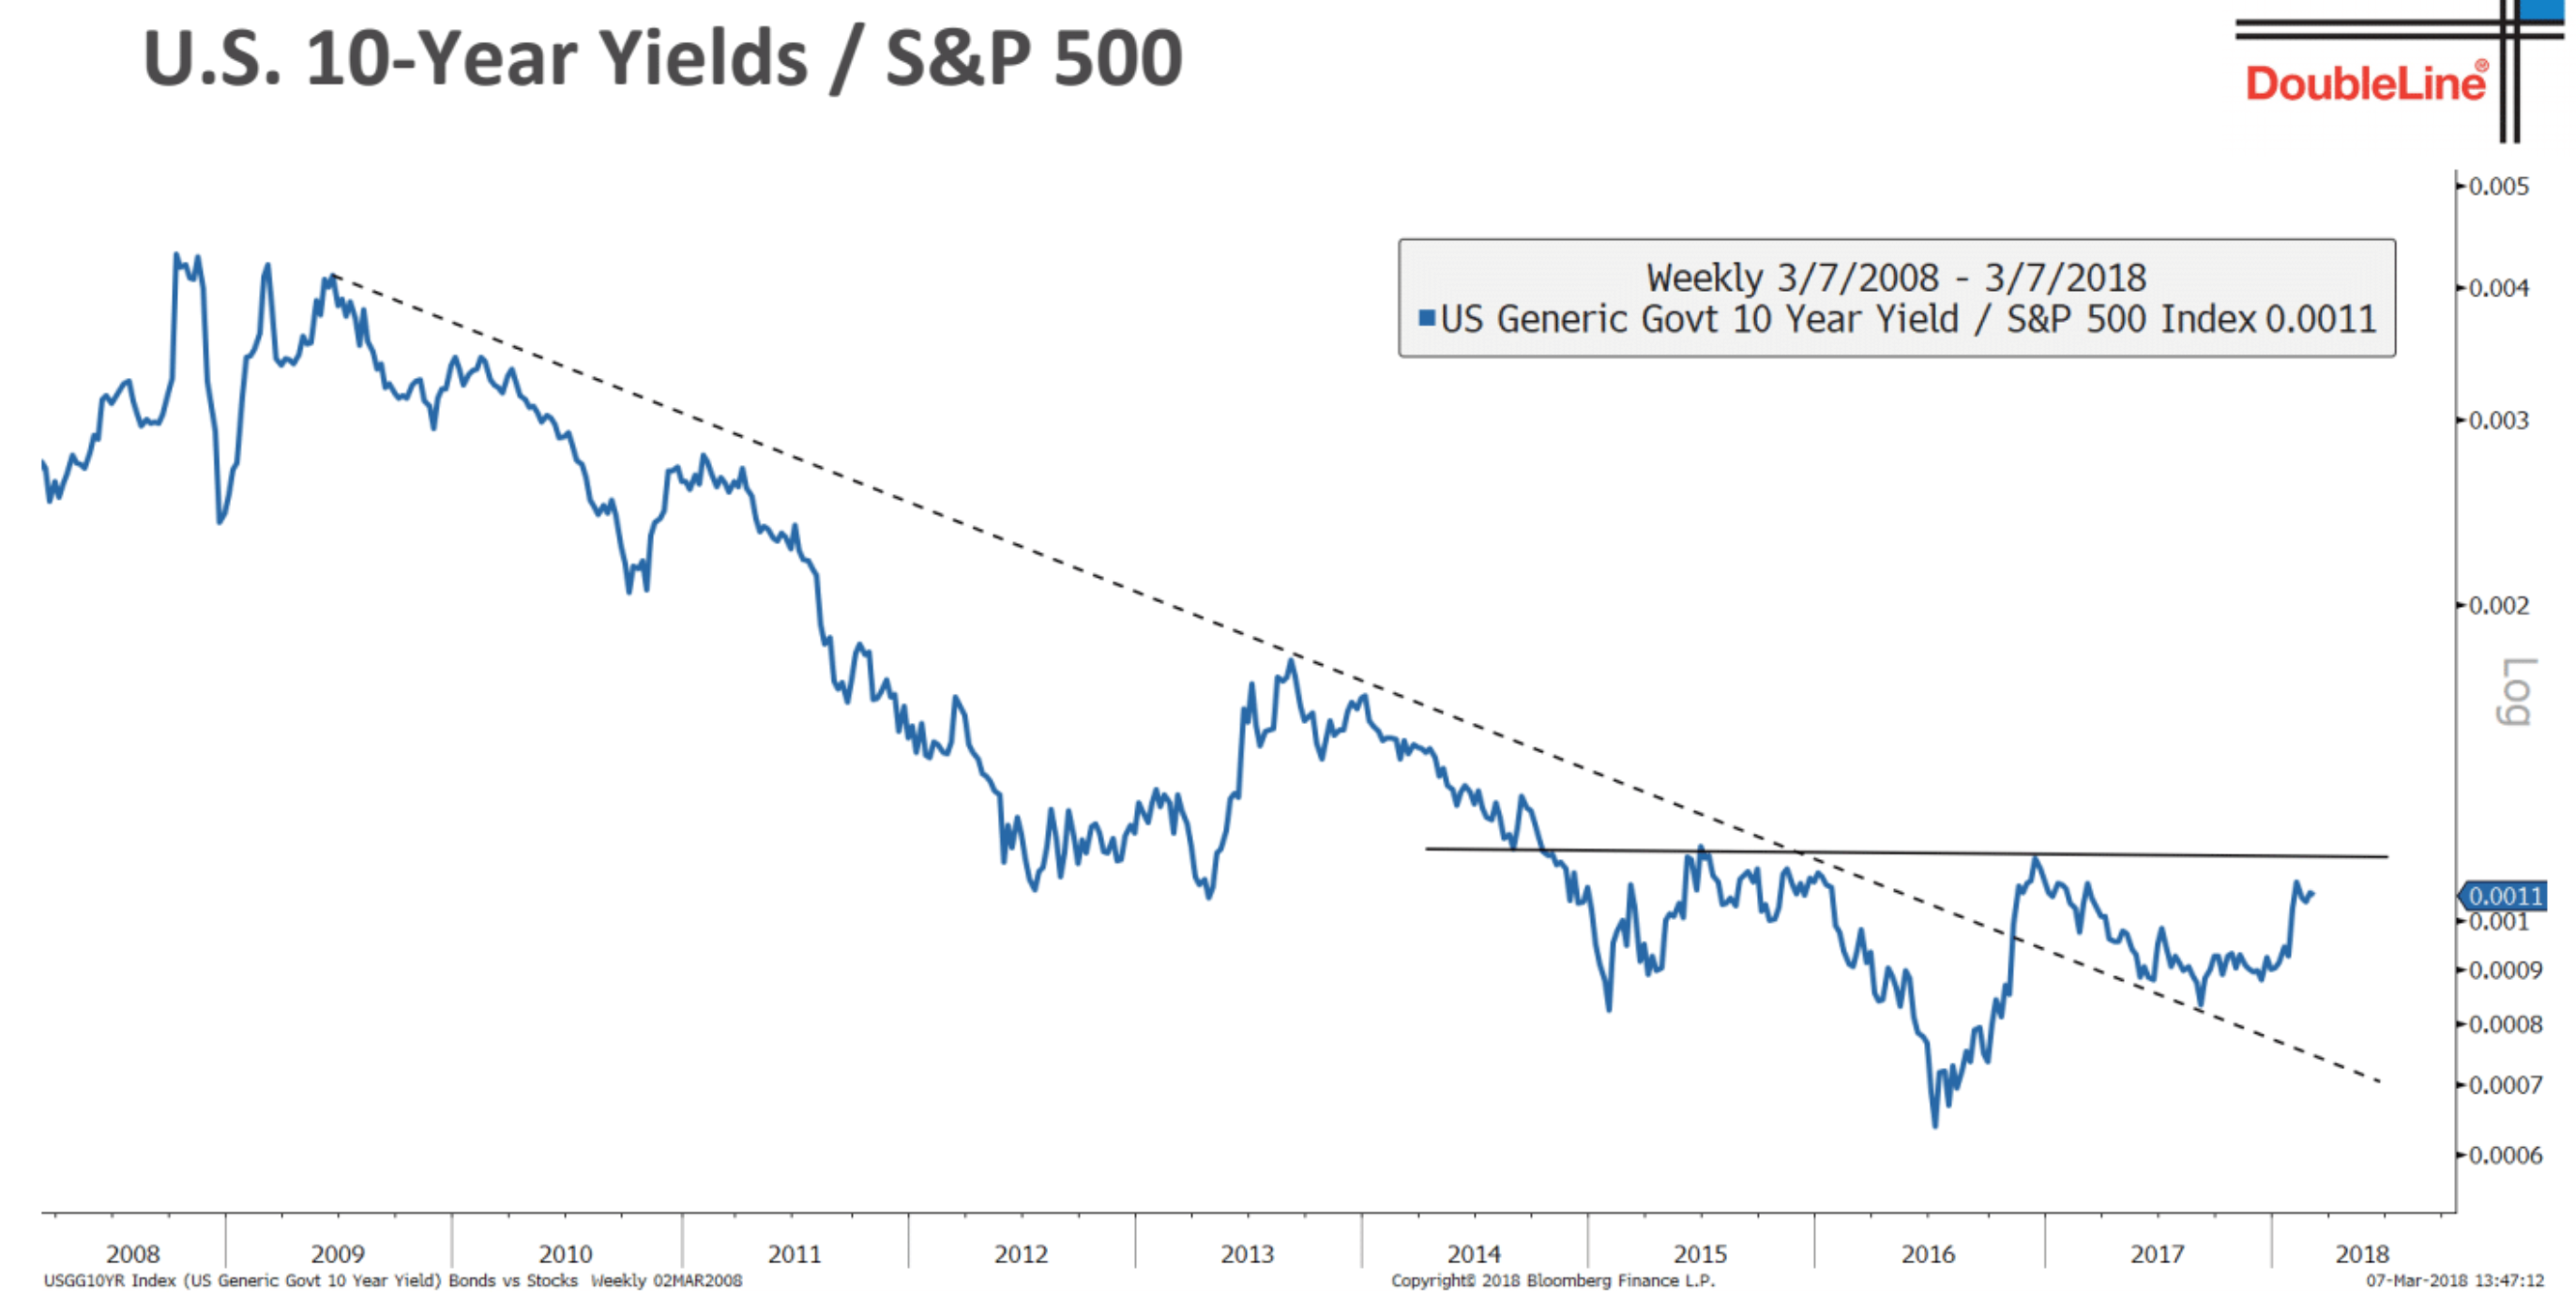
This one is a little more technical but it shows the ratio of the 10 year Treasury bond yield to the S&P 500 index. We don’t want to see this line rising and a break above the horizontal line marked above would indicate trouble for stocks (rates are rising faster than stocks). This indicator topped in early 2009 almost exactly corresponding to the last bottom in stocks. Another thing that is now approaching an important inflection point.
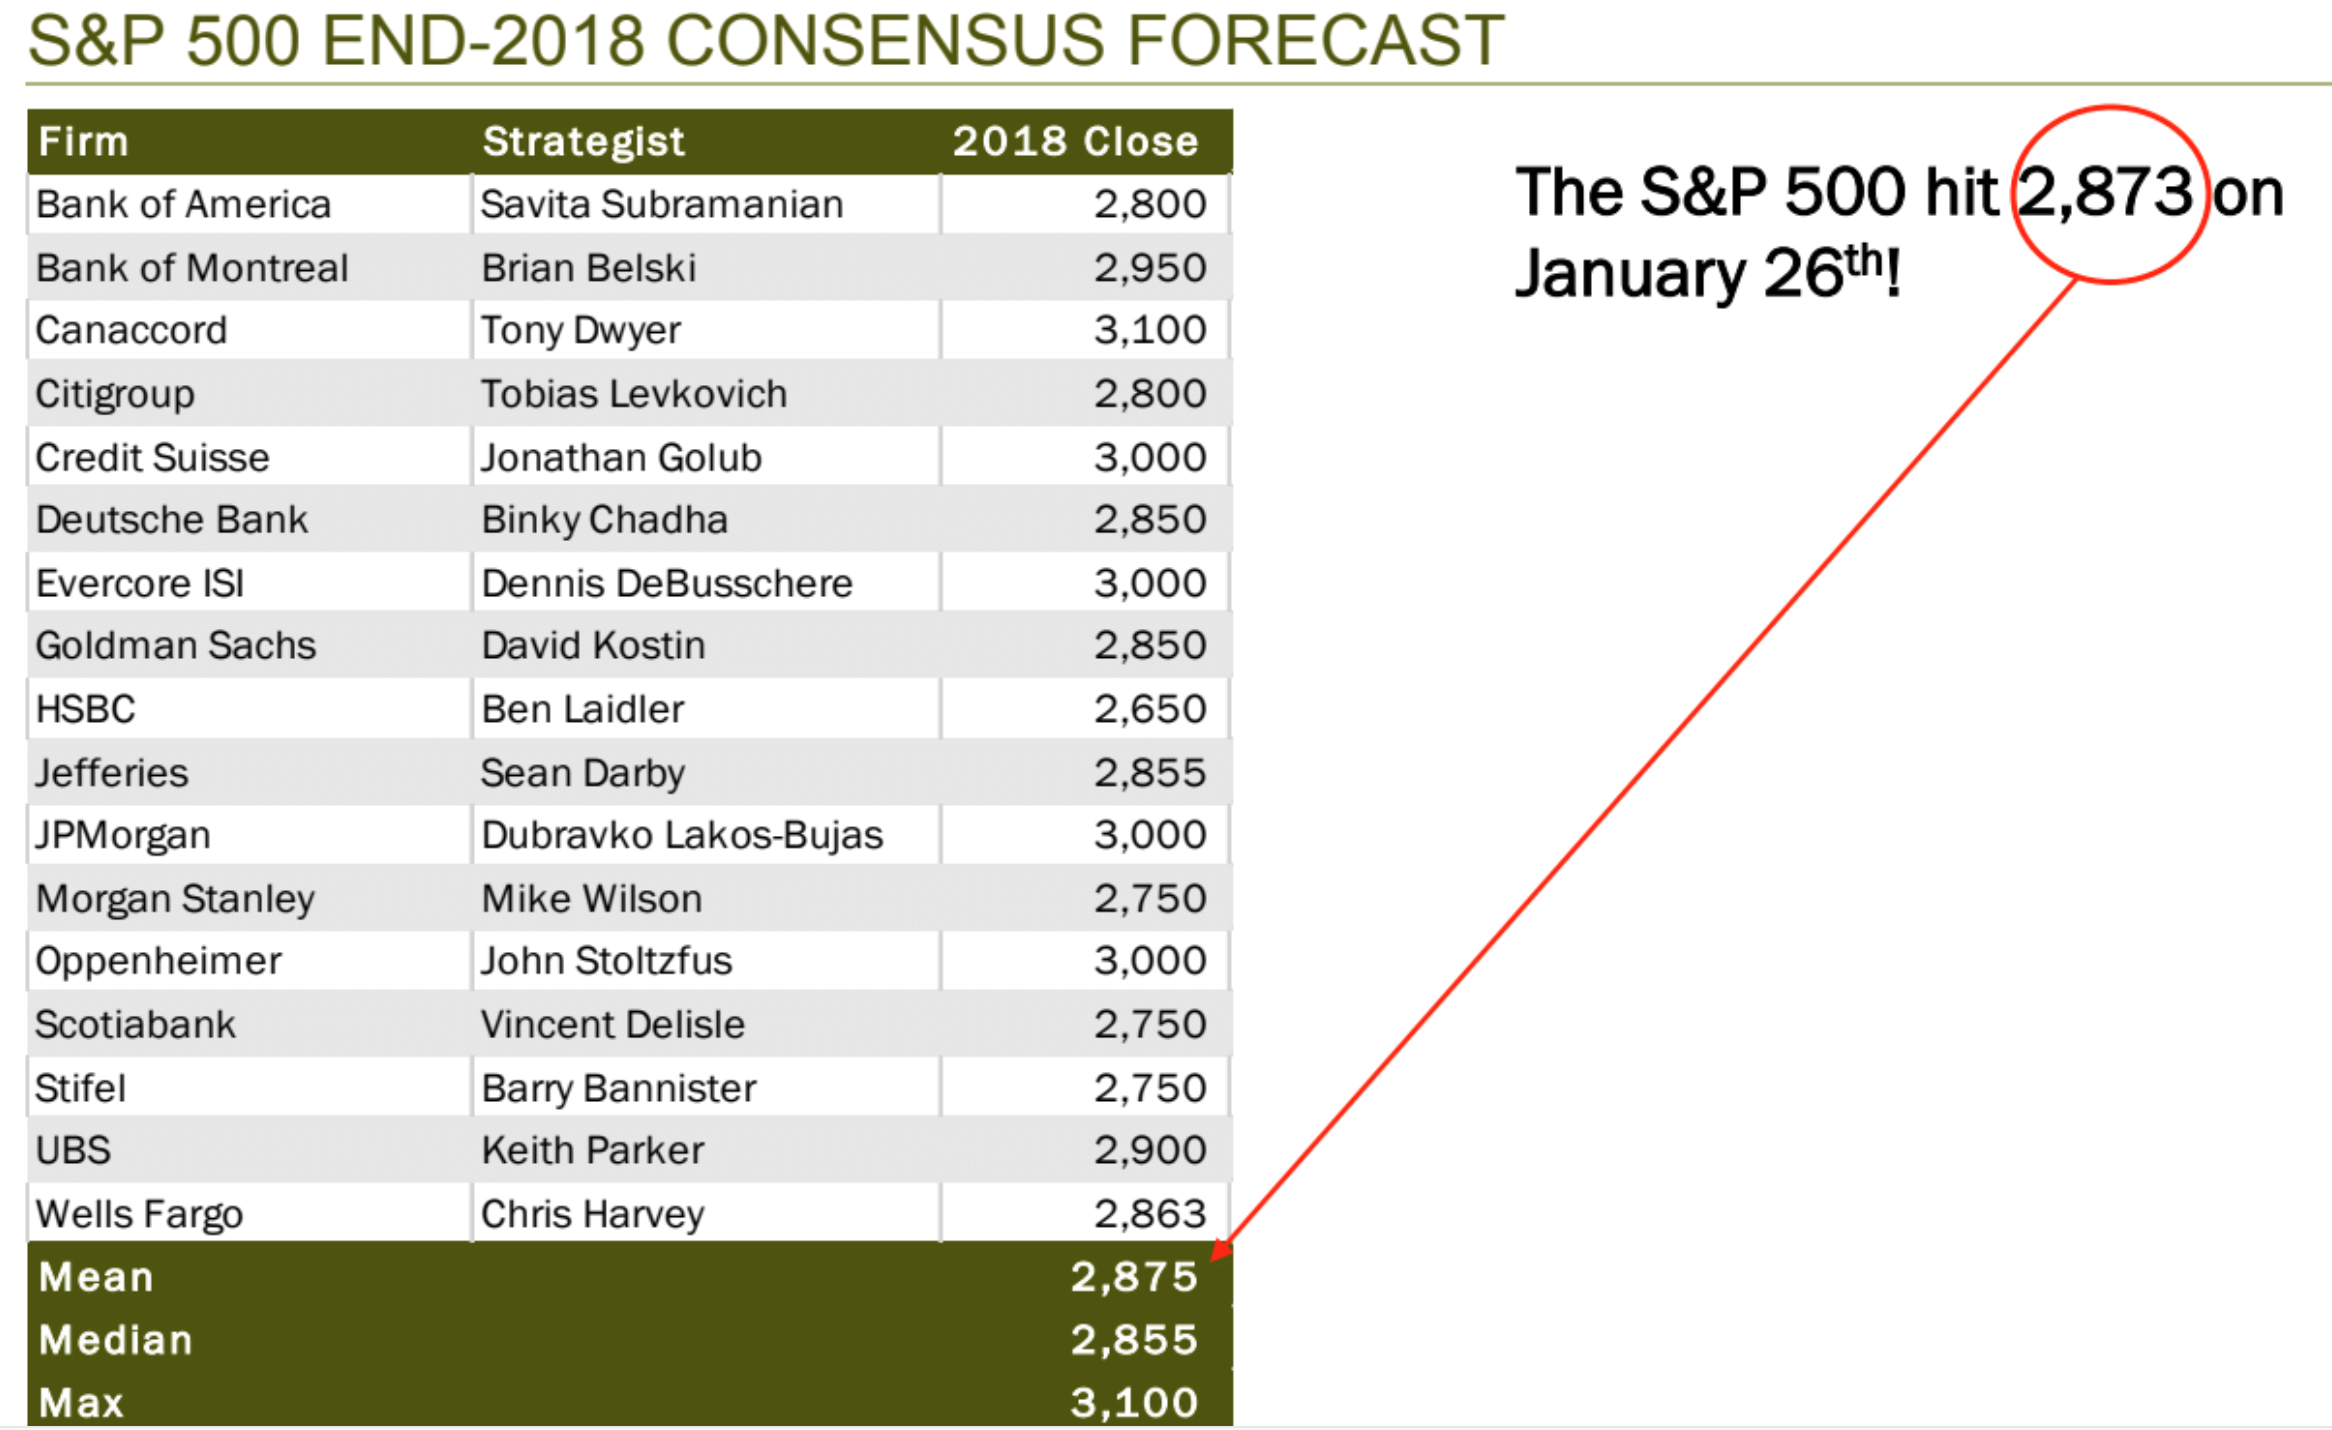 Did the US market already hit it’s 2018 upside target – on January 26th? Crazy days.
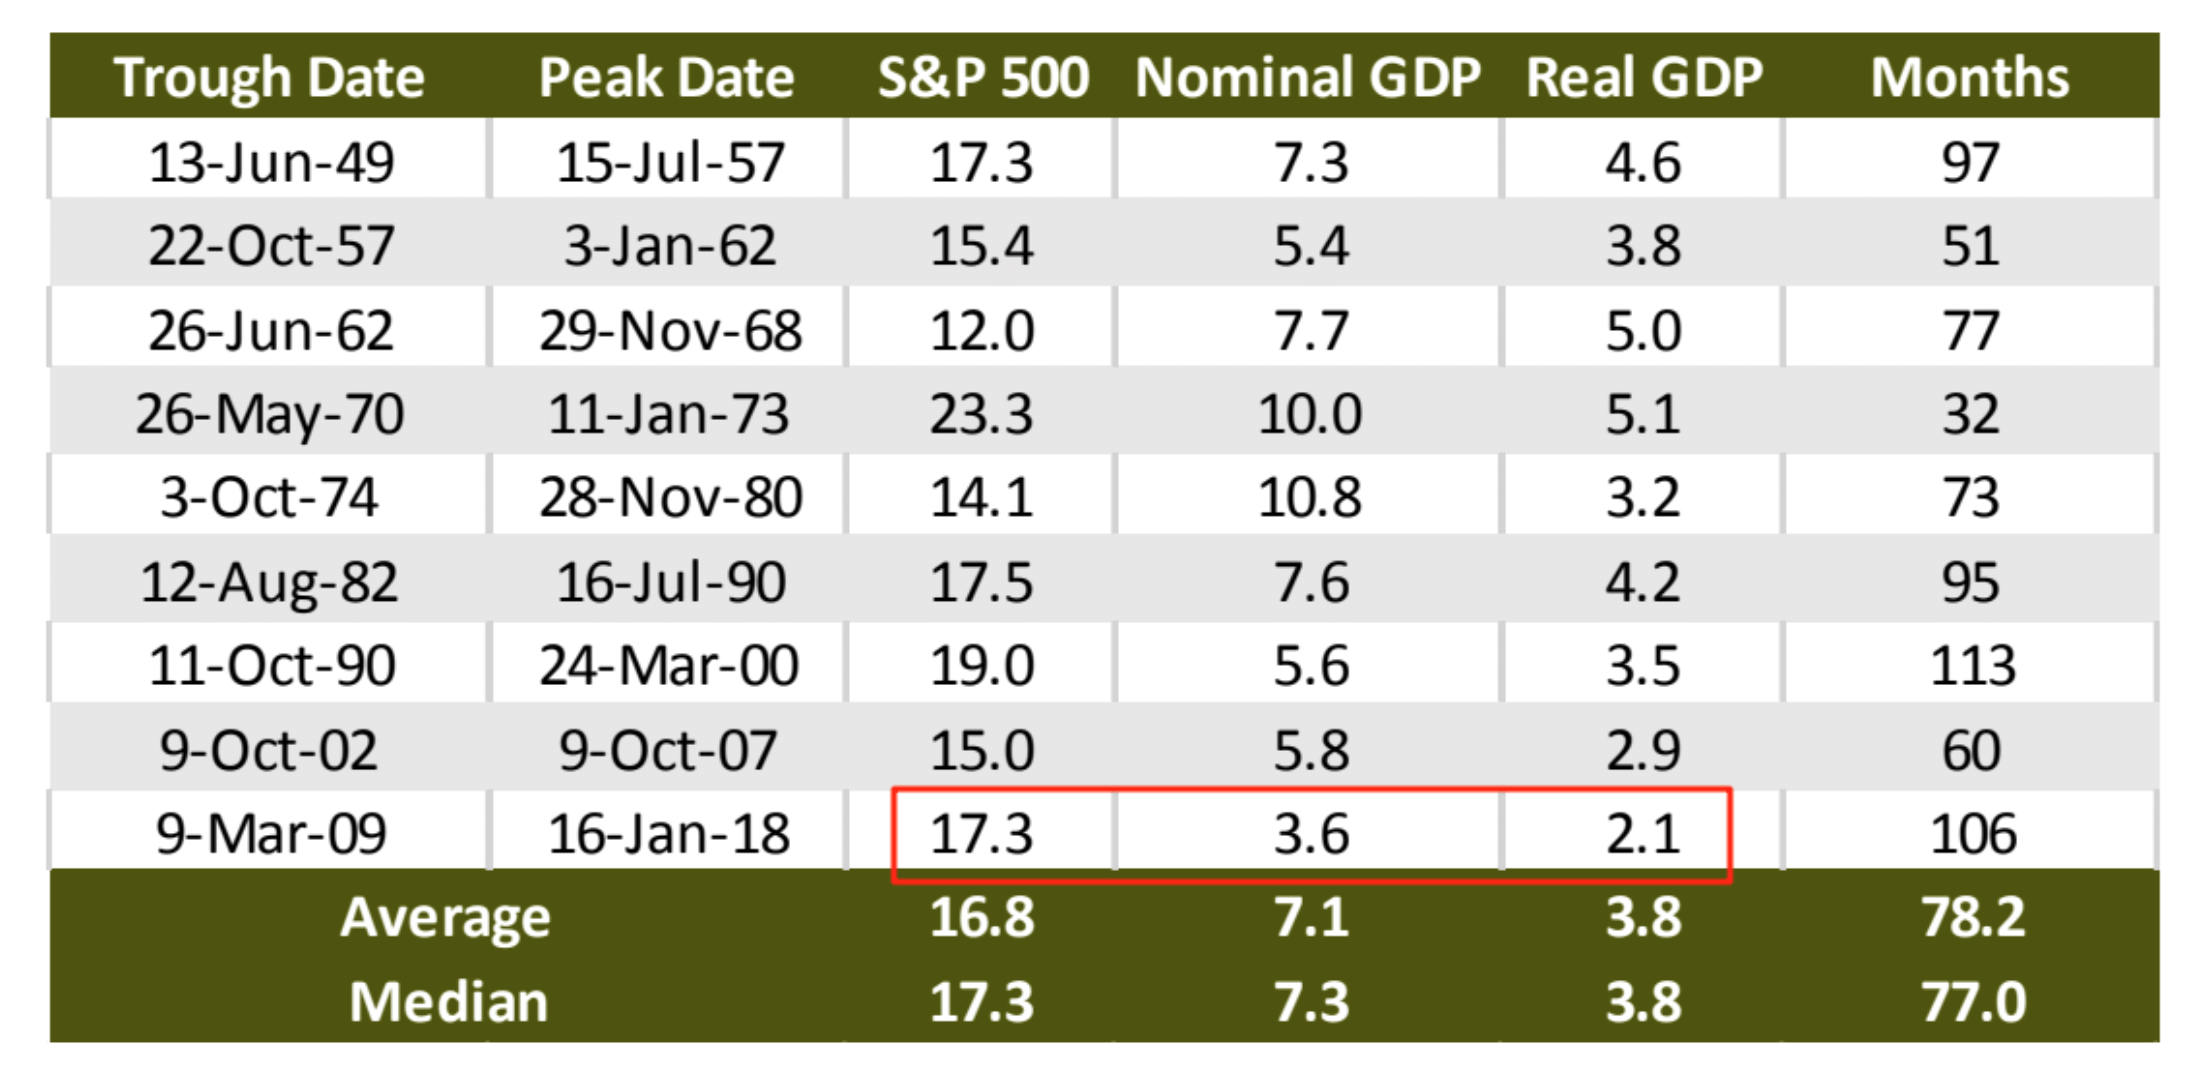
This chart shows the annualized gains in the S&P 500 during previous bull markets – average 16.8{1de7caaf0b891e8de3ff5bef940389bb3ad66cfa642e6e11bdb96925e6e15654}/ year with an average Nominal GDP of 7.1{1de7caaf0b891e8de3ff5bef940389bb3ad66cfa642e6e11bdb96925e6e15654} and real GDP of 3.8{1de7caaf0b891e8de3ff5bef940389bb3ad66cfa642e6e11bdb96925e6e15654}. While the gains and “months” of the current bull market are consistent with those of the past, it has done so with less than half of normal GDP growth. Share buybacks, rather than real earnings have been driving excess returns in this bull market but that’s a longer story. Share Buybacks are likely to end for all but the very largest mega-cap companies. Earnings and real GDP growth are going to have to start justifying these valuations or prices will fall.
Last One
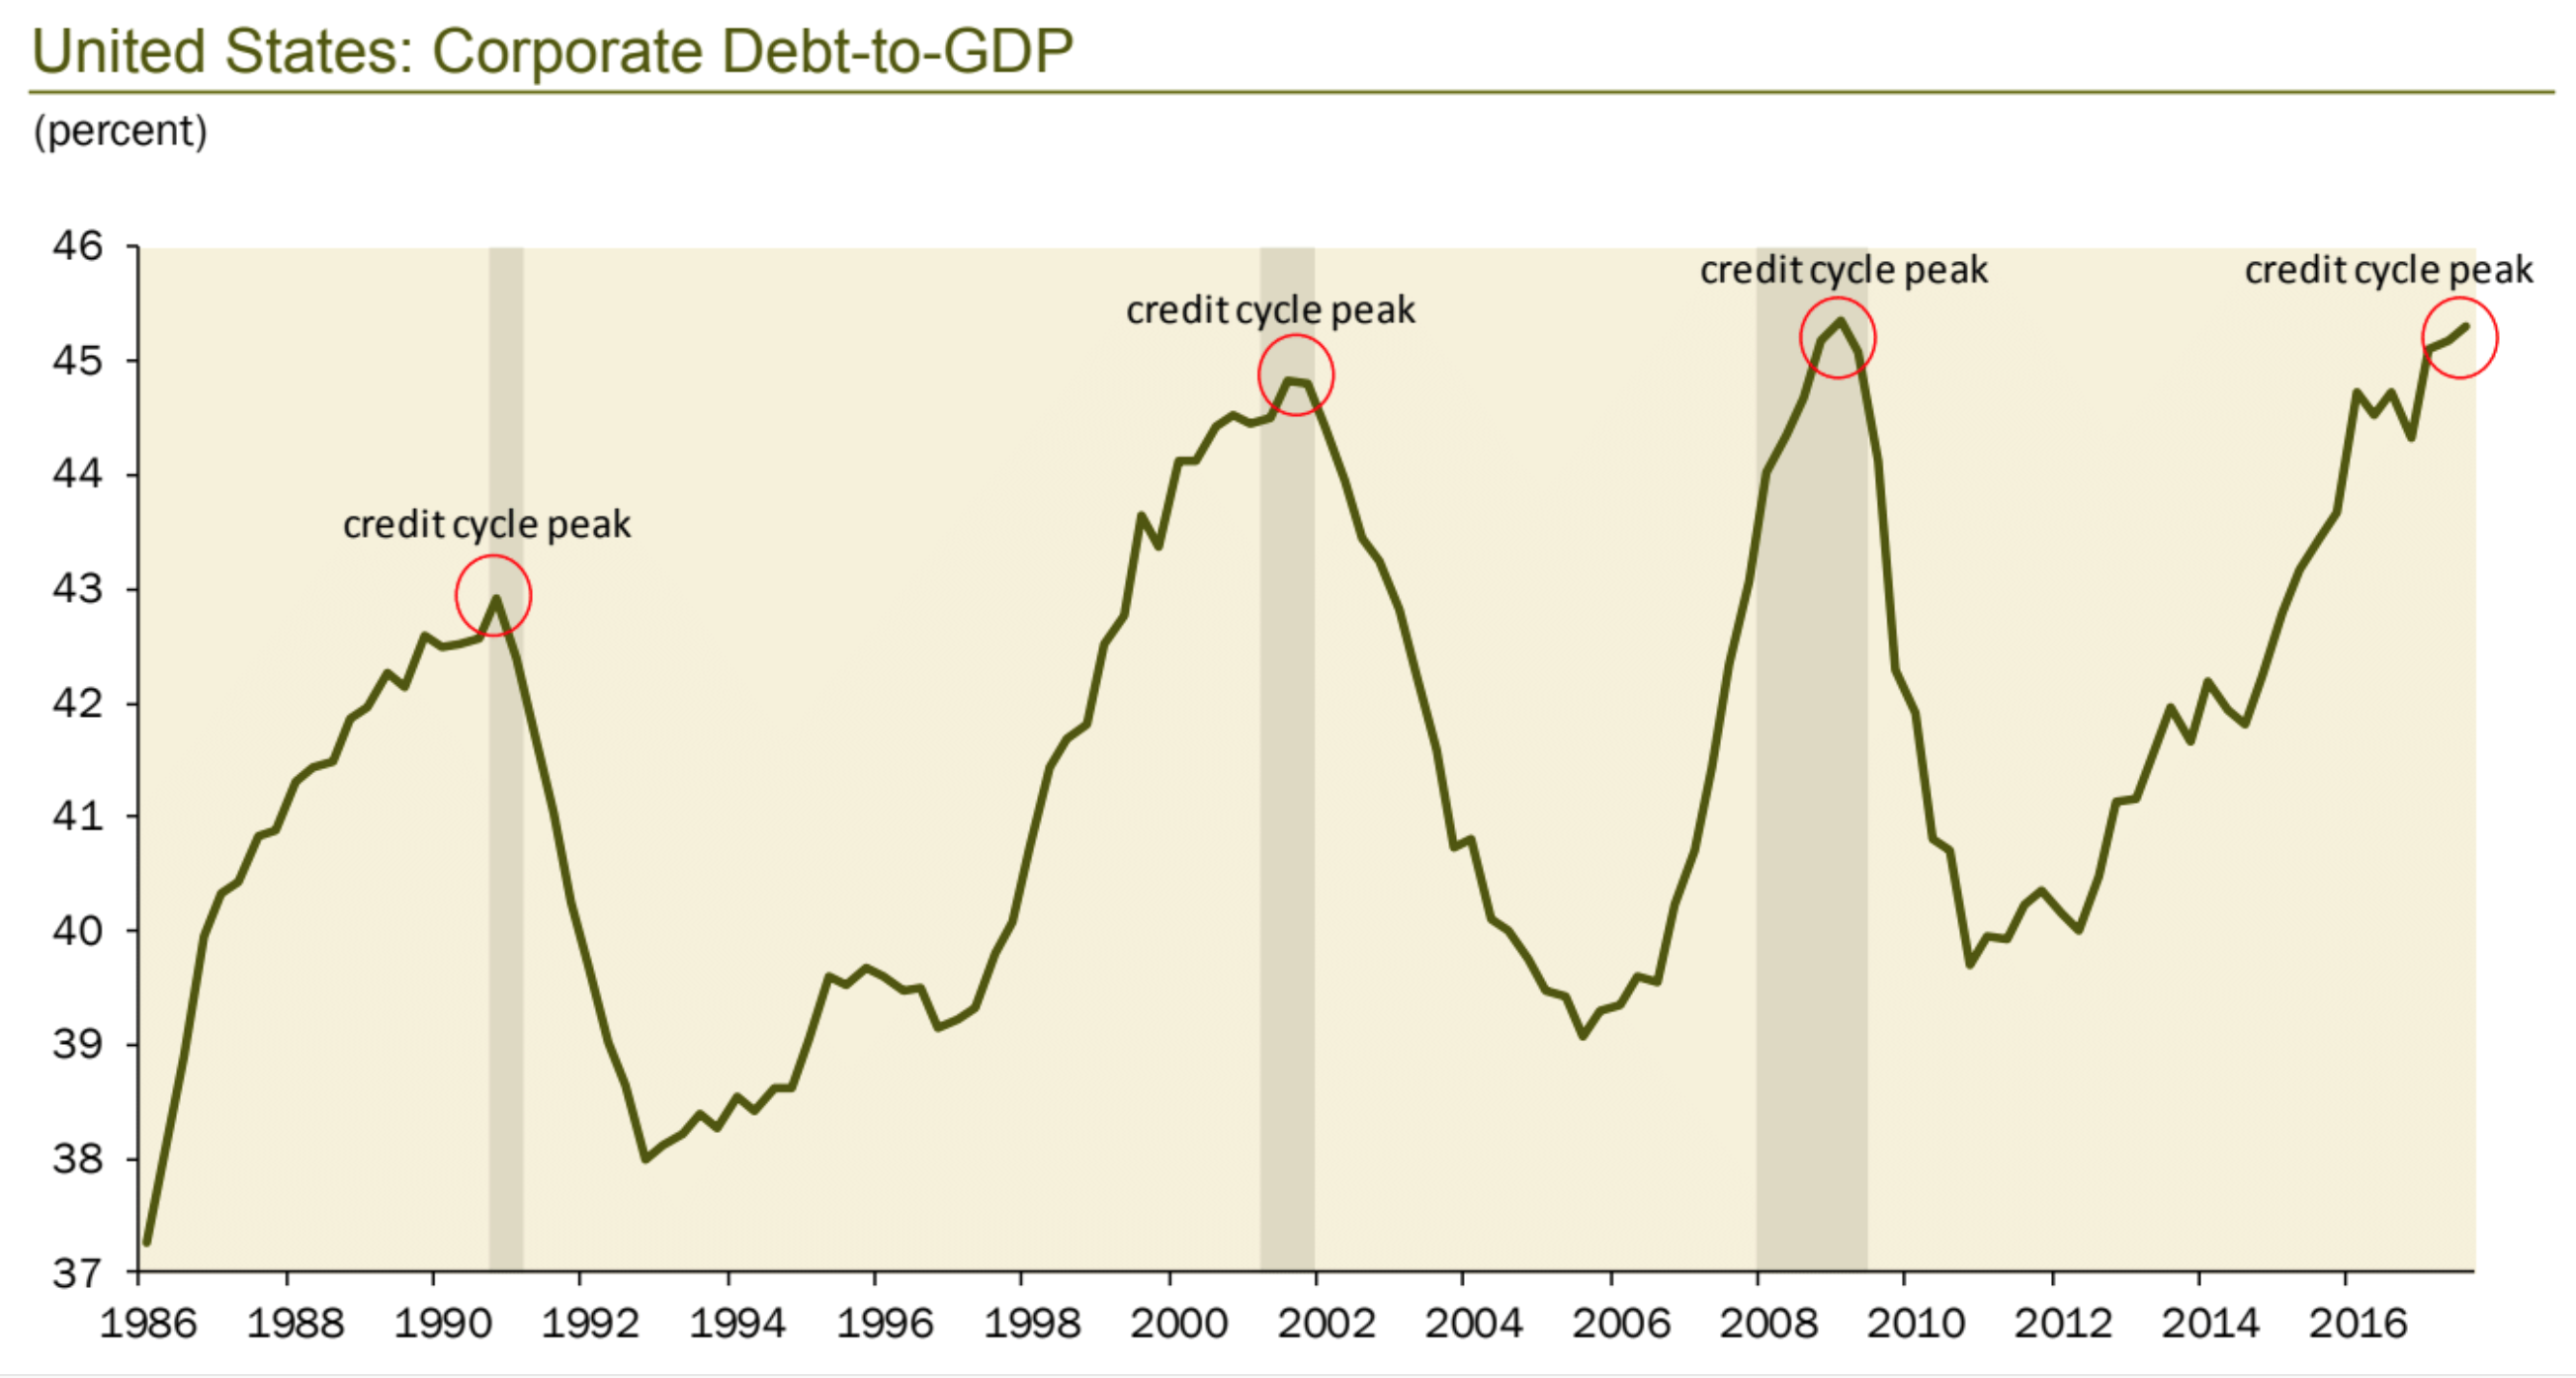
Is this is the top of the corporate credit cycle? Shaded areas represent recessions. We’re probably close, give or take a few months or quarters.
That’s it for today. Needless to say, we’re staying flexible with our holdings and assumptions about the future, ready to de-risk our portfolios if need be and watching all of these lines in the sand very carefully. We’ve been glad to be your partner in wealth accumulation over the last several years as our greatest value now angles back toward wealth preservation. Create Wealth/ Defend It as our motto states.
Remember – Your investing life is way to short to waste your time (years) recovering from a huge loss.
Stay tuned.
Sam Jones
