It’s been a while since we provided an update on our long-standing “Big 3”. I hope our regular readers are nodding their heads in that all-knowing way; yes, of course, the Big 3.
Update
There are three long-term opportunities for wise investors who are looking to place their hard-earned capital into segments of the financial markets that are likely to have a long and prosperous period of out-performance. These opportunities stem from a basic concept of mean reversion when a significant piece of the financial markets moves strongly away from its averages in terms of price, valuation, or position relative to historical comps. Two of them appear to be in motion now, the third is still sitting idle. Here are the Big 3.
Value over Growth
Since 2006, thirteen years ago, we have watched the growth side of the market gather and consume investor money at the expense of the value side. By value, we are talking about companies that offer investors real value based on fundamental properties. Value comes in all shapes, sizes, and different sectors of the economy. They are not fast growers in terms of their business models but neither do they carry high debt, or make promises they can’t keep (ahem, Grubhub, Pinterest, and Co.). Instead, value companies offer investors higher dividend payments, high free cash flow, solid management, long track records of excellent performance, and very consistent earnings. Growth companies can be fundamentally strong as well but after 13 years of price appreciation, it just becomes harder and harder for earnings to keep up with the price. Eventually, they reach a tipping point when price becomes unjustified.
We might be there
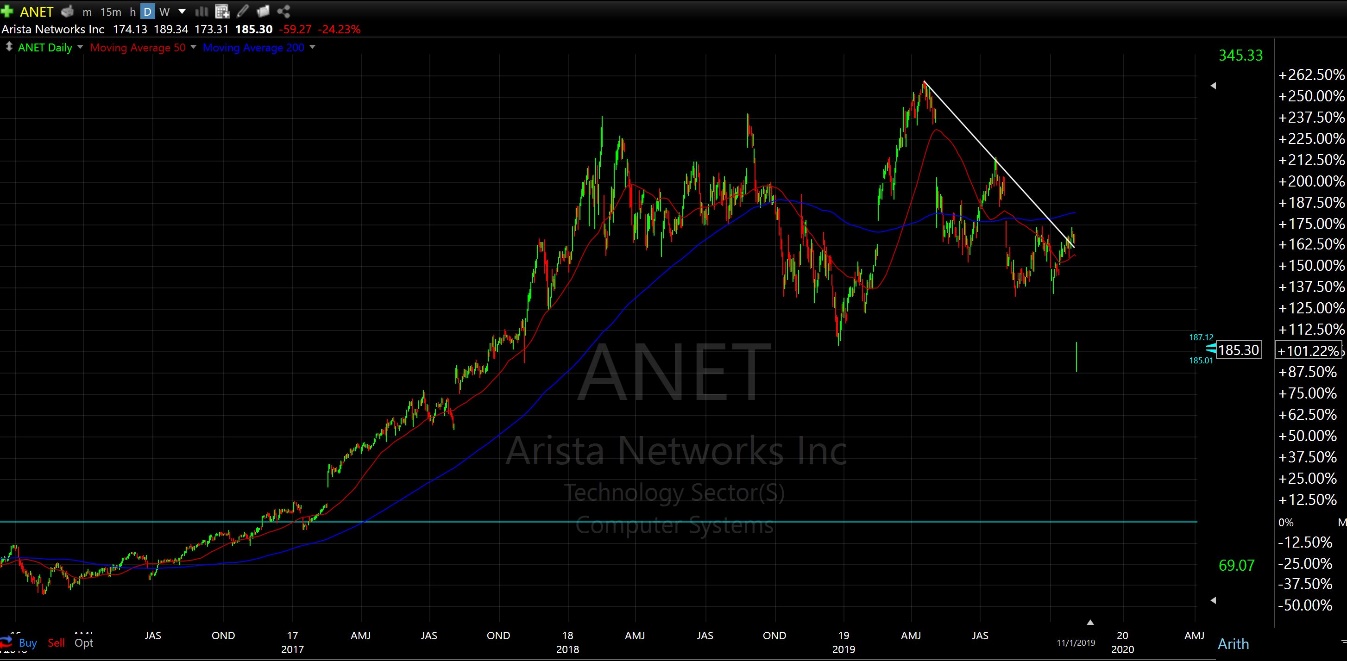
This quarter, we have seen a giant number of earnings shocks and investors have hammered those that even whisper (or guide) of lower earnings in the future. While more than 70{1de7caaf0b891e8de3ff5bef940389bb3ad66cfa642e6e11bdb96925e6e15654} of companies have beat very low earning ESTIMATES, we have also seen some very high profile price devastation. Arista Networks (ANET) was Friday’s nightmare closing down 24{1de7caaf0b891e8de3ff5bef940389bb3ad66cfa642e6e11bdb96925e6e15654} on the day and making a new 52 week low. Arista Networks beat earnings estimates and is still doing great things but the stock price just got ahead of itself (way ahead). Arista Networks is a growth company and not an isolated example.
Meanwhile, on the value side of the market, where prices have fallen for years while earnings and cash flow have been accumulating and rising steadily, we have seen just the opposite. Prices are popping higher, gapping higher on even the slightest bit of good news. Our clients invest in our High Dividend strategy, own 16 companies that fall into the value camp representing 60{1de7caaf0b891e8de3ff5bef940389bb3ad66cfa642e6e11bdb96925e6e15654} of total assets. You’ve seen some very large moves in recent weeks. While we wouldn’t call these High Dividend-paying stocks, they are still distributing more than 3{1de7caaf0b891e8de3ff5bef940389bb3ad66cfa642e6e11bdb96925e6e15654} annually. I’m pleased to report that our High Dividend strategy has been outperforming the S&P 500 weekly since early July, consistent with the move toward value.
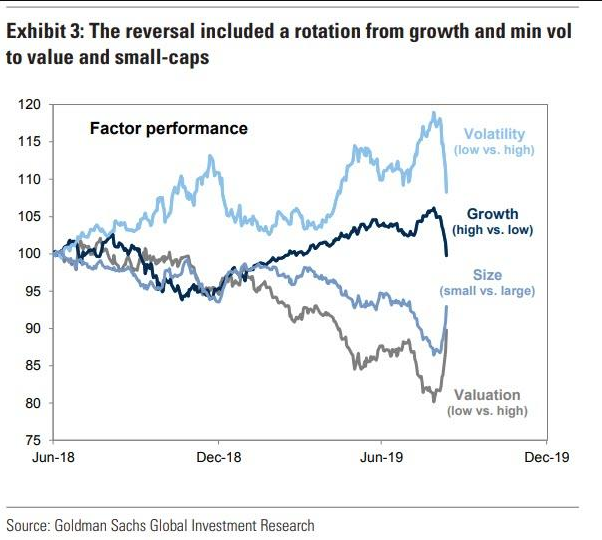
The point is that there are some very expensive things out there getting hammered and a ton of very inexpensive things being rewarded. Even the all might Amazon has under-performed the S&P 500 by 17{1de7caaf0b891e8de3ff5bef940389bb3ad66cfa642e6e11bdb96925e6e15654} since last September. The last time I saw a stock picker’s market like this was nearly 20 years ago in the year 2000. The Value over Growth opportunity is one that began lightly in September of last year but has accelerated dramatically since August of 2019. Take a look at this factor chart from Goldman Sachs.
It seems pretty obvious that we should consider accumulating some high volatility, small-cap value stocks (or ETFs) as well as take a few profits in the large-cap growth stock space. I know…. Unspeakable.
Internationals Outperforming Domestic
The same story holds true here. Internationals have been wildly under-performing the domestic equity market for about as long as value, almost 13 years. Granted, Europe and emerging market countries like those in South America, Eastern Europe or South East Asia, have struggled for a number of reasons. China has given up some relative ground recently but has been outperforming the US stock market for years – and will for years to come (personal opinion). But it appears the tide is turning now. If you believe in reversion to the mean, then you will embrace international investments as they are now much cheaper on average than North America. Like our Big opportunity #1, the shift to Value, we believe investors have enough reason to rebuild, even overweight, their international exposure now. Today, statistically, investors have very little international exposure, and yet, since August, this is where we are finding clear leadership over the US stock market.
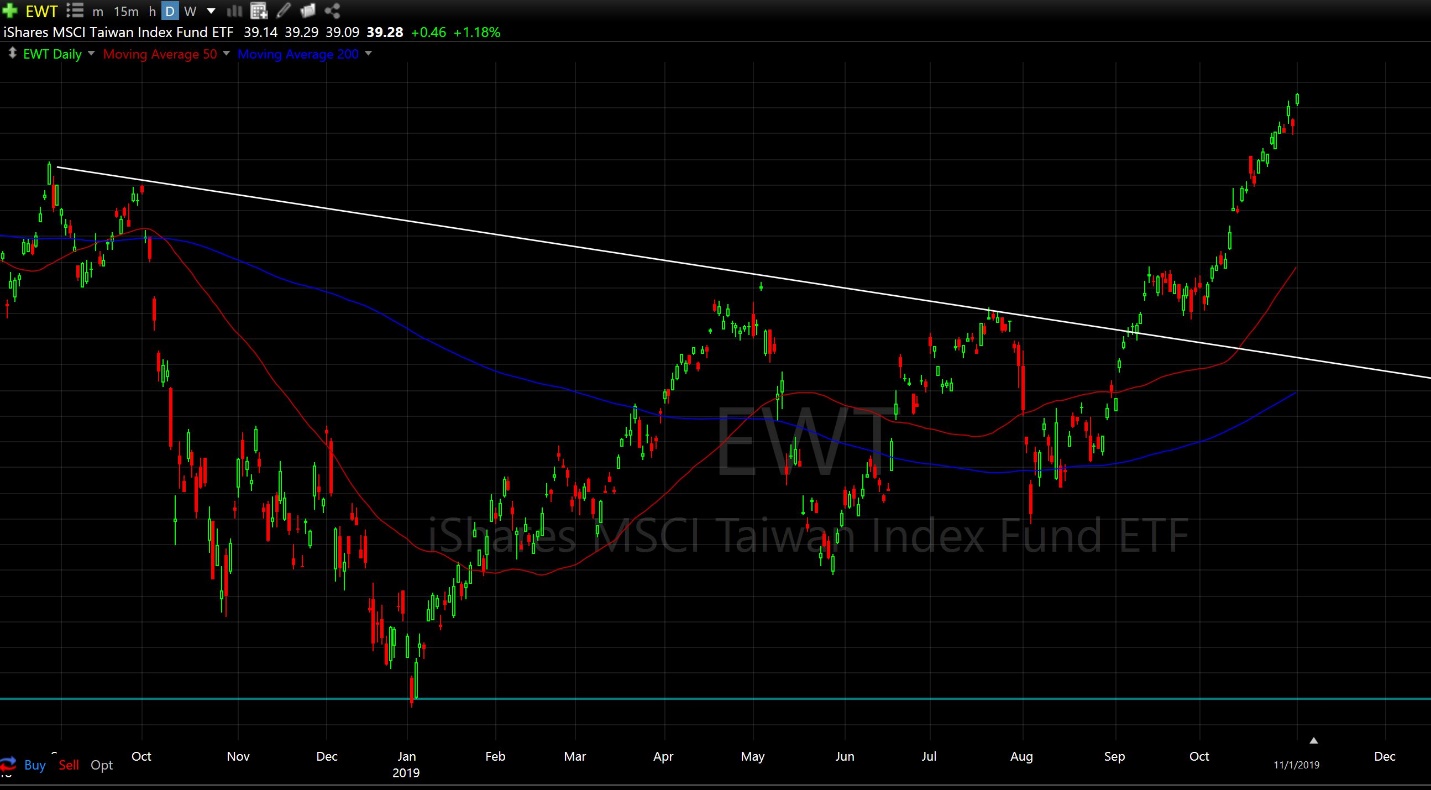
On Friday, we were all pleased to see the US stock market finally break out above recent highs after nearly 21 months of flat, choppy, and volatile action. But where was the confetti when Europe, Taiwan, Emerging market, Japan and most of the Pacific Rim countries did so nearly 30 days ago. Here’s a chart of the Taiwan Index ETF which we own in our WORLDWIDE sector’s strategy next to eight other country-specific funds. Nice!
In a somewhat rare Kumbaya moment, we also have new weakness in the US dollar. A weak US dollar provides a tailwind for international investing themes.
Commodities Rising From the Ashes
This is the last of the Big 3 investor opportunities and has yet to really take hold. We’re thinking that this asset class may need more time before it really runs as the environment of strong global demand for hard assets is just not there at the moment. Gold and Silver which are part of the commodities complex, have started new bull markets and can be part of a portfolio now, but these are really fear trades and not representative of resource scarcity or an environment that would support a more broad-based move in commodities. On the other hand, tariff wars and other inflationary measures don’t seem to be going away so maybe we’re closer than we think. Perhaps Gold and Silver are telling us that inflation is coming or understated? Keep an eye on this one but tread lightly.
Stock/ Bond Ratio Still Favoring Bonds Barely – Side Note
Years ago, we gave up on forecasting. It’s a sensational exercise that takes a lot of time and yields very little value. We are not bullish or bearish in terms of the markets looking forward. We are simply trend followers and asset allocators choosing to keep our clients’ money invested in the sectors, countries, and asset classes showing the best relative strength and risk adjust return properties. We avoid sitting on large cash positions (unless cash is the best performing asset class!). Remember, our selections won’t always produce the highest returns, but they will be the best returns available for a given amount of downside risk and volatility. This quarter has been exemplary for those who don’t understand the unbreakable bond between inherent risks and returns.
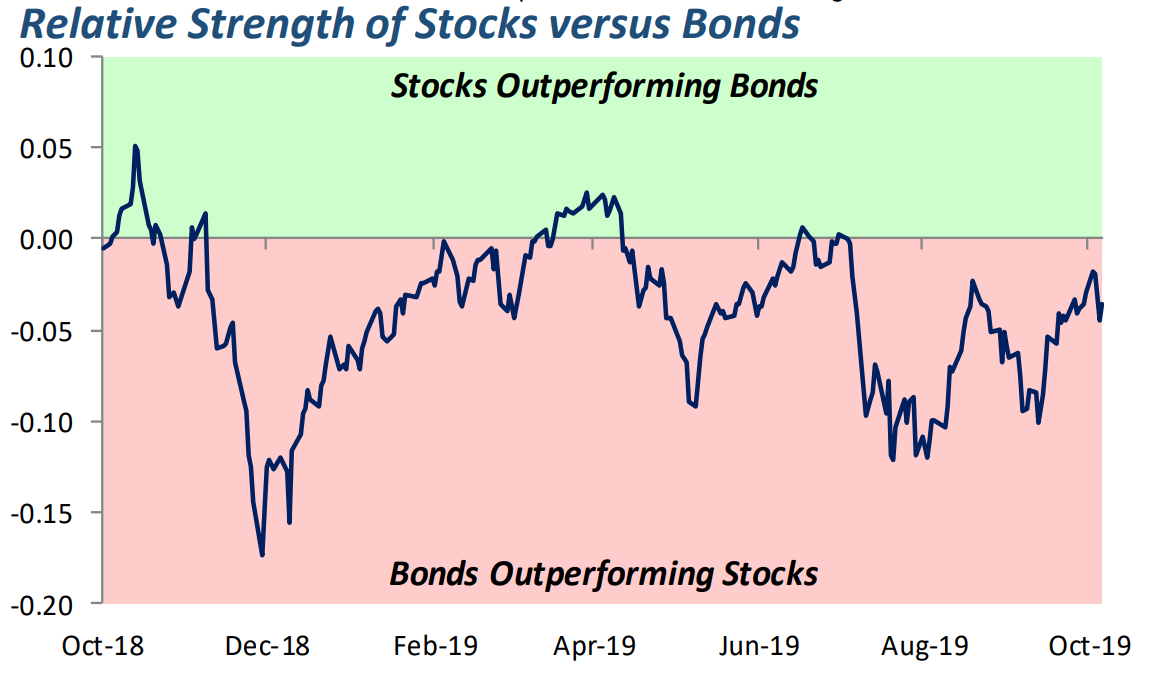
One component of our modeling does include something called Net Exposure which helps guide our total exposure to the stock market as well as our internal decisions of how aggressive we want to be from week to week. But our main focus remains on our Selection screens that point us in the right place to invest our client’s money. Much of this commentary has been focused on selection obviously. This is what we do. You’ve also heard us talk about why investors should have larger bond positions over the course of the last 20 months. Remember, stocks (the US stock market) have been very flat since January of 2018, losing nearly 20{1de7caaf0b891e8de3ff5bef940389bb3ad66cfa642e6e11bdb96925e6e15654} at the end of 2018 and just recently recovering those losses. Bonds meanwhile have gone straight up and generated some very healthy returns on a total return basis over that same time period. Our Income models have made all-time new highs nearly every week for the last two years. Now the tide may be shifting back toward stocks a bit. But the stock-bond ratio provided by Bespoke shows that bonds are still outperforming stocks! As I’ve said before, this is really the only chart that matters for the majority of investors.
It is still too early to make that call but it’s an important thing to keep your eye on and we all know where to invest in stocks right? (reread above). Those of us who identify as Dynamic Asset Allocators will be ready to shift our assets towards a heavier stock allocation as the evidence unfolds. Every day I am grateful that we don’t have to pick a position and pretend to know the future of the market or the economy. So sensational, such a waste of time! Following trends are so much easier than forecasting.
That’s it for now, happy November
Sam Jones
