Stock Rebound is Failing
First, I apologize for being out of touch for the last couple weeks. We have lots of business “stuff” happening now including working with new households, integrating new software and working through some of our internal systems. It’s all good and you’ll see the benefits soon but I haven’t had time for more frequent market updates. Thankfully, there hasn’t been much to talk about… until now. Settle in.
Net Exposure Model Going Negative Again
Backing up the tape a bit, our net exposure model switched back to a positive reading in the first week of April and has remained there until literally today assuming the markets are going to close around this level (-1.4{1de7caaf0b891e8de3ff5bef940389bb3ad66cfa642e6e11bdb96925e6e15654}). While the signal has been positive, we wouldn’t call it robust or persistent over the course of the last several months. We have offered clear advice like “Don’t get married to any positions” or “ we are buying rental positions only for short term trades”.
Last week we saw the beginning of real price declines starting first over in Asia (we sold our Asian ETF’s last week and finished selling the rest of our China position yesterday), then spilling into Europe (we never owned Europe) and now landing on our shores today with a pretty complete and comprehensive selling of all non-recession trades across the board. As of Friday, our model went to zero exactly and will go negative with today’s price action in the markets, forcing us to raise at least 20{1de7caaf0b891e8de3ff5bef940389bb3ad66cfa642e6e11bdb96925e6e15654} cash. In most cases, we’ll have over 30{1de7caaf0b891e8de3ff5bef940389bb3ad66cfa642e6e11bdb96925e6e15654} cash as we’re also hitting some significant stops. Our guidance at this point suggests that the 3rd quarter could be tough on stock prices even in the face of reasonably good earnings reports starting in just two weeks. Financial headlines are all about Trump and his trade war. They may be right but we’re really just reaching for a label or a justification for what the market wants to do anyway – go down. If I had to guess, given the set up and the conditions of our indicators, it seems likely that we could be just facing a stiff and steep correction in the 3rd quarter. But post elections, we need to have our physical and emotional capital intact for a potential great buying opportunity and a very healthy 4th quarter rally. That process starts by taking profits when you need to.
Recession Trades Firing Up Despite Unbridled Consumer Optimism
This is a classic example of a confusing moment in time for armchair investors. Today, it was reported that consumer optimism about the FUTURE of the US economy hit an all time high. I found it a little odd that the all time high number was 52{1de7caaf0b891e8de3ff5bef940389bb3ad66cfa642e6e11bdb96925e6e15654}; doesn’t seem very high to me frankly. Are we just a nation of pessimists? Anyway, that happened. Meanwhile, starting last week, the entire market character flipped from a growth – buy it at any price – cyclical orientation to the exact opposite. Now the recession trades are firing with healthcare, utilities, bonds, consumer staples and value leading up as all other “stuff” sees profit taking. Today was that critical day when the important leadership groups really gave up. This includes the FAANG stocks, financials which broke serious long term support and small caps. I suppose we shouldn’t be surprised considering we said back in April to expect another top of some sort in early July. July is 4 days away so let’s call it good. That forecast was predicated on some very high level guesswork for which we won’t be accountable, but logically based on the timing of a potential recession in mid 2019 in the US. Many things can and will change but so far, the timing of a potential market top now, seems to be consistent with the timing of an economic contraction next year. Confusion therefore is really about the gap in timing between financial securities and main street events. Remember, financial securities are priced today on the basis of expectations 6-9 months out. What we see and feel from our observations of main street activity is really coincident with the current state of the economy. These two worlds are often at odds.
Income Strategies Bridging the Gap Successfully (so far)
I know it’s been a while since we’ve seen any real returns coming from our two income models. In fact, it’s been almost two full years. Well I have some good news and I have some bad news. The bad news is that we haven’t made much more than a 1-2{1de7caaf0b891e8de3ff5bef940389bb3ad66cfa642e6e11bdb96925e6e15654} annually for the last 24 months. The good news is that we haven’t lost any money in the last 12 months! Yes, our income models are still based on the state and health of bond and credit markets across the globe. Let me pause and show a quick performance graphic comparing our Freeway High Income strategy to several different bond funds. Please also note our composite performance disclosure link at the bottom of each and every Red Sky Report. This is just a graphical representation of the composite performance of our income strategy net of all fees looking at the last two years.
- Red = ASFA Freeway High Income strategy
- Green = I shares Barclays Aggregate Bond ETF
- Yellow = IShares 20+ years Treasury Bond ETF
- Violet = IShares 7-10 year Treasury Bond ETF
- Blue = IShares 1-3 year Treasury Bond ETF
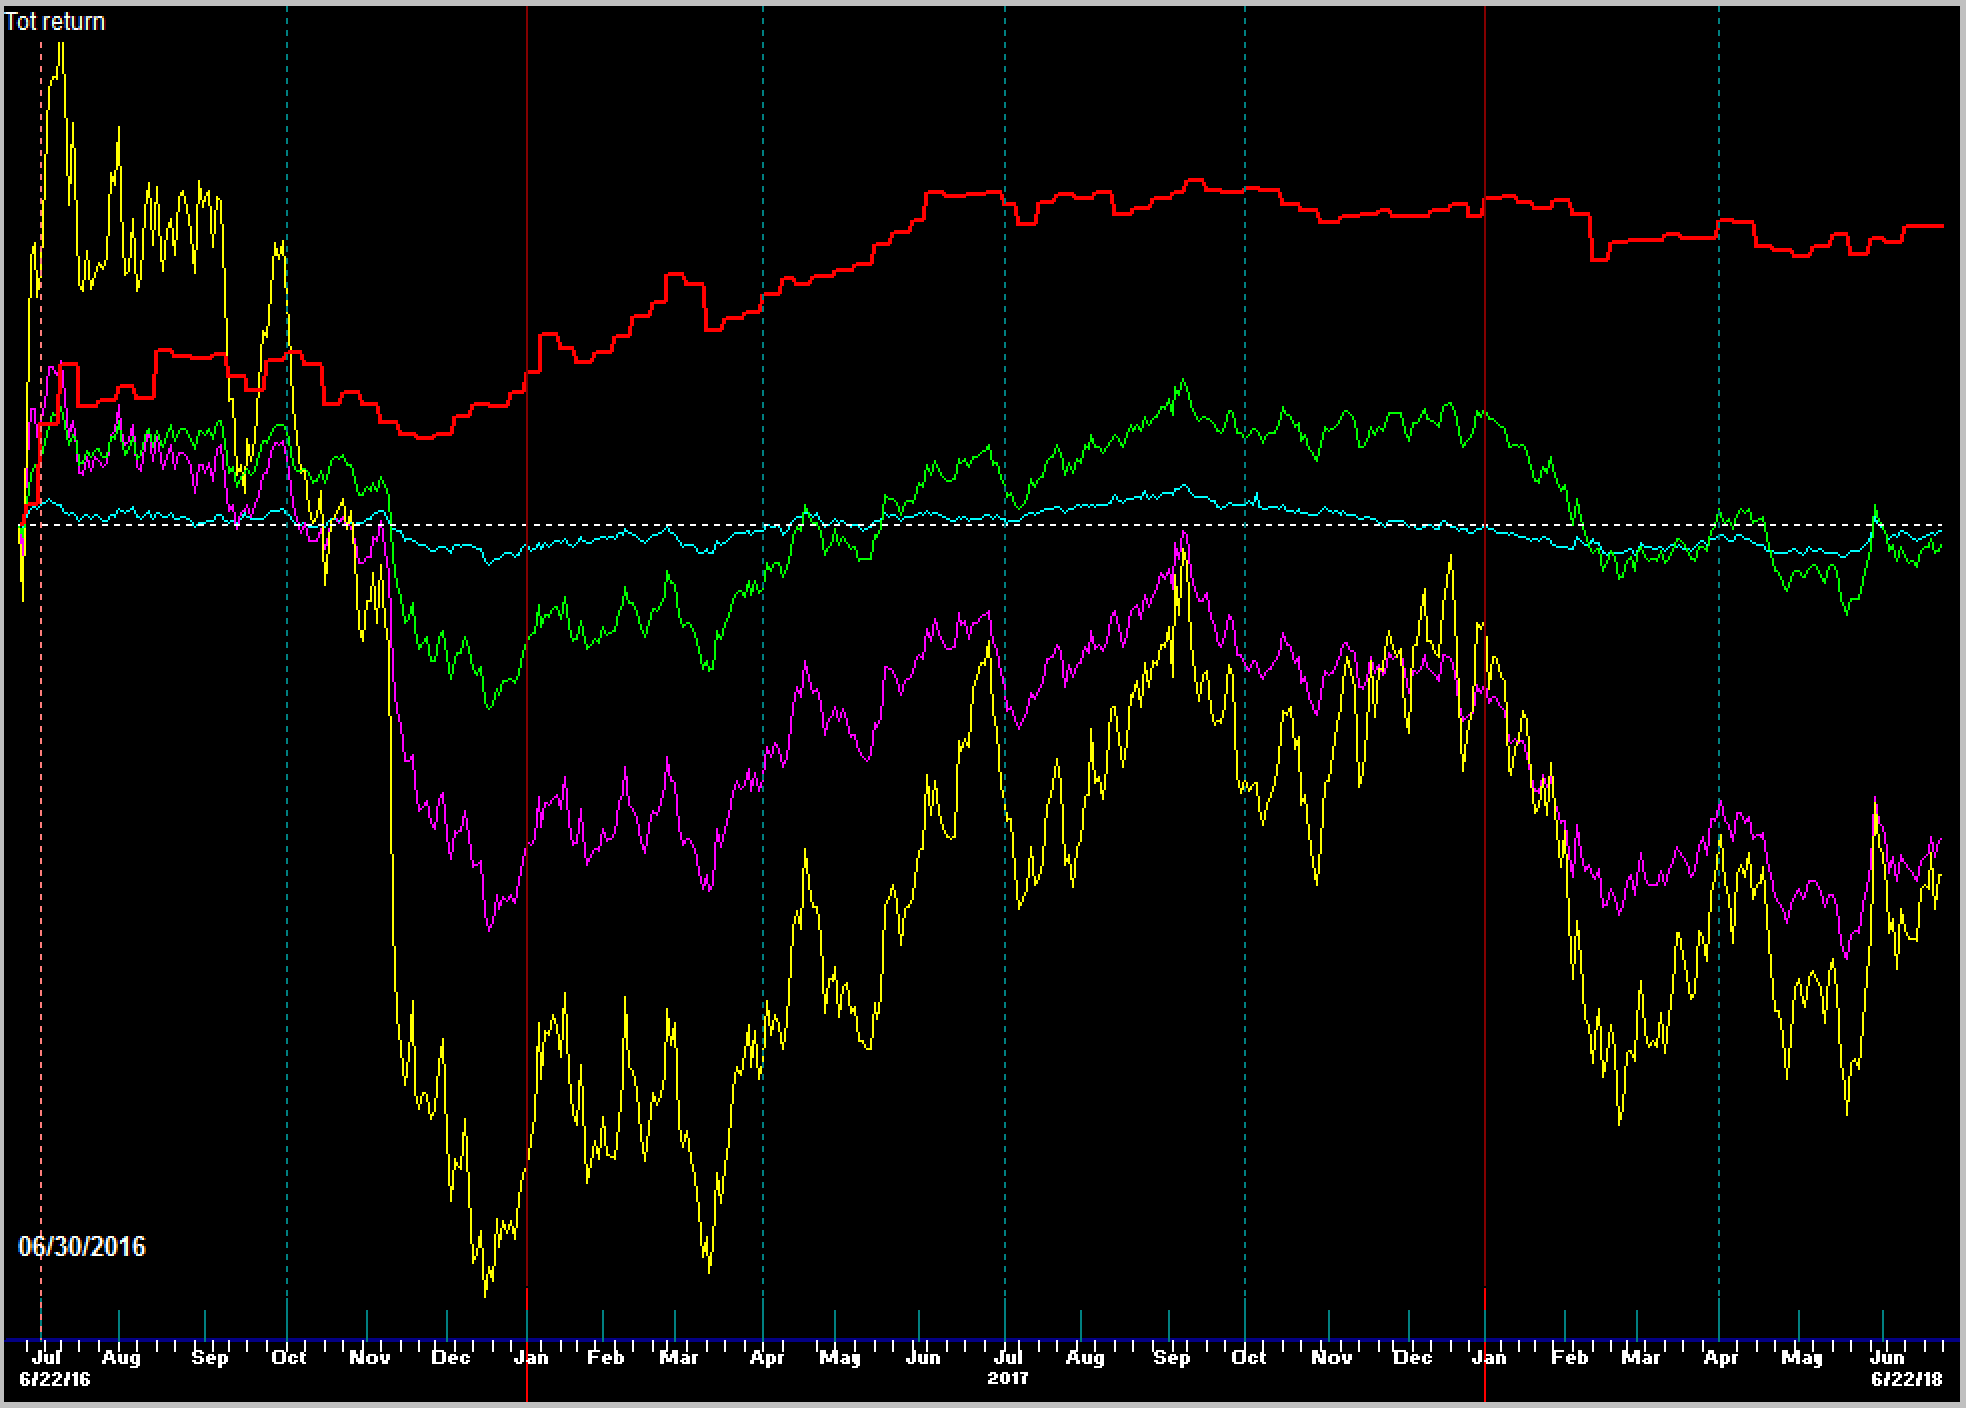
Without posting numbers, it’s pretty easy to see that we have more or less successfully kept our clients’ “income” allocations intact for the last two years while bonds of all sorts and maturities have consistently lost ground on a total return basis. In fact, we’ve made just under 3{1de7caaf0b891e8de3ff5bef940389bb3ad66cfa642e6e11bdb96925e6e15654} over the period net of all fees. During times like these our job is simply preservation of capital and selectively taking positions that do not carry any form of the price risks we’re still seeing in corporate bonds, high yield credit or long dated sovereign bonds.
But we’re not done yet!
There are two things that need to happen.
First, we need to see some signs that bonds are done falling and credit spreads are widening. For that to happen, we need to see some pretty dramatic calamity still in corporate bonds including a large increase in defaults and re-pricing. This hasn’t happened yet so we’re staying clear of any investment in this space. The second event is that we need to see the Federal Reserve essentially reverse their tightening policy. Now the crafty reader might understand that our Federal Reserve has a very long history of overshooting on cycles of interest rate hikes and we believe they will do so again. So for the Fed to end rate hikes, we would need to be IN a recession with enough evidence for them to recognize that tightening is no longer needed.
Between now and then, we’re actually finding some good places to put our clients’ income money including municipal bonds, specialty income funds, floating rate funds and most recently, short term bond funds, which we believe, have already bottomed. Short term bond funds carry very little price risk but are now paying almost 2{1de7caaf0b891e8de3ff5bef940389bb3ad66cfa642e6e11bdb96925e6e15654} in annual yield with the last Fed Rate hike. I hate to admit it, but 2{1de7caaf0b891e8de3ff5bef940389bb3ad66cfa642e6e11bdb96925e6e15654} actually isn’t bad for a liquid short term bond fund and it’s a lot better than you’ll find in most banks still.
All in, we would be very pleased if we could make 3-4{1de7caaf0b891e8de3ff5bef940389bb3ad66cfa642e6e11bdb96925e6e15654} annually net of all fees while bridging this historic gap of bond market repricing. On the other side, we’ll back up the truck and gobble up corporate bonds paying healthy yields of 8,10 even 12{1de7caaf0b891e8de3ff5bef940389bb3ad66cfa642e6e11bdb96925e6e15654}.
The ASFA Retirement Income and Freeway High Income strategies are appropriate programs for any who are looking for stable income and a flexible bond portfolio that adjusts exposure according to risks and opportunities.
Next week, we’ll provide an update on the historic spread in performance between Value and Growth as we expect to see a reversion to the mean starting soon. This could be one of the greatest investment opportunities of the last decade so stay tuned.
Have a great week!
Sam Jones
