Last Friday, we finished our market update with the following statement.
If you’re looking for markers, it would be likely that the S&P 500 would rebound back up to 2730 from here, almost 6{1de7caaf0b891e8de3ff5bef940389bb3ad66cfa642e6e11bdb96925e6e15654} higher, and then we’d see another round of selling back to the current levels. Current levels mean the lows established by the overnight futures price action on February 5th, which was 2529 on the S&P 500.
Today, the S&P 500 closed right at 2729. Rarely are we THAT accurate. So things are moving predictably in terms of how a normal correction unfolds including the recent rebound. Let’s take a second to review current conditions and set some expectations looking forward.
Our Net Exposure Model is Still Negative
Regular readers know that we adjust our Net Exposure to the markets based on a weight of evidence model using a range of +19 to -19. This happens inside each investment strategy. The model factors in sentiment, technical trends, market participation, momentum, seasonality, valuations and several other factors. These factors are weighted according to their importance in dictating the future direction of the stock market. It’s not perfect but it does keep our emotions out of the mix and forces us to just do what we’re told. The process of determining our final holdings also includes Selection Criteria as well as Position Size Criteria. The whole machine is well defined and time tested since the inception of our firm back in the mid 90’s. We have a neat little graphic posted on our site now if you want to get a feel for how it works
https://allseasonfunds.com/our-services/our-investment-process
On February 2nd, our model moved dramatically from a +8 to a -3, a negative reading and our first in while. On Monday of this week, the model got worse moving down to a -6 which was to be expected considering the carnage of last week. Now, prices have rebounded but only up to the breakdown point. Most of our momentum indicators are back to neutral and sentiment has marginally recovered but not a lot. Seasonality is still negative, valuations are still unattractive and market participation is still not very robust. Even if tomorrow were another up day in the benchmark indices, our model would likely remain negative all things considered (just guessing). At this point, our rules allow us to hold, sell or upgrade positions without dramatically changing our net exposure to the market. We did a little bit of all today. Positions that were hit hard in the recent selling and have lagged on this rebound were reduced or eliminated today. Proceeds were either placed in cash or used to add to positions that have held up well and seen renewed buying enthusiasm. We’re sticking with winners, cutting our losers but maintaining our net exposure to the markets for now (30-40{1de7caaf0b891e8de3ff5bef940389bb3ad66cfa642e6e11bdb96925e6e15654} cash). Looking forward, we could easily see selling pressure again, perhaps starting near the close tomorrow and extending into next week. The downside risk is the intraday lows of February 8th (2529 on the S&P 500), which is a long way down and would be very uncomfortable. As a general investing best practices rule, it usually pays to wait for a retest of recent lows before adding new money to any portfolio. After all, the recent lows could be just the first leg down so let’s be patient and work hard to eliminate all assumptions about the future.
What You Can Expect
I’ve never really articulated this before but let me try. As corrections and market volatility return to the financial markets, ultimately giving way to the next significant bear market, you can expect your portfolio to begin moving less and less in sync with the major market indexes. Obviously, if conditions are not favorable and our Net Exposure model is pushing us out of the market to cash, your portfolio return stream will gradually smooth out and begin to march to its own beat. This whole process can take several weeks and months.
For several years now, our Tactical Equity and Blended Asset strategies have been moving very closely with the markets, rising and falling on the same days and weeks within a largely favorable uptrend. If conditions don’t improve, you can expect that to change as our strategies become less and less correlated to the daily ups and downs. I realize, when we have big moves in the market in either direction, the impulse is to compare your account to some benchmark index of your choice. We ask those inaudible questions to ourselves, “The index was up X, how did my account do?” With 30-40{1de7caaf0b891e8de3ff5bef940389bb3ad66cfa642e6e11bdb96925e6e15654} cash now, you can expect that your portfolio will move about 30-40{1de7caaf0b891e8de3ff5bef940389bb3ad66cfa642e6e11bdb96925e6e15654} less than most indexes, in both directions. Also, remember that every one of our clients owns more than just stock in their strategies. We have bonds, commodities, internationals, hedges, specialty funds and income positions across your whole portfolio making comparisons to just one index (like the Dow) pretty irrelevant.
Why Do We Do What We Do?
I’m going to finish with a bit of philosophy as to why we remain focused on risk management as a core theme in the management of our client assets. The history if how this became a focus is too long for this update but involves a deep sense of cultural history in our family of planning for the future by managing or eliminating potential life risks (think insurance). But practically, I’ll give you something really rich to latch onto.
We offer risk-managed investment strategies as a focal point to our wealth management efforts because…..
LIFE IS SHORT
No really, that’s the reason. Investors typically have about 20-25 years of actual time investing in the financial markets will any real money. I would guess that average period is actually getting shorter as I see people can’t really afford to stick much away into investments (aka savings) until they are approaching their peak earning years. I also see a lot of people tapping their investment accounts in their 50’s for this or that – much earlier than previous generations.
Anyway, let’s say we have 20 years of productive time to make our investment wealth grow. Now, we know that there are long, long, long cycles where the markets just don’t produce much. The recent history of the S&P 500 tells that story well. From March of 2000 to April of 2013, the S&P 500 made exactly zero {1de7caaf0b891e8de3ff5bef940389bb3ad66cfa642e6e11bdb96925e6e15654} return. Now if you happened to start your investing career in March of 2000, after 13 years of no gains including not one, but two bear markets of -50{1de7caaf0b891e8de3ff5bef940389bb3ad66cfa642e6e11bdb96925e6e15654} each, you might be frustrated.
From our perspective, no one has enough investing time to waste losing 30-40 or 50{1de7caaf0b891e8de3ff5bef940389bb3ad66cfa642e6e11bdb96925e6e15654} in anything and then waiting years just to recover back to even. And of course, very few are ever able to hold through real bear markets. Instead, they sell at the lows, wait years to get back in and may never recover in their lifetimes!
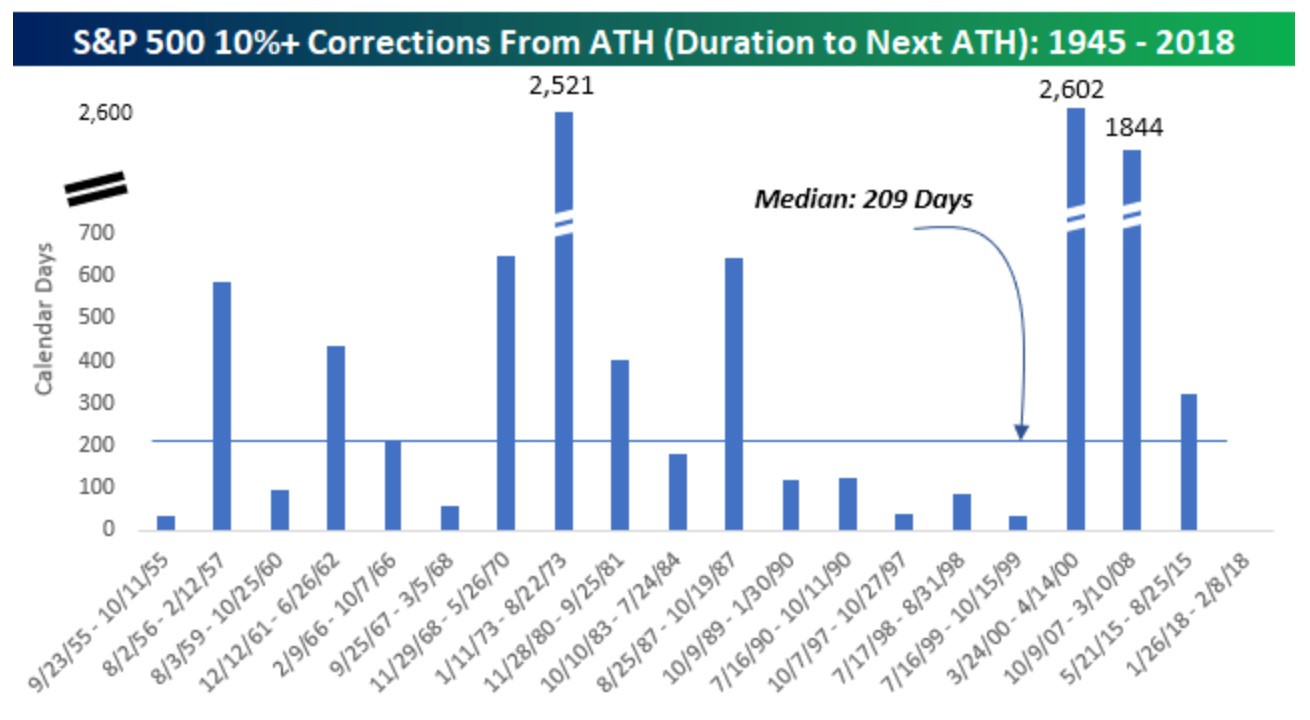
Here’s the best chart I saw all week. It was posted by Bespoke and it speaks to the actual time needed to break even following the first 10{1de7caaf0b891e8de3ff5bef940389bb3ad66cfa642e6e11bdb96925e6e15654} loss from all time market highs. Of course, not all 10{1de7caaf0b891e8de3ff5bef940389bb3ad66cfa642e6e11bdb96925e6e15654} corrections stop at 10{1de7caaf0b891e8de3ff5bef940389bb3ad66cfa642e6e11bdb96925e6e15654} right? The data here doesn’t even capture the losses that started from points below All-Time Highs, which is much worse but you get the point. 2,602 days just to break even?
In our shop, with our disciplined downside controls, we don’t experience the big losses associated with bear markets and thus you don’t have to WASTE YOUR SHORT LIFE recovering from losses.
That’s why we do what we do. Call us if you need help.
Cheers
Sam Jones
