“A bad month. The S&P suffered 16 negative days in October, tied for 3rd worst since 1928 and the most since 1970. The pressure was enough to trigger a sell signal for a popular trend-following strategy, with a close below its 10-month average” – Jason Goepfert, Sentiment Trader.com 10/31/2018
Jason’s comments above point to a few notable facts regarding the month of October just completed. This update will provide some much needed context for the current market situation, the degree to which we are positioned to mitigate further downside risks and important reminders for all of our clients regarding the Magic of the Mix.
October Carnage
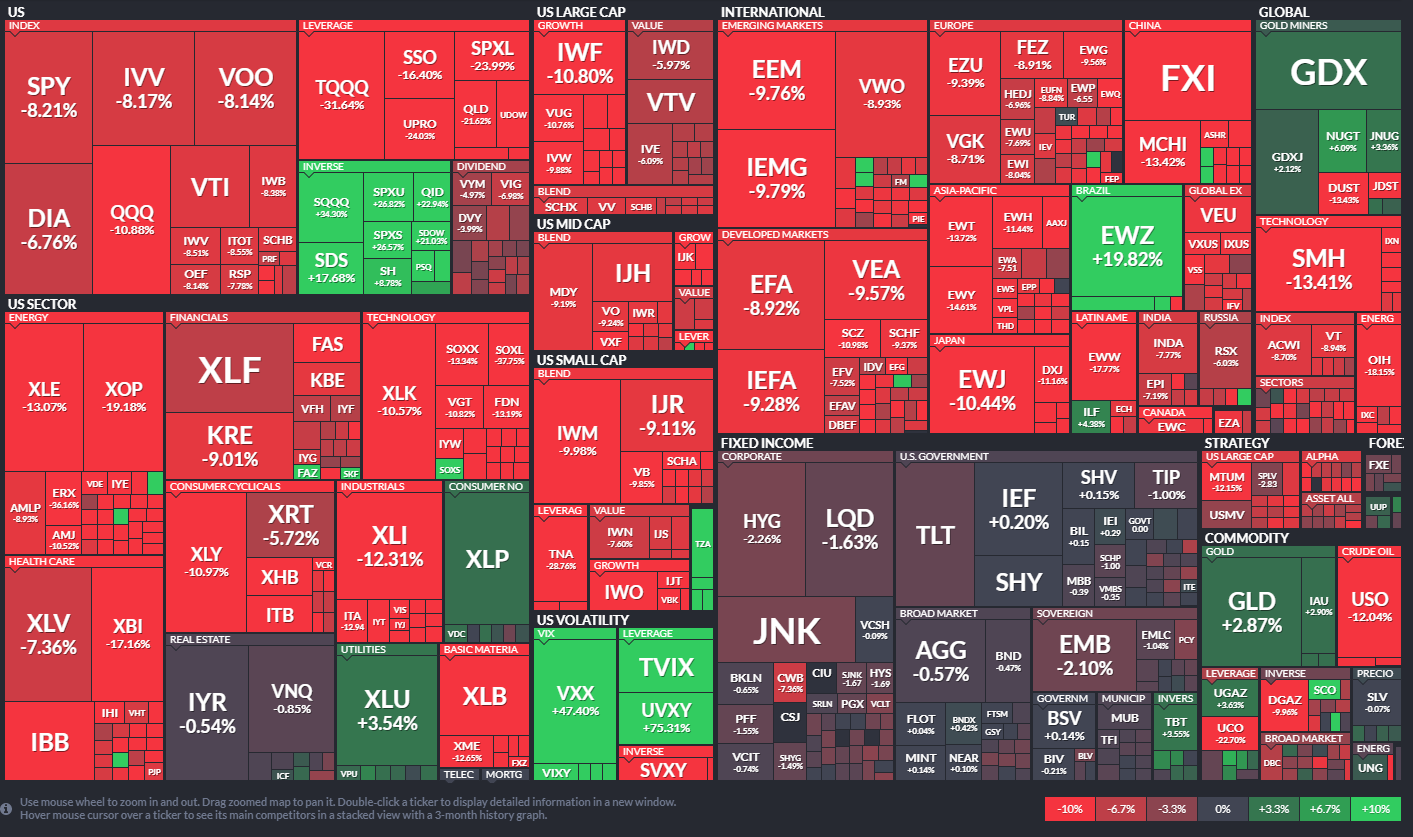
Beyond the relentless and painful selling in stocks in the month of October which was the 3rd worse in modern history, it’s also noteworthy that commodities, bonds, real estate and practically every other asset class also lost ground during the month. Take a look at the Red carpet below showing basic ETF results for the month of October provided by Finviz.com (accuracy of numbers is not verified). Also, you should know that this is a very tame view compared to what has happened to individual stocks and international markets prior to the month of October.The masses who own Facebook (FB) down over 30{1de7caaf0b891e8de3ff5bef940389bb3ad66cfa642e6e11bdb96925e6e15654} or Amazon (AMZN), down 21{1de7caaf0b891e8de3ff5bef940389bb3ad66cfa642e6e11bdb96925e6e15654} or Netflix (NFLX) down 27{1de7caaf0b891e8de3ff5bef940389bb3ad66cfa642e6e11bdb96925e6e15654}, have felt the pain in full.
Bonds provided no help except a tiny bit from short term bonds and Treasury Bills, which we own in bulk.
TLT (20 year Treasury Bond) – 2.74{1de7caaf0b891e8de3ff5bef940389bb3ad66cfa642e6e11bdb96925e6e15654}
IEF (10 year Treasury Bond) + 0.20{1de7caaf0b891e8de3ff5bef940389bb3ad66cfa642e6e11bdb96925e6e15654}
IEI (3-5 year Treasury Bond) + 0.07{1de7caaf0b891e8de3ff5bef940389bb3ad66cfa642e6e11bdb96925e6e15654}
SHY (1 year Treasury Bond) + 0.15{1de7caaf0b891e8de3ff5bef940389bb3ad66cfa642e6e11bdb96925e6e15654}
BIL (30 day Treasury Bills) + 0.33{1de7caaf0b891e8de3ff5bef940389bb3ad66cfa642e6e11bdb96925e6e15654}
Other benchmarks
MSCI All Country World Index (our stock benchmark) – 7.43{1de7caaf0b891e8de3ff5bef940389bb3ad66cfa642e6e11bdb96925e6e15654}
Barclays Aggregate Bond Index – 0.57{1de7caaf0b891e8de3ff5bef940389bb3ad66cfa642e6e11bdb96925e6e15654}
Commodities Index – 5.62{1de7caaf0b891e8de3ff5bef940389bb3ad66cfa642e6e11bdb96925e6e15654}
High Yield Bond Index – 2.26
It was an ugly month with nowhere to hide other than pure cash or possibly shorting the market (not recommended).This also occurred from an all time high in stocks making it just that much more frustrating for investors who found themselves climbing onto the all time new high train of news driven by FOMO (fear of missing out). You might also note the other dates mentioned in Jason’s comments. 1928 and 1970. Both years marked the top of bull markets. I’ll add three other years where October was a disaster. 1987, 2000 and 2007. Seasoned investors know these years as tough years and cycle highs for multi year bull markets. This is not a forecast but history can be a convincing teacher. Just sayin’.
Equity Strategies – First Down is the Worst
Our equity models experienced the normal losses (6-7{1de7caaf0b891e8de3ff5bef940389bb3ad66cfa642e6e11bdb96925e6e15654}) that we would expect for the first hard leg down in any market meltdown.Our most speculative stock strategy, New Power, lost a little over 8{1de7caaf0b891e8de3ff5bef940389bb3ad66cfa642e6e11bdb96925e6e15654}, which again is pretty typical but far less than most technology or energy stocks, which are the primary holdings. These are very recoverable losses for any of these strategies but recovery won’t happen immediately. These models are 100{1de7caaf0b891e8de3ff5bef940389bb3ad66cfa642e6e11bdb96925e6e15654} stock strategies and were almost fully invested as they have been since last spring as we moved through September.As stops were hit and we raised cash to 40-50{1de7caaf0b891e8de3ff5bef940389bb3ad66cfa642e6e11bdb96925e6e15654} in late September and into October, it wasn’t enough to really completely sidestep the types of market declines experienced in the market at large. We will always experience our worst declines in the very first move down. But now that we have repositioned the portfolio holdings towards heavy defense and reallocations to the new leadership, it’s what happens next that matters. Some (many) will continue to hold and hope for the bull market to continue with yesterday’s winners, especially in those cyclical groups or growth names, that have carried the market for the last three years. They have not yet realized or accepted that the environment has changed, leadership is not where it used to be and a new approach is needed to keep capital intact and remain oriented properly. We’ve already made these changes, which you can see in your portfolios on-line.
As regular readers know, we issued the Calling All Cars directive indicating that we have reached an extreme in oversold conditions in the short term. We are playing this bounce with a few new positions in the new leadership groups as well as some basic index exposure. But these are short term trades only with the intent on playing only a recovery rally.Unless conditions improve dramatically in the next few weeks, we’re likely to be back at 60{1de7caaf0b891e8de3ff5bef940389bb3ad66cfa642e6e11bdb96925e6e15654} cash in our equity models. So again, our focus remains on the long game of sidestepping real bear market losses while reallocating our holdings to better valued opportunities.
Blended Asset Strategies – As Expected
As you might guess, our Blended Asset strategies also lost ground in the month of October (4-5{1de7caaf0b891e8de3ff5bef940389bb3ad66cfa642e6e11bdb96925e6e15654}) but these too were contained losses given our diversification to short term bonds and a higher cash position going into October. Nothing made money in October outside of gold so diversification didn’t help much at all.Still we’re in good shape with our remaining positions and finding some excellent entry points in sectors and asset classes that are starting potential new bull market uptrends.
Income Strategies – Holding the Line
The environment for bonds of all sorts has been terrible since July of 2016. Long term Treasury bonds are the worst of the bunch, down over 15{1de7caaf0b891e8de3ff5bef940389bb3ad66cfa642e6e11bdb96925e6e15654} since then in total return, which includes both price and any paltry yield, paid monthly. High yield credit, found in corporate bonds, has long been off our radar as well as the interest paid on these is simply not worth the price risk. Now, High yield credit is finally re-pricing lower as it should. Our income strategies remain focused on the only parts of the income markets where prices are still moving in the right direction and yields are reasonable. These are floating rate funds, bank loans, and short term Treasury bonds – that’s it.The good news is that both income strategies are doing an excellent job preserving capital in this cycle and will be ready to jump back into a very discounted bond market most likely in low grade corporate bonds. Our first years out of the lows in 2009 were very healthy for our income strategies with gains north of 20{1de7caaf0b891e8de3ff5bef940389bb3ad66cfa642e6e11bdb96925e6e15654}.
Magic in the Mix
Our clients know that we build their portfolios using “Profiles” with kitschy names like “Living Right”, “Making the Turn”, “Builder” and “New Investor”. These profiles dictate a certain allocation among our various strategies by category.For instance, a “Living Right” investor is someone 70 years old or more who is living off of their investment accounts, collecting social security, using Medicare and has been retired for quite a while. They would have a prescribed total portfolio allocation as follows:
20{1de7caaf0b891e8de3ff5bef940389bb3ad66cfa642e6e11bdb96925e6e15654} Equity Strategies
40{1de7caaf0b891e8de3ff5bef940389bb3ad66cfa642e6e11bdb96925e6e15654} Blended Asset Strategies
40{1de7caaf0b891e8de3ff5bef940389bb3ad66cfa642e6e11bdb96925e6e15654} Income Strategies
Now let’s do some math and calculate potential weighted average drawdowns in one of our “Living Right” client portfolios in the month of October.
20{1de7caaf0b891e8de3ff5bef940389bb3ad66cfa642e6e11bdb96925e6e15654} X (-6{1de7caaf0b891e8de3ff5bef940389bb3ad66cfa642e6e11bdb96925e6e15654} loss in Equity Strategies) = -1.2{1de7caaf0b891e8de3ff5bef940389bb3ad66cfa642e6e11bdb96925e6e15654}
40{1de7caaf0b891e8de3ff5bef940389bb3ad66cfa642e6e11bdb96925e6e15654} X (-5{1de7caaf0b891e8de3ff5bef940389bb3ad66cfa642e6e11bdb96925e6e15654} loss in Blended Asset Strategies) = -2.0{1de7caaf0b891e8de3ff5bef940389bb3ad66cfa642e6e11bdb96925e6e15654}
40{1de7caaf0b891e8de3ff5bef940389bb3ad66cfa642e6e11bdb96925e6e15654} X (0.0{1de7caaf0b891e8de3ff5bef940389bb3ad66cfa642e6e11bdb96925e6e15654} loss in Income Strategies) = -0.0{1de7caaf0b891e8de3ff5bef940389bb3ad66cfa642e6e11bdb96925e6e15654}
Total October loss -3.2{1de7caaf0b891e8de3ff5bef940389bb3ad66cfa642e6e11bdb96925e6e15654}
Not bad at all and very recoverable.
The point to all of this is that a proper allocation to our three investment categories by age and circumstance is not only recommended and prescribed but very much a matter of your success and tolerance for different types of market conditions. It is hateful to have an Income strategy when stocks are running hot but we love them now, right? The magic of successful investing is to maintain the proper mix of strategies.If you have chosen to ignore our prescriptions and find yourself uncomfortable, we can get you back in line anytime. Our prescriptions have not changed for any of our clients, but you may now understand more why they are important to follow. Please feel free to contact us for a quick check if you feel you are out of sync with our prescriptions.

LIGHTHOUSE PROJECT – by Sean Powers CIO
Our “Lighthouse Project” was designed to provide some guidance on active 401k plans or other self-directed accounts not under our management. With the latest bout of volatility, it might be time to take a closer look at what you own. If you were looking to retire within the next 1-3 years it probably wouldn’t hurt to review your active 401k mix. We have looked at a lot of statements over the last several months, and there are some emerging themes:
- Many soon-to-be retirees have too much risk in their portfolio especially this late in the economic cycle. Yes—overall, things still look decent, but they always do at the end of the cycle.
- Most portfolios are overweight the US. It’s normal to have a bit of “home” bias, but it might be time to allocate away a bit from the US given how much it has outperformed lately.
- Some are heavily overweight Growth versus Value stocks. The cycle of paying for growth stocks at the expense of owning cheaper companies with steady cash flow appears to be topping out. Spreads between the two categories are at some of the widest levels in 20 years.
If you would like us to help review the mix and investment options in your 401k plan—especially if you are nearing retirement– please feel free to reach out to us. We will send you a secure folder to upload your statements.
That’s it for now, stay tuned.
Sincerely,
Sam Jones, President
Sean Powers, CIO
All Season Financial Advisors
