Given all the cross currents in the market, especially in light of the US economy, political forces, Fed policy and global trends, we thought this would be an especially important year to offer our take on what’s happening. On Monday, next week, we will be recording our first ever Red Sky Report LIVE as a video broadcast of our Mid Year Investment Themes. This update will set the stage. We hope you enjoy both the written and upcoming live versions.
Balancing Act
Since late January of 2018, that’s 18 months ago, the markets have been caught in a tough environment balancing between an aging bull market and a pre-recessionary economy. While marginal new highs have made the news in the last couple weeks, we mush all acknowledge a few realities.
1.) Stocks have been unproductive as an asset class. Here are the total returns for various benchmark stock indices from January 25th, 2018 to present
S&P 500 +5.88{1de7caaf0b891e8de3ff5bef940389bb3ad66cfa642e6e11bdb96925e6e15654}
Dow Jones Industrial Average +2.63{1de7caaf0b891e8de3ff5bef940389bb3ad66cfa642e6e11bdb96925e6e15654}
Russell 200 Small Caps -2.73{1de7caaf0b891e8de3ff5bef940389bb3ad66cfa642e6e11bdb96925e6e15654}
All Country World Index +0.60{1de7caaf0b891e8de3ff5bef940389bb3ad66cfa642e6e11bdb96925e6e15654}
All in, we’re talking about annualized returns of 1-3{1de7caaf0b891e8de3ff5bef940389bb3ad66cfa642e6e11bdb96925e6e15654}, a far cry from investors’ built in expectations of 7{1de7caaf0b891e8de3ff5bef940389bb3ad66cfa642e6e11bdb96925e6e15654} returns on their stock money. We would describe the last 18 months as very flat in terms of cumulative returns which included a very nasty 20{1de7caaf0b891e8de3ff5bef940389bb3ad66cfa642e6e11bdb96925e6e15654} decline late last year.
1.) Bonds have been outperforming stocks over the same time period (January 25th to present)
A few examples of total returns here
20-year Treasury bonds (TLT) +9.09{1de7caaf0b891e8de3ff5bef940389bb3ad66cfa642e6e11bdb96925e6e15654}
7-10-year Treasury Bonds (IEF) +8.35{1de7caaf0b891e8de3ff5bef940389bb3ad66cfa642e6e11bdb96925e6e15654}
Interm Muni Bonds (MUB) +6.78{1de7caaf0b891e8de3ff5bef940389bb3ad66cfa642e6e11bdb96925e6e15654}
High Yield Corporate Bonds (HYG) +7.15{1de7caaf0b891e8de3ff5bef940389bb3ad66cfa642e6e11bdb96925e6e15654}
Emerging Market Bonds (EMB) +5.40{1de7caaf0b891e8de3ff5bef940389bb3ad66cfa642e6e11bdb96925e6e15654}
To be clear, for the last 18 months, bonds have outperformed stocks by almost three times.
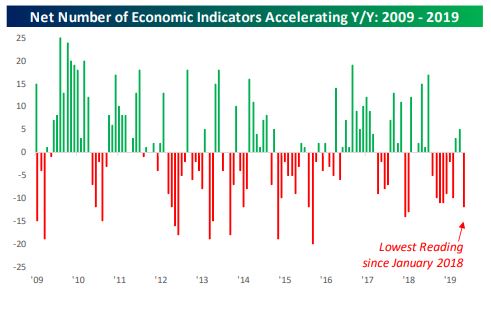
1.) We also know that the Federal Reserve is likely to cut interest rates at the end of this month, confirming all of the market action described above. Essentially, they see enough evidence and feel enough pressure from weakness in global economies, including the US, to justify lower rates. We can try to guess how much influence our president may be exerting on the Fed, bit it’s not really worth much of your brain power. We can’t know. But it would be foolish to assume, given all the evidence in the market and weakening indicators in the economy, that the Fed is dropping rates purely on the basis of political pressure. The reality is that the Fed is still following the data and the data says we are in a pre-recessionary environment. Bespoke Institutional tracks an entire Matrix of economic indicators monthly on the basis of year over year changes. They look at everything from manufacturing to employment, inflation, housing and consumption and develops a net aggregate index of all indicators. As things get weaker in aggregate on a net basis, the index falls. Here’s the important takeaway.
Even though stocks have rebounded back to the highs of the last 18 months (give or take), the matrix of economic indicators as now at its LOWEST level since January of 2018.
Which bring us to our next reality check…
1.) The stock market has rebounded in 2019, purely on the expansion of multiples and buybacks
Okay, let me explain in basic terms. Strangely, in 2018, stocks lost money even while earnings continued to run pretty healthy. There was a lot of fear regarding trade wars and the Fed overshooting on interest rate hikes, etc. From an actual earnings perspective, the losses were unjustified, and the market quickly rebounded on that reality. Now, the situation is almost opposite. Gains thus far in 2019 have happened almost entirely on the back of share buybacks from corporations and technical price action rather than coming from the support of earnings. We call this “Multiple Expansion”. Take a look at this recent data from JP Morgan.
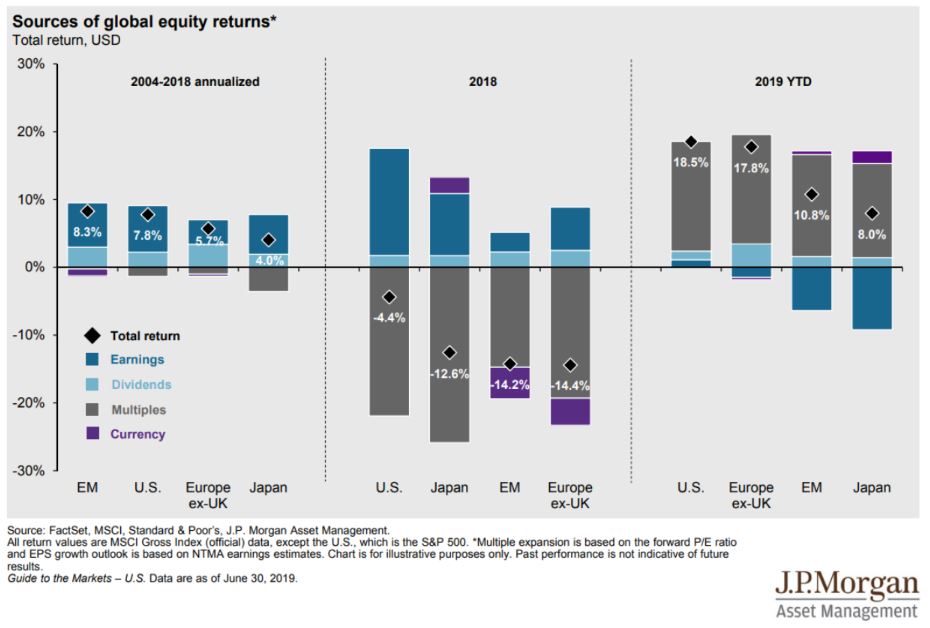
Obviously, you can see the reversal of conditions between 2019 and 2018. The positive big grey bars in 2019 tell us that prices are moving higher without earnings leading us to the recognition that stocks have possibly become wildly overvalued again. There are only two variables that will improve this situation. The first is that interest rates drop dramatically making stocks comparatively cheaper. The second possibility is that we see actual earnings turn up. On Monday, earnings season begins. At the end of the month, we’ll find out if the Fed is going to cut interest rates.
This is an important moment of truth for the markets. Expect higher volatility from this point forward.
1.) Technical Conditions Are Still Healthy for Stocks in the Short Term
Despite all of the above, we cannot complete a Mid-Year Assessment without pointing to a few positive technical developments since the lows in May. Price trends are up and we cannot argue with that reality. Stocks, bonds and commodities are all trending higher giving us a clear opportunity to remain fully invested in almost all strategies. Many of the canaries in the coal mine are healthy and alive including strength in oil prices, high yield corporate bonds. In recent days, we have even seen a return in relative strength to technology, cyclicals, transportation, basic materials, etc. The market is orienting slowly toward an environment that is not recessionary. It is telling us quietly that IF the Fed cuts rates now, and earnings coming in healthy, that we might avoid a recession. The market might be right, but that feels a little too optimistic given the bigger picture. Technically our Net Exposure model went back on a buy in June after the May Massacre. We have been almost fully invested since mid-June and our various strategies are tracking higher with the stock and bond markets nicely. But, the recent highs and recent strength in the more cyclical side of the market needs to persist for a few more weeks for us to believe either are sustainable.
Tune in to the Red Sky Report Live which we hope to deliver by the end of next week. Sean Powers and I will talk more in depth about the details presented here as well as digest some new opportunities in gold, deep value and a few special situations.
We hope you enjoy the show.
Cheers
Sam Jones
