This is an incredible moment in time. This week marks the 10 year anniversary of the bottom of the bear market of 2007-2009. In addition, as of this week, prices have moved back to a critical resistance level which marked the breakdown point from last year. Furthermore, we have a tenuous balancing act in play in our Federal Reserve policies, the status of trade wars and another pending government shutdown/ constitutional crisis (thank you Mr. Trump). And finally, the three horsemen of retail, housing and employment numbers appear to be turning in the direction of recession.Wow! With all of this in mind, this is a great time and place to look at long term returns. Why?Because investors need to set expectations right here, right now and make plans accordingly.
The Worst Entry Point in Stock Market History – By Ben Carlson
Ben does some good work and offers great historical context for investors in his weekly blog, “A Wealth of Common Sense”.Google it, Read it, Good stuff.He got right to the point in his latest post titled above. Here’s a cut of the important stuff looking at long term returns.
The 35 year period from 1930 to 1964 produced a total return of 2234{1de7caaf0b891e8de3ff5bef940389bb3ad66cfa642e6e11bdb96925e6e15654} or 9.4{1de7caaf0b891e8de3ff5bef940389bb3ad66cfa642e6e11bdb96925e6e15654} on an annual basis for the S&P 500 index.
The 35 year period from 1965 to 1999 produced a total return of 5947{1de7caaf0b891e8de3ff5bef940389bb3ad66cfa642e6e11bdb96925e6e15654} or 12.4{1de7caaf0b891e8de3ff5bef940389bb3ad66cfa642e6e11bdb96925e6e15654} on an annual basis for the S&P 500 index.
The 19 year period from 2000 to 2018 produced a total return of 147{1de7caaf0b891e8de3ff5bef940389bb3ad66cfa642e6e11bdb96925e6e15654} or 4.9{1de7caaf0b891e8de3ff5bef940389bb3ad66cfa642e6e11bdb96925e6e15654} on an annual basis for the S&P 500 index.
One of these things is not like the others.
To put this into perspective, for the 35 year period from 2000-2034 to earn the same return as the 1930-1964 time frame, the S&P 500 would need to earn roughly 15{1de7caaf0b891e8de3ff5bef940389bb3ad66cfa642e6e11bdb96925e6e15654} per year from 2019-2034.
For the 2000-2034 period to earn the same 12.4{1de7caaf0b891e8de3ff5bef940389bb3ad66cfa642e6e11bdb96925e6e15654} annual return as the 1965-1999 performance, it would have to see 22{1de7caaf0b891e8de3ff5bef940389bb3ad66cfa642e6e11bdb96925e6e15654} annual gains over the next 16 years.
I’m not a gambling man but I think I’d take the under on this one.
Ben goes on to talk about how the worst entry point in history is currently the year 2000 given the massive underperformance of the last 19 years for US stocks. He also highlights the fact that our current 4.9{1de7caaf0b891e8de3ff5bef940389bb3ad66cfa642e6e11bdb96925e6e15654} average annual return number is reserved for an investor who has been 100{1de7caaf0b891e8de3ff5bef940389bb3ad66cfa642e6e11bdb96925e6e15654} invested in the S&P 500 with dividends reinvested and never sells at the lows, nor buys at the highs. Well, that’s not realistic is it because investors have a proven history of buying near the highs, selling virtually everything at the lows and missing the bulk of rising bull markets, sitting on the sidelines wishing they hadn’t sold everything. Dalbar conducts studies on actual investor returns looking at rolling 20 year windows and routinely finds that investor returns are regularly less than 1/3 of the real results generated by either stocks or bond indices based on (bad) behavioral issues.
Let’s safely say that for investors who started in the year 2000, the typical portfolio might yield an average annual return of 1.62{1de7caaf0b891e8de3ff5bef940389bb3ad66cfa642e6e11bdb96925e6e15654} (4.9{1de7caaf0b891e8de3ff5bef940389bb3ad66cfa642e6e11bdb96925e6e15654} minus 66{1de7caaf0b891e8de3ff5bef940389bb3ad66cfa642e6e11bdb96925e6e15654} for bad behavior). I think that number is high based on what I’ve seen from viewing many many statements. The lesson here should be clear. Bear markets are devastating to wealth and it takes a very long time for investors to first recover and then make real headway in terms of positive returns.Ten years ago this week, stocks bottomed after a two year bear market that wiped out 54{1de7caaf0b891e8de3ff5bef940389bb3ad66cfa642e6e11bdb96925e6e15654} of market value. Ten years later this week, The S&P 500 is up 307{1de7caaf0b891e8de3ff5bef940389bb3ad66cfa642e6e11bdb96925e6e15654}. Sounds big but the long term numbers going back to 2000 don’t lie. It’s just barely 5{1de7caaf0b891e8de3ff5bef940389bb3ad66cfa642e6e11bdb96925e6e15654} annually. The S&P 500 didn’t even make it past the 2000 highs until the year 2013. That is a zero {1de7caaf0b891e8de3ff5bef940389bb3ad66cfa642e6e11bdb96925e6e15654} return for 13 years! During that same 13 years, our flagship All Season strategy continue to generate an average annual return of 4.3{1de7caaf0b891e8de3ff5bef940389bb3ad66cfa642e6e11bdb96925e6e15654} net of all fees for a total gain of 71{1de7caaf0b891e8de3ff5bef940389bb3ad66cfa642e6e11bdb96925e6e15654} (please see our composite performance disclosures). Here’s a picture of our All Season strategy results in Red compared to the S&P 500 in Green. The period between the vertical white poles is the 13 years under discussion. You get the idea.
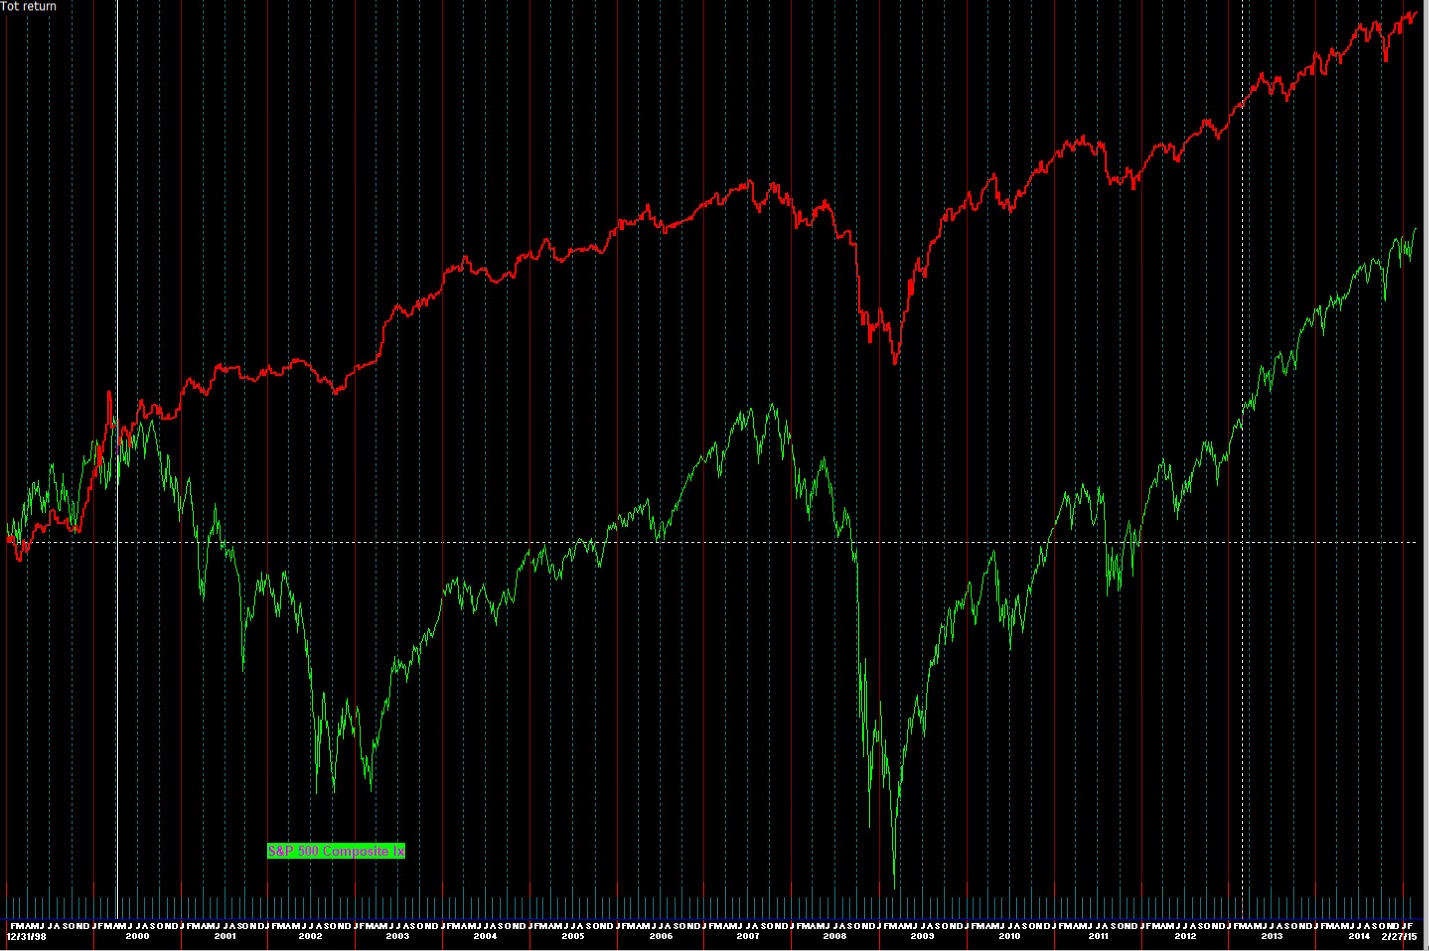
On our website, we answer the question of “WHY” managing market risk is a priority in our firm.The answer is because LIFE IS SHORT! Who has 13 years to experience a massive loss and recovery cycle that just gets you back to even?
Now let’s bring it home to today’s market and why all of this matters.
As I mentioned above, this is an important moment in time. The market and the US economy are both on edge. We could shoot higher in both or 2019 could be the last year before an economic recession in the US. We’re in the later camp. We think this is the last year of growth, just like the year 2000. Now that housing prices are in decline along with retail spending and we’re seeing the first signs of weakening employment numbers, it seems like the odds are pretty high that recession is coming. Bespoke ran a very timely “pros and cons” piece this week. If you look at the nature of the “pros”, I would put them in the hopeful, conflicted and backwards looking camp while the list of cons is heavy, meaningful and current.Half empty… half full, you choose.
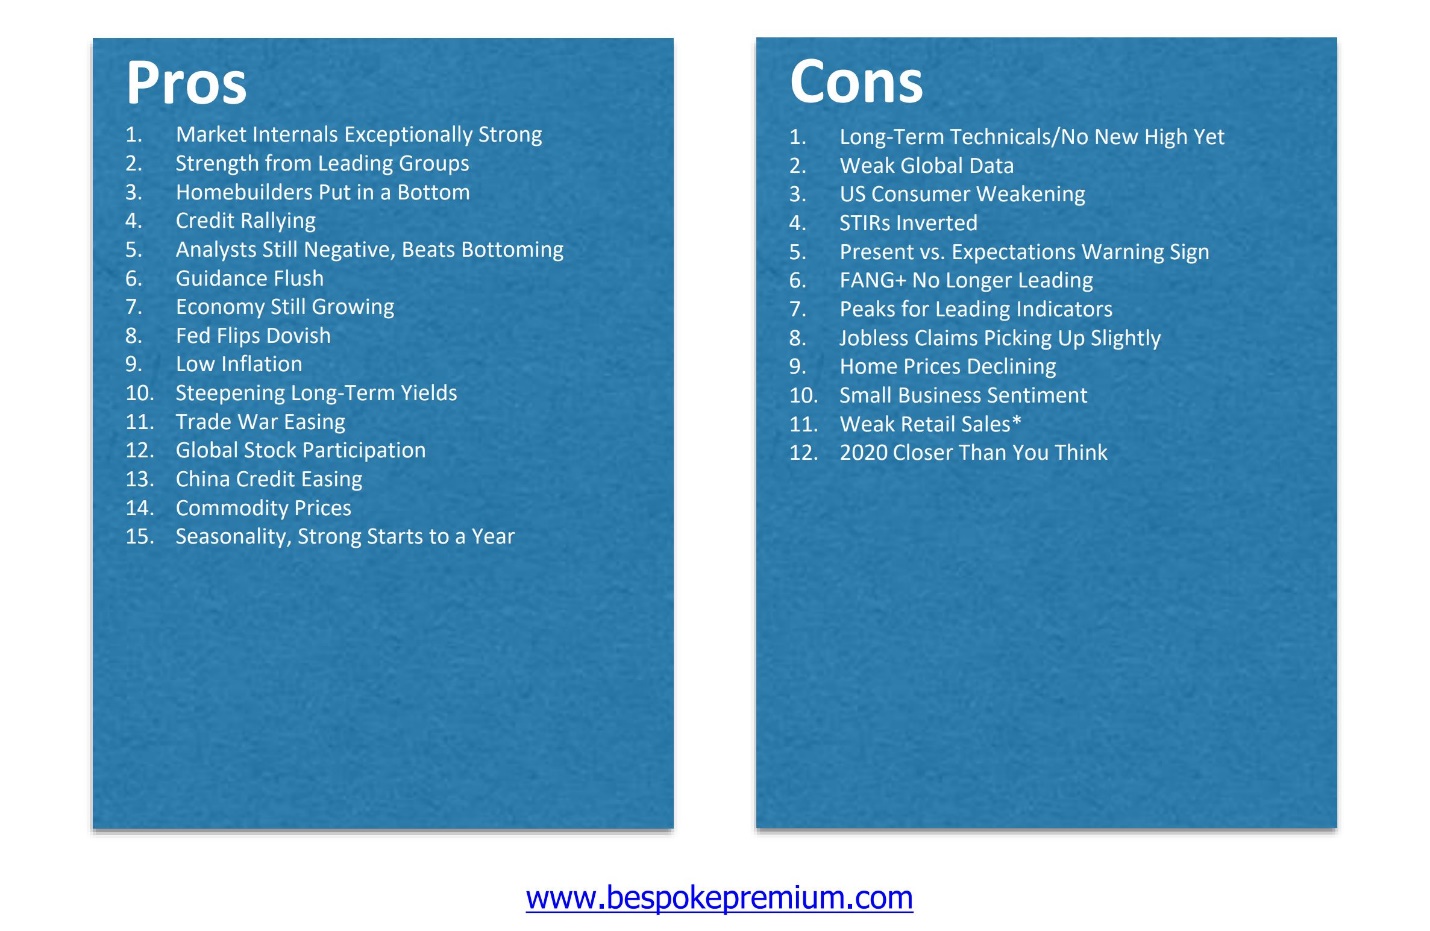
Conflicts:
- Pros #2 and Cons #6 ?
- Pros #3 and Cons #9 ?
- Pros #10 and Cons #4 ? (steepening or inverted?)
- Pros #8 and Pros #7 (why is the Fed Dovish if the Economy is still growing?)
Trade War Easing? Is a delay of a tariff deadline “Trade war easing” ?
So, now is the time and place to think about your long range return realities and needs. Perhaps you have been in the 4-5{1de7caaf0b891e8de3ff5bef940389bb3ad66cfa642e6e11bdb96925e6e15654} camp with the rest of us.That number could get better if prices continue out to new highs and beyond. Or they could get worse if this is the end of the current bull market and the last year before recession. Do you know what you need to earn to hit your retirement or income goals? I’ll bet it’s 4-6{1de7caaf0b891e8de3ff5bef940389bb3ad66cfa642e6e11bdb96925e6e15654} at a minimum.
Now, the markets have retraced almost all of the losses incurred in the 4th quarter but remain 4{1de7caaf0b891e8de3ff5bef940389bb3ad66cfa642e6e11bdb96925e6e15654} below the highs of last October. This might just be a magical moment to consider taking profits, playing defense and ultimately avoiding another massive loss and recovery cycle.Remember Life is short!
Our clients can rest easy as we have already taken profits from gains made in January and February.We’ve got cash ready to reinvest if we must, but we’ll let the market prove that it wants to go higher at this important juncture.
That’s it for now, enjoy the late winter!
Cheers
Sam Jones
