This is sort of a big deal. Since late October of 2018, our Net Exposure model has remained stubbornly negative ranging from deeply negative at the end of the year to hovering just below the zero line. Last Friday, the model turned definitively positive with the close of the week.This changes our view regarding future market opportunities as we move from trading with short term expectations to investing with a longer-term vision. Read all about it!
Trading versus Investing
Regular readers know that we have been in “trading mode” since the lows in December. We have done so by simply buying free to trade index exposure and letting the market recover back to the March levels. At that point, we took profits on many positions on the basis that prices had moved back to an obvious inflexion point. A simple look at any chart of the broad market tells the story.
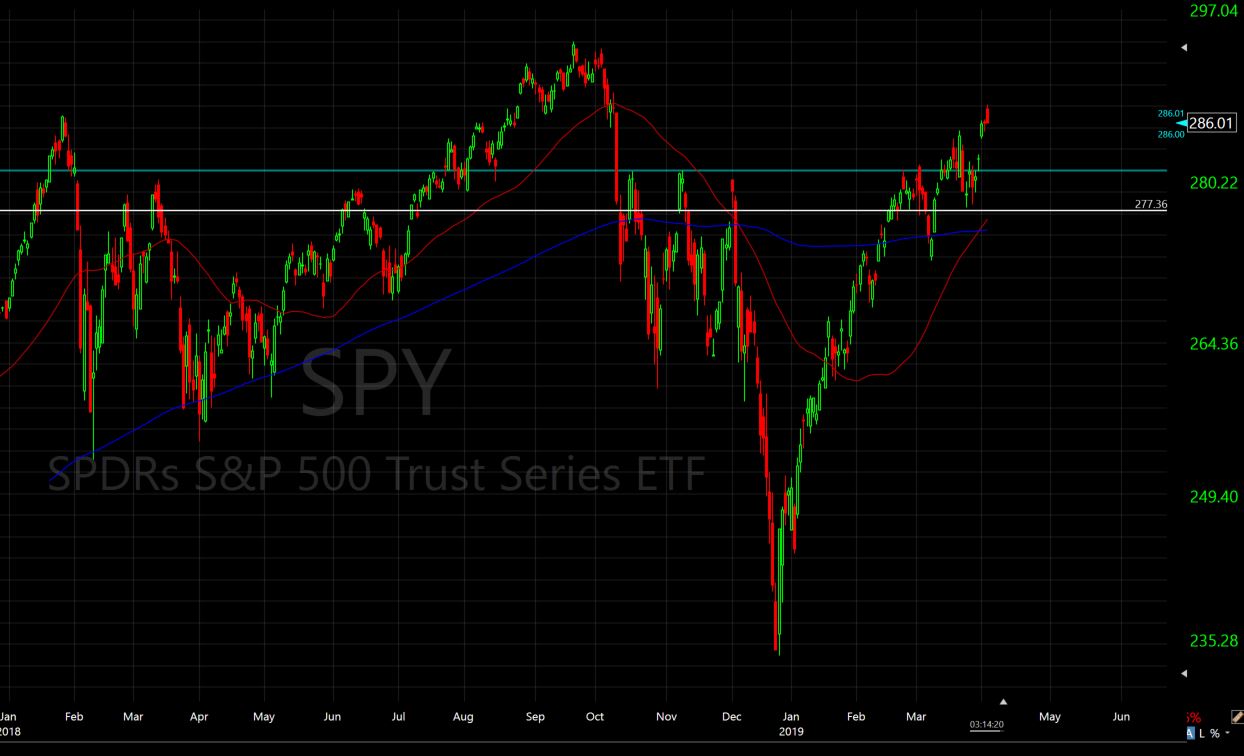
Here’s a quick snapshot of the S&P 500 with horizontal lines marked as the inflexion zone where we would expect to see profit taking and another leg down. This is the place and time where we took profits on our “trades” from December. In the end, there was no selling and prices have now moved up and out.

Thus far in 2019, we have owned the broad US and Emerging markets via indices even while our Net Exposure model remained negative. They say that investors must have discipline to follow their rules but the wisdom to know when to break them. This was one of those wisdom times and it was hard for us to invest aggressively staring directly at a negative model reading week after week. We made some ok numbers and it’s nice to start the year with some solid gains. But now, the situation has changed – for the better. Technically, there is more to like about this market in many areas including breadth, volume, rising long term moving averages, participation from cyclical sectors and global markets.
Some will crinkle up their forehead and say, “of course this is a new uptrend, I knew it all along”. Well, to that we would calmly and respectfully reply… “no you didn’t”. There are a great many investors who have perfect hindsight, but there are very few with a defined system or process of any sort that validates or refutes their emotional decisions.
Thus far, it appears the market is pricing in several things. First, it is pricing in a deal with China. We’ll see. Second the market is pricing in no recession (more on this in a minute). Third, the market has priced in nearly two rate cuts from the Fed – we’ll see part III. On top of these unknowns we have a new earnings season directly around the corner and there is little doubt that earnings will impress us with year over year comparisons. So what’s to like about this market? Nothing really, it’s the same overbought, pre-recessionary environment we have been in since last October.
What Changes Are We Making Now?
I’m glad you asked because we know that we have a positive Net Exposure reading from our model, we do need to make some changes. After all, this is our system and our system says to add exposure so that’s what we do.
Here’s what we are buying:
More Emerging markets index ETFS
Initiating new positions in Asia/ China which broke out this week on trade talks
More Commodities which are breaking out to new 52 week highs again (Oil moving toward $70!)
More Preferred Securities which pay 6{1de7caaf0b891e8de3ff5bef940389bb3ad66cfa642e6e11bdb96925e6e15654} interest and move like a stable stock
Sector funds in Industrials, basic materials, and adding to our oversized semiconductor funds
Funds that benefit from a falling dollar
We have also reduced our giant overweight position in Treasury bonds, especially long dated Treasuries as they have appreciated fully and completely over the last 6 months. It’s not that we hate bonds, it’s just that most of the easy money in Treasuries is behind us now.
All in, we have made a lot of changes to our portfolios in the last three days without buying into the US market as a whole just yet. We see the international space as far more attractive for many reasons and are engaging with sectors that still have far more upside potential than most US based index funds. Small caps look interesting but haven’t given us the green light yet. This is still a market environment that demands selectivity and one that is still very prone to recessionary risk. Investors need to remain vigilant about maintaining stops, picking the right investments and avoiding those that are likely to pay dearly as we move closer toward recession. What a great segue!
Is Recessionary Risk Gone Now?
Not in the least.
Let’s review the facts:
Recessionary pressure is so real that the Federal Reserve has gone from aggressively raising rates and reducing their balance sheet to an outwardly dovish policy of potentially cutting rates once or twice this year. They are very likely to begin some form of QE again after that, I’m guessing 2020.
Stocks have not made a new high! – Earnings have peaked!
Bonds have made a very dramatic new high – indicating recession is coming
The yield curve is inverting now – set your clock – recession comes 9-12 months later.
2/3 of all companies are now citing wage pressure as a major concern – yes to their earnings.
Unemployment numbers look like they are bottoming and may be reversing up.
Consumer Confidence has likely peaked
The Conference Board of small business confidence has likely peaked
Retail spending numbers are falling off a cliff.
The benefits of tax cuts are peaking now (share buy backs, M and A activity), less benefit looking forward.
Last week, Bespoke reported that 20 of 31 economic indicators came in weaker than expected (again)
So that’s a lot of evidence that the US economy is still angling toward recession, even more so now than at the end of 2018 when stocks were much much lower.
The Most Important Thing You Must Understand
This is that situation where the end game seems pretty obvious (global recession) but we have a timing consideration, and this is important. Quite often, some of the best periods for stock market gains occur in the last 9-12 months of a significant multiyear bull market, even after a mild yield curve inversion. Think about 1999 when we saw the Nasdaq up over 100{1de7caaf0b891e8de3ff5bef940389bb3ad66cfa642e6e11bdb96925e6e15654} and the S&P up 20{1de7caaf0b891e8de3ff5bef940389bb3ad66cfa642e6e11bdb96925e6e15654}. In 1999, Berkshire Hathaway had one of its worst years ever, losing over 20{1de7caaf0b891e8de3ff5bef940389bb3ad66cfa642e6e11bdb96925e6e15654} while the broad market was up as much. Berkshire Hathaway is down so far in 2019. The real bear market started in 2000 and Berkshire made money all the way through. We may be buying BRKB! 2007 was another whopper year for stocks, just prior to the 2008 financial crisis. This situation feels a lot like the late 90’s to me with many of the same variables in place including the sharp decline in 1998 that looks just like the 4th quarter of 1998. Value shops like Berkshire were being trashed and investors were chasing hot tech stocks.
Years ending in 9???Dunno
So, there is the real potential for an exhaustive move higher in stocks in 2019. I say exhaustive because it would be, could be the last up year for a while. We’re playing it just like that.
Stay tuned!
Sam Jones

