I’ve received a lot of positive feedback from our last post titled, “Exit Stage IV”. That tells me that our readers are hungry for more knowledge and education regarding market and economic cycles, where you should put your money and what we can expect next. The current situation is pretty classic and obvious at the moment, which serves nicely as a textbook case to study. I’m going to throw in one of my favorite “behavioral econ” charts for your entertainment as well to help you see your own pattern of psychology as it relates to investment decisions over time.
Angling Toward A US Recession – Timing and Evidence
The US economy is now accelerating toward recession.We monitor six key economic variables and many more market indicators to help us establish the probabilities of a future recession. At the moment, indications point to the Fall of 2019 as the formal start of a US recession. Economic reports are now quacking quietly, and market internals are quacking loudly.
… from the economic side of things
Claims for Unemployment just jumped above the 52 moving average!
Source: Sentimentrader.com
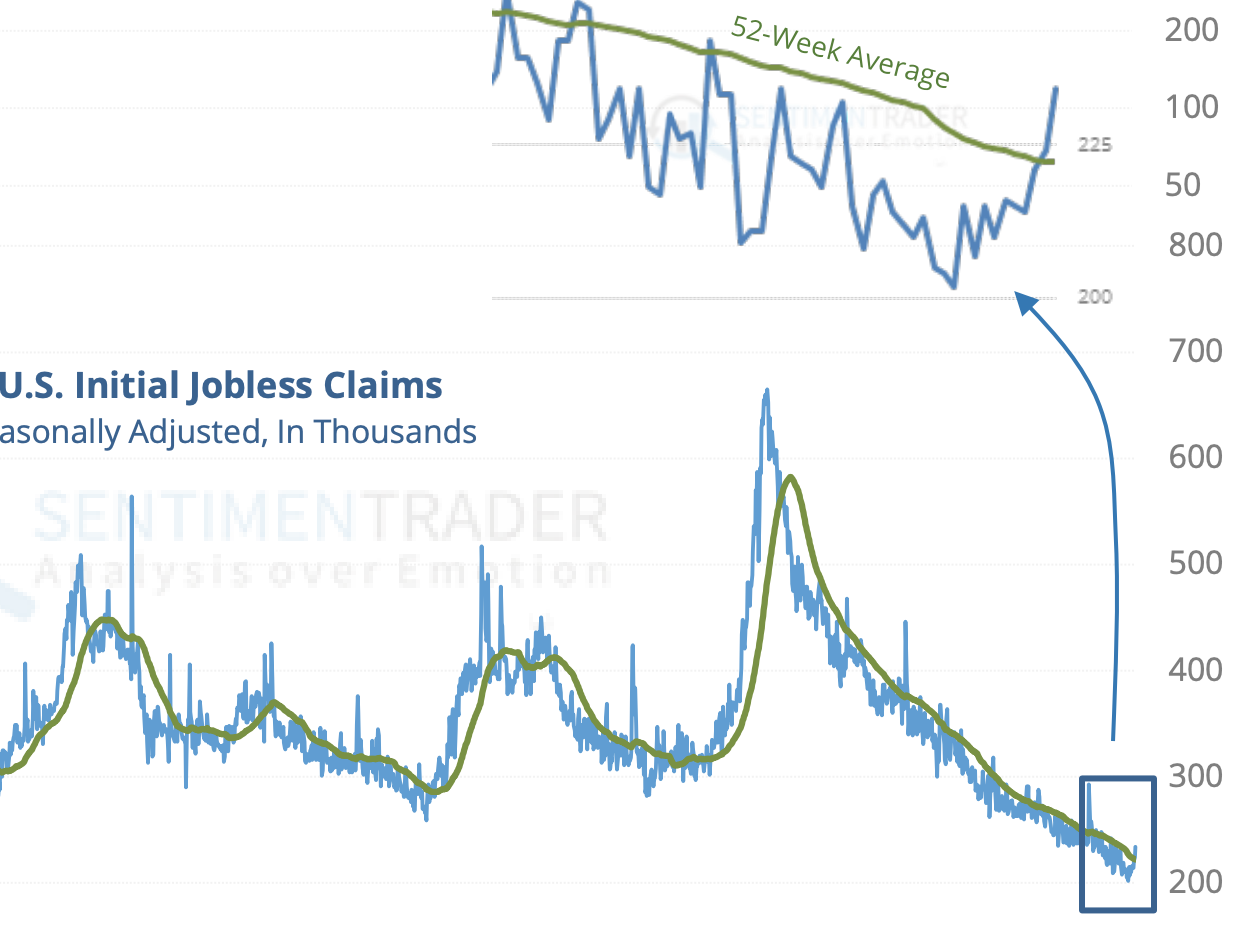
In addition, Mr. Powell, the head of the Federal Reserve just told us that things are getting softer in the economy and rates are now approaching neutral. What he did not say is that the Fed is not going to raise rates in December (which they will), nor will they stop selling their own bonds in an effort to reduce the Federal balance sheet (which they won’t). Rising rates are essentially becoming a bigger headwind for our economy but the tightening cycle is not done if history is our teacher.
The Treasury bond yield curve is also now essentially “flat” meaning short term rates are about the same as long term rates. If the Fed, moves again in December, the curve will be formally flat. Flat yield curves serve as a stop watch for pending recession. Nine months is typically the lead time.
Things that have not (yet) given way, are the index of Leading Economic Indictors which in recent cycles has not been a leading indicator at all – more coincidence.Consumer spending has also held strong and will no doubt continue through the holidays, but we’re guessing this will be the last big consumption spree for a while.
… from the market side of things.
The market is clearly telling us that recession is coming. Here’s another long time favorite chart of sector rotation for the various stages of market and economic strength. Study this for a bit.
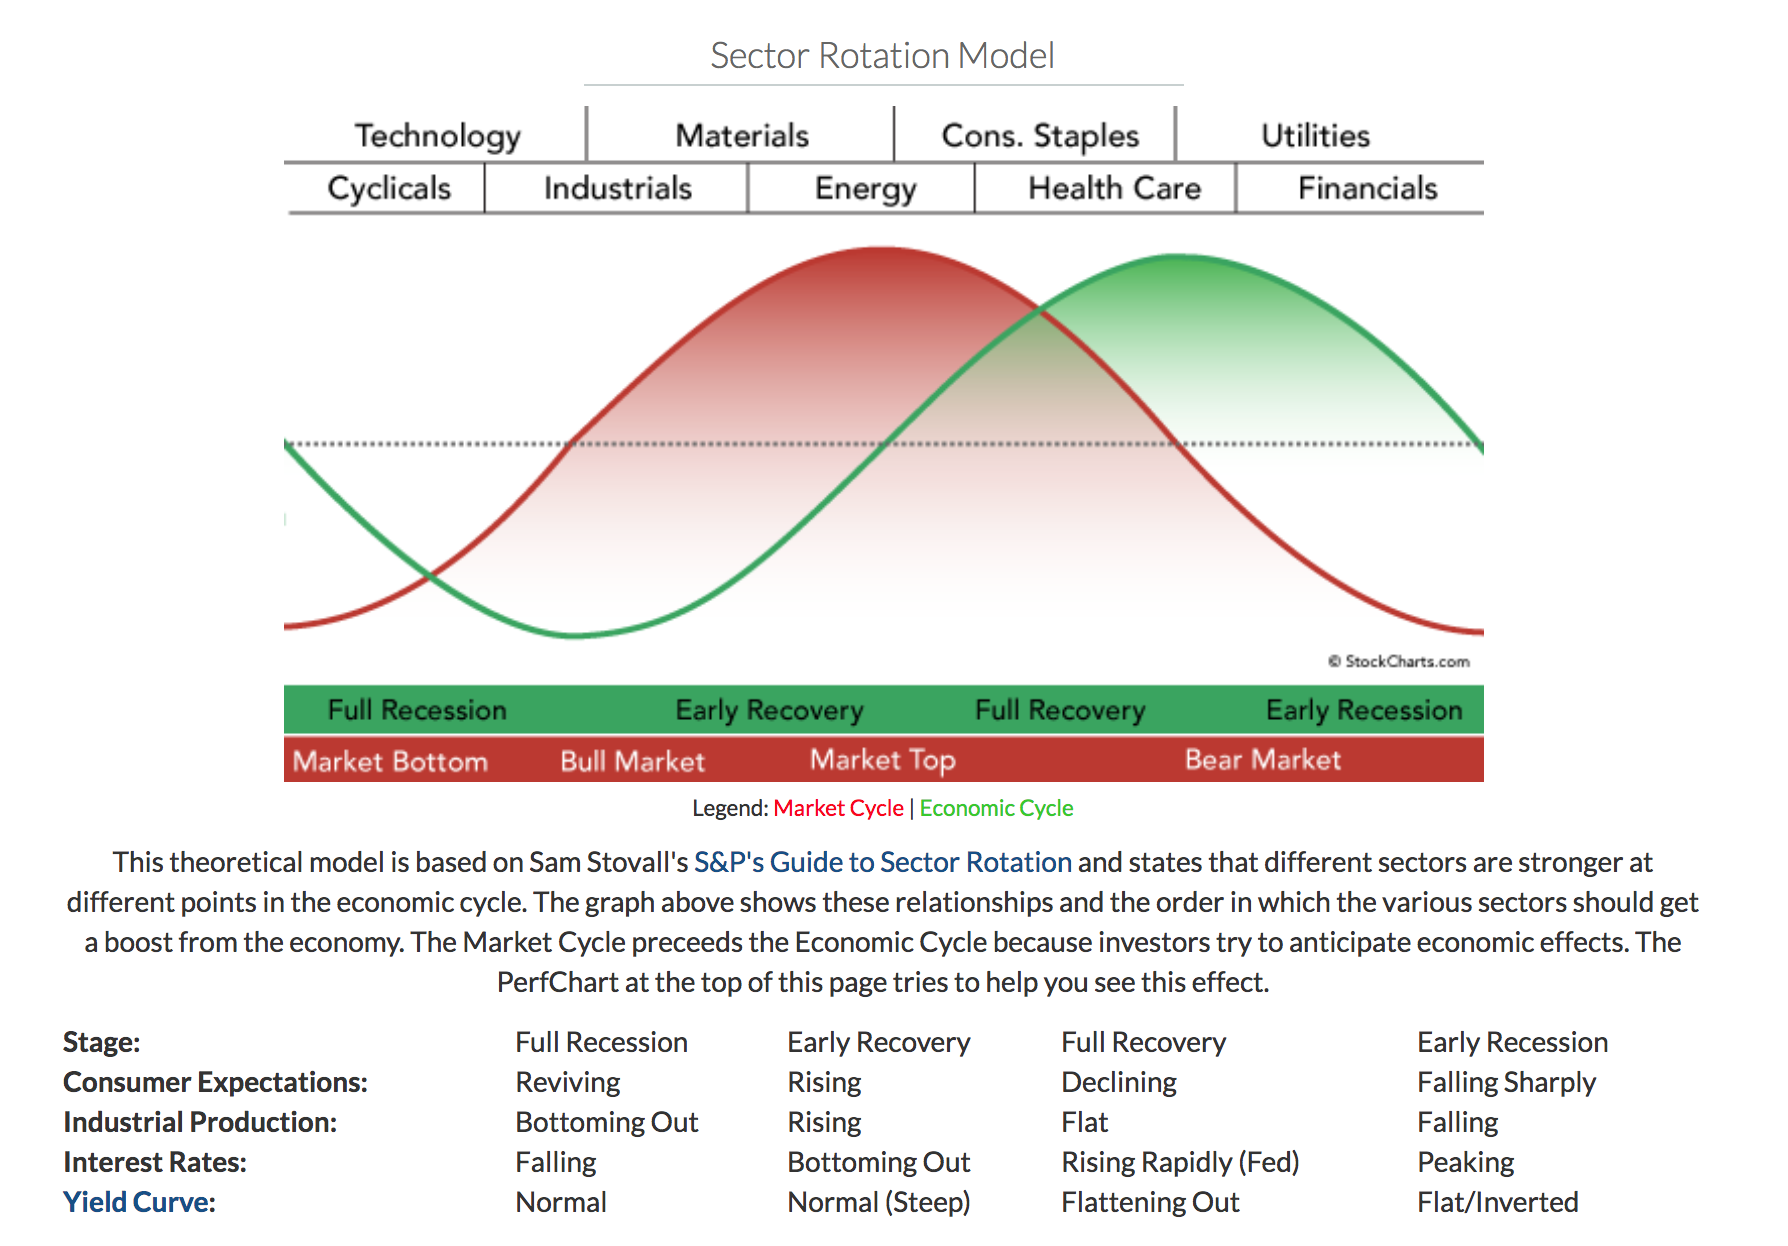
We are in the Early Recession phase, waaaaay off to the right, where sectors like Healthcare, Utilities and Consumer Staples outperform. Next up are Financials but they only tend to run AFTER a recession is clear and present and we are well into a bear market in stocks. Neither of these has happened yet. You might also notice that a top in energy is often a bell ringing event for a serious market top. Energy is now in a bear market.
It is worth mentioning that this chart is not scaled to show duration.This is oversimplified and designed to teach the cycle rotations. There are also much wider gaps in time between the market and the economy than what this chart indicates. For instance, it looks like the markets find a low just as the economy is topping out.This is not true in the least.The market peaks 6-9 months before the economy but the bear markets that follow typically last 18-24 months just as we see the formal headlines of recession. In other words, don’t “buy” that headline when you see it.
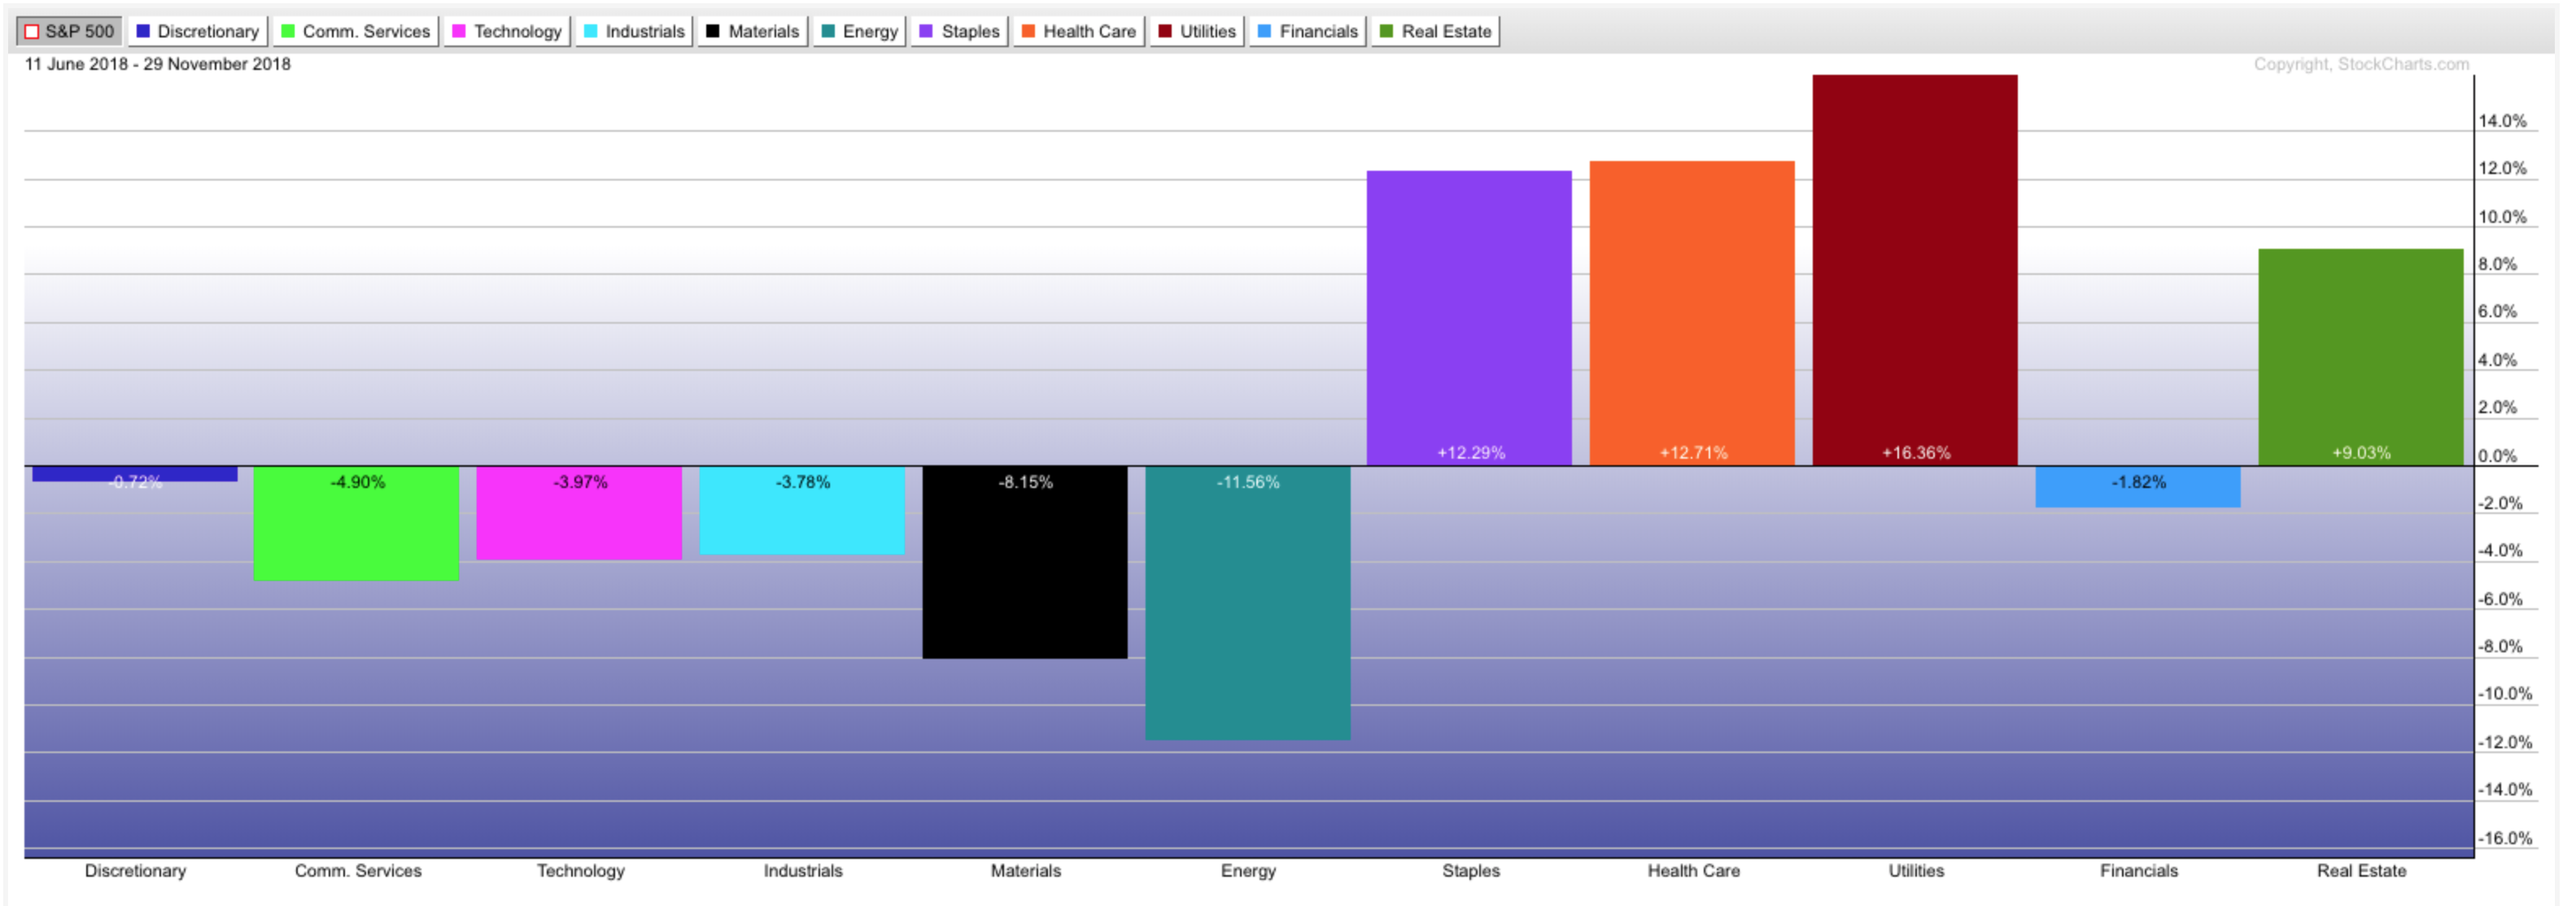
Next is a simple performance chart of the last 120 market days.
You see which sectors are clearly dominating the strength in the market and which are not. As the cycle chart indicates, we are getting confirmed strength in the early recession sectors.
QUACK!
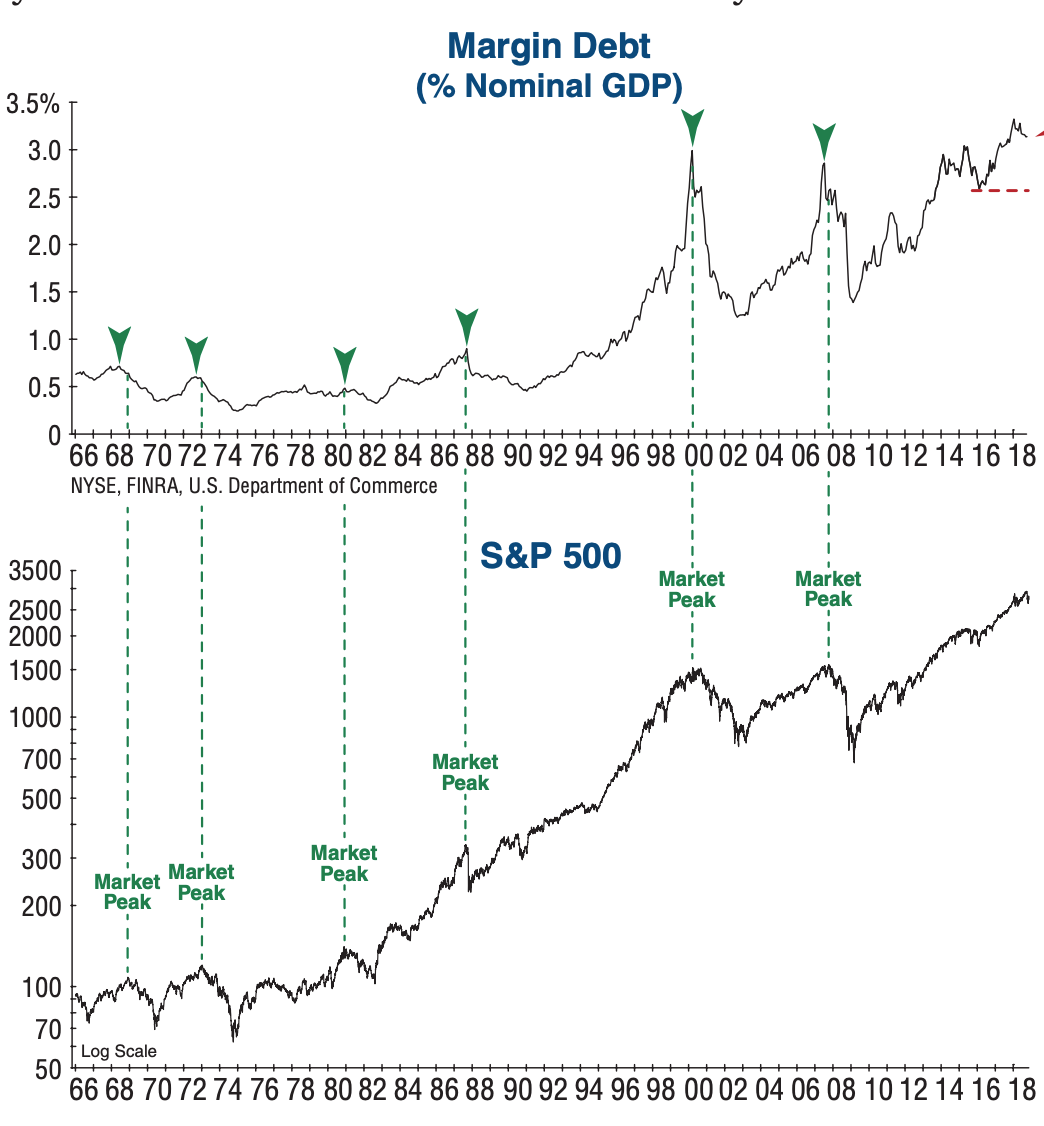
Margin debt is also now in decline.
Source: Investech Research
The margin debt numbers ending October, were terrible (down) and this is very important. You have to understand that many institutional investors and professional money managers use leverage in their investment programs. When stocks decline in value beyond a certain point, those who lend money “on margin” make margin calls to the borrowers effectively telling them to come up with more cash or they need to sell their collateralized stock holdings. We are talking about a forced sell of securities whether or not the investor wants to sell even as the stock might be down 20-30{1de7caaf0b891e8de3ff5bef940389bb3ad66cfa642e6e11bdb96925e6e15654} already. This is where “Non-systematic” risk enters the equation.These are external events, caused by years of accumulated excess, that drive prices down much, much further than anyone would think possible. Take a peak at GE if you need an example. So Margin Debt has now peaked. Stocks tend to peak around the same time. 2015 should have been another bear market peak but it worked out to the upside. This time is different in many ways.
Leadership is Gone
I won’t beat this dead horse but we don’t need to sell the idea that the FAANG stock bull market is over. Investors are just waiting for a better moment to get out, as they should. But the cycle has turned, long term uptrend lines are broken and our leaders of the last decade are headed to the back of the line. These are all great companies but there are just more sellers than buyers now and that’s all that matters. They said Microsoft could never go down in its hay day in 2000. Well it did and it took 14 years for the price to make an all time new high. No one has 14 years to hold and hope for a recovery.
So those are just some of the key elements quacking about what seems to be a pretty obvious situation in the markets and now the economy.
Market Price Patterns in a Pre-recessionary Environment
If we are within 9-12 months of a recession, we should expect to see the broad US stock market returns taper to single digit gains (or losses) with a substantial increase in weekly volatility. That action pretty much defines the situation in 2018. This is a time to prepare and get your risk exposure contained to a place where you can sleep at night and not worry about your net worth. This is a time to start rebuilding your bond portfolio and looking for sectors, countries and asset classes that are still moving higher in a non-correlated way to the broad US stock market. This is a time to begin slowly adding hedges as we are doing now with short funds (high yield and small caps so far) and our new options collar program.Strong rallies like we saw last week are opportunities to upgrade to more recession proof holdings or just cut exposure as needed. Be slow about your buys and quick with your sells in general. Let things prove to you that they are trending higher sustainably by observing the slope of moving averages and avoid the temptation to buy new lows in anything.
Pre-recessionary markets are very devious. They seem intent on sucking in a lot of investor money with very convincing moves higher (happening now?). But ultimately, these attempts fail and we look back wishing we had sold the rally. Keep your eyes on the big picture and the elevated risk structure of the markets.
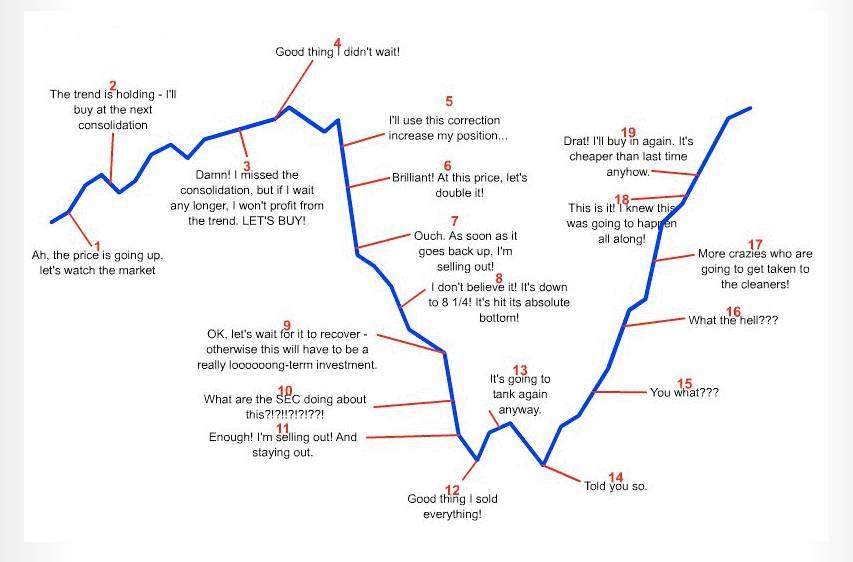
I’ll finish with another final favorite.
Investor behavior over a full market cycle – Enjoy
Hint – we are somewhere between #5-#7
Sean Powers, CIO will be writing up his monthly review of our current investing approach including winners and losers, new risk and new opportunities. Keep your eyes open for that to stay tuned with our current positioning.
Happy December!
Sam Jones

